E. C. Merem 1, Y. A. Twumasi 2, S. Fageir 3, D. Olagbegi 1, J. Wesley 1, R. Coney 1, Y. Babalola 1, T. Thomas 1, A. Hines 4, G. Hirse 4, G. S. Ochai 5, E. Nwagboso 6, M. Crisler 1, S. Leggett 7, J. Offiah 1, S. Emeakpor 8
1Department of Urban and Regional Planning, Jackson State University, 101 Capitol Center, Jackson, MS, USA
2Department of Urban Forestry and Natural Resources, Southern University, Baton Rouge, LA, USA
3Department of Social Sciences, Alcorn State University, 1000 ASU. Drive, Lorman, MS, USA
4Department of Public Policy and Administration, Jackson State University, 101 Capitol Center, Jackson, MS, USA
5African Development Bank, AfDB, 101 BP 1387 Avenue Joseph Anoma, Abidjan, AB 1, Ivory Coast
6Department of Political Science, Jackson State University, 1400 John R. Lynch Street, Jackson, MS, USA
7Department of Behavioral and Environmental Health, Jackson State University, 350 Woodrow Wilson, Jackson, MS, USA
8Department of Environmental Science, Jackson State University, 1400 John R. Lynch Street, Jackson, MS, USA
Correspondence to: E. C. Merem , Department of Urban and Regional Planning, Jackson State University, 101 Capitol Center, Jackson, MS, USA.
| Email: |  |
Copyright © 2024 The Author(s). Published by Scientific & Academic Publishing.
This work is licensed under the Creative Commons Attribution International License (CC BY).
http://creativecommons.org/licenses/by/4.0/

Abstract
Amidst ongoing changes in the farm sector, the disbursement of farm aid, continues to improve the welfare of growers involved in agricultural activities within the South-Central region of California. Aside from its role as a vital tool meant to maintain the delivery of government assisted farm programming directed at the needy. In the last several decades in the country, the disbursement of federal agricultural assisted programs has risen enormously in line with commitments geared at accelerating the productive capacity of farms considered eligible. With the financial packages earmarked for agri-business tied to few commodities (cotton, corn, rice, wheat), as well as natural disaster payments, and conservation reserve program. The listing of fruits, vegetables, and dairy items indispensable to healthy life seems relegated to the background in a setting mostly beneficial to corporate farms. In the process, the adjoining sensitive ecosystems in California’s South Central saw risk exposures from the widespread treatment of farms and with agro-chemicals encompassing various volumes of insecticides and nutrients to optimize output. Despite the recurring environmental consequences of farm aid, quite little is known of the dangers in the South-Central region of California using up-to-date geospatial tools as analytical devices. This enquiry will fill that gap by evaluating the ecological effects of farm assistance in the study area with emphasis on issues, trends, impacts, and the inherent factors. Utilizing secondary data handled by mix scale methods of descriptive statistics connected to Geographic information Systems (GIS). The results show extensive payout in subsidy from 1995-2020 for commodities, disaster payments, conservation, together with land use changes, loss of farms and irrigated areas, rising use of chemicals (fertilizers and insecticides) and impacts. In as much as GIS mappings pinpointed spatial diffusion of the patterns over the periods evident in several spots in the eight counties, some of the emergent concerns remain linked to socio-economic, ecological, policy and global factors situated within the larger agricultural structure. For remedy, the paper proffered solutions ranging from consistent policy to the design of environmental information system and monitoring.
Keywords:
Farm aid, GIS, Region, Impacts, Factors, California’s South-Central Region
Cite this paper: E. C. Merem , Y. A. Twumasi , S. Fageir , D. Olagbegi , J. Wesley , R. Coney , Y. Babalola , T. Thomas , A. Hines , G. Hirse , G. S. Ochai , E. Nwagboso , M. Crisler , S. Leggett , J. Offiah , S. Emeakpor , Investigating the Ecological Effects of Agricultural Assistance Schemes in California’s Central Valley Area, Food and Public Health, Vol. 14 No. 1, 2024, pp. 1-24. doi: 10.5923/j.fph.20241401.01.
1. Introduction
Amidst the ongoing changes in wide range of indicators, the rightful disbursement of farm aid continues to improve the welfare of planters involved in agricultural activities along various places within the South-Central region of California. Aside from its role as a vital device meant to safeguard the delivery of government assisted farming programming directed at the needy [1,2]. In the last decades in the country, the disbursement of federal agricultural assisted programs has risen enormously following the stipulated commitments aimed at accelerating the productive capacity of farms considered eligible for the monetary aid [1,2]. Farm assistance intended as payouts and support, provided by the authorities in US to deprived farmers and the agricultural sector keeps getting extensive interest and recognition [3,4]. In as much as, numerous people and cross section of society regard that kind of aid vital to the stability of the nation’s marketplace and agricultural trade, others look at subsidies like as instrument of fiscal turnaround [5,6]. Subsidies are also essential in curtailing the risks, planters face in time of extreme disturbances triggered through climatic change induced stressors such as aridity, cyclones and storms and economic worries and inactivity [7,8]. Altogether, the involvement of Federal authority is central in ensuring agricultural productivity during fiscal shocks [9,10]. Considering the significance of farm output in advancing the nation’s welfare and food security in contrast to other sectors of the economy. The US has all along, demonstrated the benefits of agricultural subsidy in generating economic shield for farmers during difficult times in many areas including water use. The assumption comes from the scope and rudiments of farm subsidy in saving the country from pointless reliance on foreign importations. This is occurring aside from the specified capacity of the larger agricultural structure beginning from the countryside and the other players from insurance to banks associated with subsidy [11-15].Because officials began passing new legislations, various organizations of different philosophical lines are ideologically questioning the rationale behind overall cash allotted for agricultural subsidy and the targeted recipients with genuine objectives. Of the over two hundred billion dollars allocated to farm aid expenses from 1995 through to 2010, almost ¾ of that finished in the hands of simply the first 10% of the agricultural sector recipients throughout the nation in the face of rising needs in help for local planters. In the last several years, the payment of federal farm assisted schemes continues to grow with the aim of raising the productivity level of farms at the margin [16]. The continuity of the monetary assistance is usually set aside to good usage in supporting agricultural operations and undertakings. This consists of the cultivation of cotton, wheat, disaster payments, conservation reserve payments, corn, rice, environmental quality incentives program and others centred on land area and requirements of agricultural activities [16]. Seeing the special support reserved exclusively for the leading five crops most notably wheat, cotton, soyabeans, corns and rice [17]. The big 5 has been recognized for their linkage to health scares like diabetes and cardiac issues. The omission of fruit, vegetable, livestock, and chicken farmhouses from the 66.67% in distribution and exchange operations in government aid, stirs doubts on the efficacy of those policy actions throughout the nation. This stems from capacity of such policy anomalies to induce ecological, health and fiscal liabilities [18-29].With the bulk of these financial packages usually earmarked to supporting the operations of agri-business tied to the planting of crops from cotton to rice, ecological protection incentive program and others based on a disbursement criterion that places greater premium on size and desires of those special interests involved in core agricultural commodities [18-29]. Yet, the adjoining ecosystems in California’s South Central agricultural ecozone dominated by big farms, saw exposures from the widespread treatment of fields and farm with agro chemicals laced with various volumes of insecticides and nutrients to optimize production and growing depletion of ground water and aquifers. Among all these, has emerged the widespread applications of farm nutrients on different sizes of farmland alongside pesticides, insecticides, and agrochemicals as catalysts to drive up productivity amid the growing risks posed to wetlands and the adjoining environments in South Central California [30-32]. Predictably, from the extensive applications of nutrients in the form of nitrogen and phosphorus and the proliferation of other stressors (like pesticides, herbicides, insecticides, and fungicides) authorized in agricultural aid. Agricultural contaminants can degrade both surface and ground water quality. Because fertilizers and pesticides have capacity to drift around upon applications on farmlands; their sudden spread in the time of storms, shifts the contaminants to adjacent waterways, streams, estuaries, rivers, and subterrain water [33]. Though, the use and alteration of croplands to boost agricultural activities amounts to improved harvest and productivity. Regularly, these shifts in the immediate vicinity creates sudden environmental impacts on the watersheds and natural sanctuaries particularly with risks to quality and volume of water resources. Seeing that agricultural activity covered by subsidy is linked to the pollution of important waterways and estuaries across the nation. The recurrent pace of drought is escalating the intense mining and depletion of subterrain water along the central valley and the Sacramento aquifer in the study area among farmers at a much intense pace [34-38]. Despite the recurring environmental consequences of farm aid distribution in the agricultural sector, quite a little is known on the risks in South Central region of California based on mix-scale approach [39-43], utilizing up-to-date geospatial tools as analytical devices [44-48]. Accordingly, this enquiry will fill that void by evaluating the ecological effects of farm assistance in the study area with emphasis on issues, trends, impacts, and factors influencing the continual disbursement of federal funds to farms through assisted schemes. From the enquiry’s four objectives, the first aim is to assess the latest trends in farming subsidy allotment. The second objective evaluates the effects government disbursements to farmers have on the environment in the California’s South-Central region whereas the third objective scrutinizes the factors driving ecological dangers of hefty farm aid distribution in the Golden state’s central valley ecozone. The fourth and later objective centers on the documentation of mitigation actions and the design of a decision support device to guide resource managers. Against that background, the study covers 5 sections consisting of introduction, methods, results, discussions, and conclusion.
2. Methods and Materials
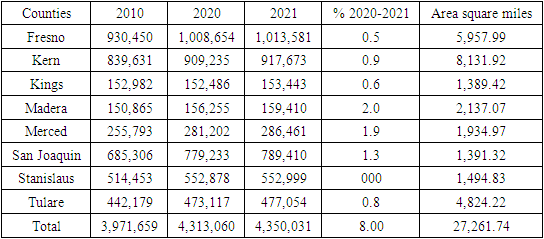
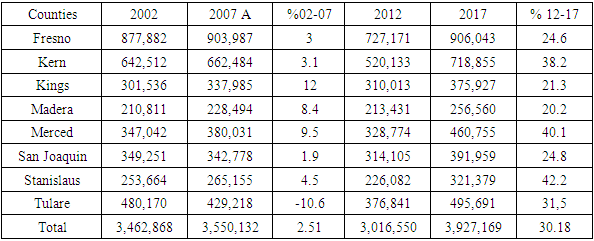
The study area in Figure 1 covers 8 counties extending through 27,261.74 mi2 area in the South-central valley region and equivalent to 15% of the state’s land mass. From 2010-2021, the population rose by 3,971,659 to 4,350,031 (Table 1), at a rate of +9.52% [49]. Ranked as the most subsidized at $3.7 billion and a heavily farmed hub in the US worth $17 billion. Additionally, the central valley loam brown soil [50] produces many crops including cotton, wheat, corn, rice, and dairy. With its rich biodiversity, wildlife habitats, wetlands, the ecosystem remains prone to soil salinization, droughts and nutrients flow from subsidized farms and ground H2O depletion [50,51]. From its physical make up, the Central Valley in its entirety stands as a large, extended, surface valley overlooking the center of California. The valley is surrounded by coastal limits running through towards the west and to the east, the Sierra Nevada. Touted as the Golden state’s most valuable farming hub and among the most thriving in the globe, supplying over 50% of the fruits, vegetables, and nuts cultivated in the United States. The study area’s reputation as a locality endowed with the growing of more than 230 crops, occurs on less than 1% of the total farmland in the United States. Accordingly, the Central Valley, produces 8 percent of the nation's agricultural output estimated at US$43.5 billion in 2013 [50,51].Table 1. Study Area Population and Land Area in Miles
 |
| |
|
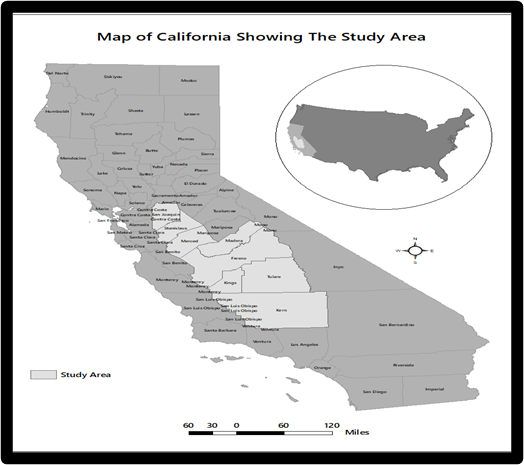 | Figure 1. The Study Area South Central California |
Given that over 7,000,000 acres (28,000 Km2) within the valley are under irrigation, operating through a network of reservoirs and canals. [4]. Aside from the presence of adjoining big cities from Sacramento to Fresno. The Central Valley watershed comprises 60,000 square miles (160,000 Km2), or over a third of California. It consists of three main drainage systems: the Sacramento Valley in the north, which receives over 20 inches (510 mm) of rain annually; the drier San Joaquin Valley in the south; and the Tulare Basin and its semi-arid desert climate at the southernmost end. The Sacramento and San Joaquin River systems drain their respective valleys and meet to form the Sacramento–San Joaquin River Delta, a large expanse of interconnected canals, stream beds, sloughs, marshes, and peat islands. The delta empties into the San Francisco Bay, and ultimately into the Pacific.[5]. Additionally, the waters of the Tulare Basin essentially never reach the ocean (except for Kings River waters diverted northward for irrigation), though they are connected by man-made canals to the San Joaquim. Because the flatness of the valley floor contrasts with the rugged hills or gentle mountains that are typical of most of California's terrain. On the ecological side, The Central Valley was formerly a diverse expanse of grassland, containing areas of prairie, desert grassland. Worthy of note in all these, is that while the valley's farm productivity relies heavily on irrigation from surface water and badly depleted underground aquifers [47]. Indeed, about 16.66% of the US' irrigated land is concentrated in the Central Valley [52-56].
2.1. Methods Used
The paper uses a mix scale temporal-spatial data approach involving descriptive statistics, agricultural census information and primary data connected to geographic Information Systems (GIS) to display the trends spatially. The spatial information for the enquiry was obtained from the United States Department of Agriculture (USDA), the United States Environmental Protection Agency (EPA), The United States Geological Survey (USGS), together with as well state agencies like The Californian Department of Environmental Quality (TDEQ). Other sources include non-governmental organizations such as the Environmental Working Group (EWG), farming groups and the US Census Bureau. Generally, the agricultural census data, subsidy information, the subsidy money and county rankings originated from the USDA’ National Agricultural Statistics Service (NASS) for the periods of 1997-2017, while the California’s Department of Environmental Quality (CDEQ) office of pollution control provided state and county wide information on watershed impairment and pollution on the South-Central Region Valley region for 2003-2010. Other sources worthy of mention includes California Department of Water Resources, the National Academy of Sciences, the Central California Irrigation District, and the Bureau of Reclamation Water.In the process, federal geographic identifier codes of the state were used to geo-code available information and the socio-economic and environmental variables contained in the data sets. This information was analyzed with basic descriptive statistics, and GIS with particular attention paid to the temporal-spatial trends at the state and regional level. As mentioned earlier, this was made possible by the retrieval of spatial data sets of shape and grid files from the Cal Resource Information System, California Environmental Data Exchange Network, California Natural Resources Agency Open data, and California Geospatial data Information System in digital form using ARCVIEW GIS. Part of the spatial data also came from land-use capability and classification maps for the study area. The statistical output of the variables from the spatial units were mapped and compared across time in ARCVIEW GIS 11.0 and SPSS 29.0. The relevant procedures consist of two stages.
2.2. Stage 1: Identification of Variables, Data Gathering and Study Design
The initial step in this research involved the identification of variables required to analyse changes at the county level from 1995 to 2020. The variables consist of socio-economic and environmental information, including size of agricultural land in acres, the number of farms, the size of farm land treated with insecticides, the combined regional value of agricultural land, the size of farm land treated with fertilizer and chemicals, population size, population percentage of change, the total amounts of subsidy payments to farms, the size of cropland, the size of irrigated farm land, number of farms with fertilizer and insecticides, subsidy types, the number of subsidy recipients, study area size, the percent of subsidy type, the percent of subsidy amount, the dollar value of allotted subsidy, the rankings of county and the percentage of change. These variables as mentioned earlier were derived from primary sources made up of government documents, newsletters, and other documents from NGOs. This process was followed by the design of data matrices for socioeconomic and land use (environmental) variables covering the census periods from 1997, 2007 to 2012 to 2017, 2019 and 2020. The design of spatial data for the GIS analysis required the delineation of county boundary lines within the study area as well. Given that the official boundary lines between the 8 counties remained the same, a common geographic identifier code was assigned to each of the area units for analytical coherency.
2.3. Stage 2: Step 2: Data Analysis and GIS Mapping
In the second stage, descriptive statistics and spatial analysis were applied to transform the original socio-economic and land-use data into relative measures (percentages, ratios, and rates). This process generated the parameters for establishing, the extent of environmental change induced by farm subsidy and the trends across the region for each of the 8 counties through measurement and comparisons overtime. While the spatial units of analysis consist of counties, watersheds, region and the boundary and locations where subsidy blossomed. This approach allows for the detection of change as the graphics highlight the agricultural landscape impacts, land-loss, and subsidy trends. The remaining steps involve spatial analysis and output (maps-tables-text) covering the study period, using ARCVIEW11. With spatial units of analysis covered in 8 counties (Figure 1), the study area map indicates boundary limits of the units and their geographic locations. The outputs for each county were not only mapped and compared across time, but the geographic data for the units which covered boundaries, also includes ecological data of land cover files and paper and digital maps from 1997-2017. This process helped show the spatial evolution of subsidy trends, the ensuing environmental impacts, dispersion of stressors, ecological degradation as well as changes in other variables and factors driving subsidy proliferation and impacts in the study area.
3. The Results
This section of the paper describes the results of the data and environmental analysis of farm subsidy in the study area. Part of the research focus centres on temporal and spatial analysis of subsidy trends in the study area. Using descriptive statistics there is an initial emphasis on the extent and nature of farm assistance and the trends amongst the 8 counties at regional and state levels. This is followed by a temporal analysis of farmland use, percentage of change, environmental impact assessment mainly on the present state and subsidy indices and comparative assessment. Added to that are spatial analysis of GIS and the factors driving the surge in subsidy use along the South-Central California region and the efforts.
3.1. The Analysis of Subsidy Trends in the Region
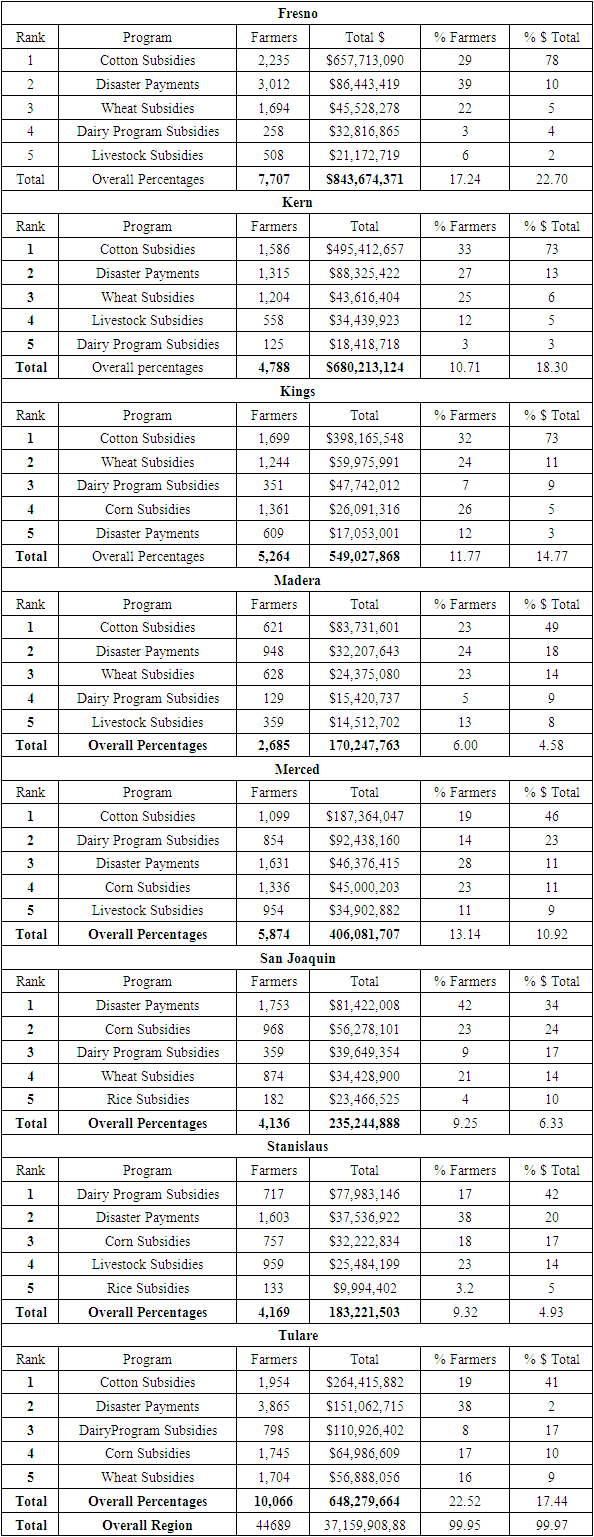
Being a major farm hub, the temporal spatial distribution of the summary in individual programs and the actual receipts all through the periods 1995-2020 along the Fresno valley, points to an interesting scenario reflective of the state of subsidy. Current info shows that in as much as among the top 4 counties, Fresno County ranks high as the leading area in most of the categories of subsidized programs and the dollar equivalents, the counties of Kern, Kings and Tulare followed up in the same order. In the area where cotton topped the listings as the core commodity ahead of the others under subsidy at 6 of 8 counties representing 75% of the zone apart from San Joaquin and Stanislaus. Both wheat and corn not only held firm in 5 counties, but the other programs like dairy, and livestock stood out in all counties coupled with the recurrence of disaster payments as well. This consists of vast number of farms estimated at 7,707-4,788, together with 5,264-10,066 other farms respectively, of which Tulare topped the list by over record number of 10,000 farm operations between 1995-2020. In the second group of counties, Merced showed its dominance with over 5,874 farms while San Joaquin and Stanislaus held slightly identical values in farm operations of 4,000, 4,136 to 4,169 as Madera County rounded at the bottom at merely 2685 below its neighbors. Aside from the overall farm numbers of 44,689 and subsidy dollar amounts of $3,715,990,888 in the hands of the operators in the zone, the leading group of farms in 4 areas made up of Fresno, Kern, Kings, and Tulare accounted for the greater chunk of the earmarks equivalent to over half a billion dollars. Of these counties, the farmers in Fresno, Kern and Tulare took in about $843,674,371 million dollars to $680,213,124 -$648,279,664 each, whereas King County posted $549,027,868 in the process. Elsewhere in the other category 2 group of areas, both Merced and San Joaquin County at $ 406,081707to $235,244888 in total farm aids all in the 15 years span, outpaced Madera, and Stanislaus where the dollar values stood at under the 1 $ billion plus mark of $170,247,763-$183,221,503. On the percentage distribution of the indicators consisting of farmers and subsidy amount, both Fresno and Tulare at identical double-digit levels of 17.24% -22.70% to 22.52%-17.44% exceeded the others, while a trio of places most notably Kern, King and Merced held their own in the proportions of farmers and aid money by10.71%-18.30% and 11.77% to 14.77% during the same periods as well. With time, the ratio equivalences in the remaining group of three counties in the study area like San Joaquin, Stanislaus, and Madera gradually faded into single digits values of 9.25%-6.33%, 9.32%-4.93% - 6.00%-4.58%. Note that with its huge presence as the major crop in the Central Valley, cotton averaged over 74.66% of all money earmarked for aid in Fresno, Kern and Kings, but in Merced, Madera and Tulare, the combined percentages for allotment to the top commodity drooped to 45.33% (Table 2). Table 2. Subsidy Summary For Recipients In California’s North Central Counties 1995-2020
 |
| |
|
3.1.1. Land Use Change Analysis
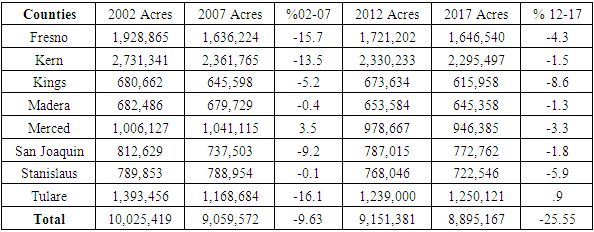
The distribution of farmland among the central valley counties all through 2002 to 2017 shows that despite its regional peak of 10,025,419 acres in 2002, by the ensuing 5 years during the census of 2007, the farmland areas under operations fell to 9,059,572 acres. The same patterns of drops from 9,151,381 to 8,895,167 in farm acreage stocks persists as of 2012 through 2017 for the entire study area. Out of a combined land size and average of 37,133,739 acres to 9,282,885 acres for each of the census year totals. Among the counties of the zone, three of them made up of Fresno, Kern and Tulare exhibited more consistency in farm land areas valued above the 1 million plus acre level over the years into operation as the 5 other counties of Kings, Madera, San Joaquin, and Stanislaus lagged behind with the exception of Merced where the initial land areas in 2002-2007 went from 1,006,127 and 1,041,115 until a late rally of 978,667946,385 acres by 2012-2017 at an average of 1,023,621-962,526 respectively. In the trio of the heavily farmed counties as mentioned earlier, Kern County on its part, outpaced its neighbors in the group being the only area where land areas exceeded more than 2 million acres under the same average. From the opening farmland size of 2,731,341-2,361,765 acres in the area, in 2002-2007, see that the size and form of Kern’s land stock of 2,330,233 and 2,295,497 acres remains firm in the face of apparent slides. Out of an all-time land area of 1,928,865 acres in 2002, Fresno’s land holdings in the successive years of 2007 tumbled notably by 1,636,224 acres, as if it was not enough, the county’s land areas in 2012 and 2017 reached 1,721,202 and 1,646,540 acres. In the same order, the county of Tulare had 1,393,456 to 1,168,684 acres of land under farm activities and an additional 1,239,000 -1,250,121 acres in place. In comparing their averages, both Kern and Tulare maintained slightly identical values of 1,733.208-1,262,815 acres. In the remaining lower cadre farm counties in which Stanislaus and San Joaquin accounted for (over 700,000 acres) or 777,477 – 767,350 acres in averages, both King and Madera counties held between 653,963-665,289 acres in mean values (Table 2.1).
3.1.2. Percentages of Change and Shifts in Farmland
Regarding the actual percentages of change over time, with the exceptions of 3.5% -.9% gains in the available size of farm in just two different counties of Merced 2002 -2007 and Tulare during periods 2012 through 2017. Undoubtedly, 7 of 8 or 87% of the study area saw back-to-back declines in farmland use. Of these in the first 5 years, the group of 3 counties made up of Fresno, Kern and Tulare accounted for the highest losses in 3-digit levels of -15.7%, -13.5% and -16.1%. These were followed by places like San Joaquin and Kings in the single digit loss columns of -9.2%-5.2%, whereas Madera and Stanislaus saw declines of less than one percentage points -0.4 to -0.1 respectively. By the 2012-2017 periods, percentage changes of mostly single digits, were deeply obvious across the study area with much of the high and medium single digit losses of -8.6, % -5.9%, to -4.3%, concentrated in Kings, Stanislaus, and Fresno while Merced loss levels of -3.3%, exceeded those of Kern, Madera, and San Joaquin counties. These were the areas where rates of declines stayed stable at -1.5%, -1.3%, -1.8% by an average of 1.5% (Table 2.1). Table 2.1. The Size of Farmland and Percentage Change, California’s Central Valley 02-07
 |
| |
|
3.1.3. Percentages of Change and Number of Farms
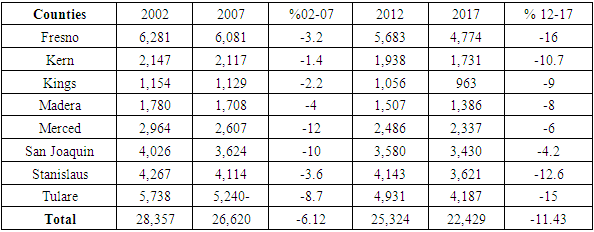
In the case of the number of farm operations, at an average of 25,683 for the region, the individual values of farms which ranged from 28,357, 26,620 to 25,324-22,429, reflects a mix of recurrency prevalent at the county level between 2002-2007. Throughout the areas, among the 4 dominant towns, Fresno and Tulare topped the listing with 6,281-6,081 farms to 5,738-5,240 farms whereas San Joaquin at 4,026-3,624 and Stanislaus 4,267-4,114 showed large presence of farms as well in the same period. This trend contrasts sharply in a setting where the averages of 2000 plus farms (2,232-2,786) for Kern and Merced and Kings and Madera’s mean numbers of 1142-1744 were significant enough to thrive in the sector during 2002 to 2007. By the end of 2012-2017, other repeat patterns surfaced again with notable shifts in farm numbers for the frontline counties of Fresno, San Joaquin, Stanislaus, and Tulare. This involved around 5,683-4,774, to 4,931-4,187 farms and another 4,143-3,621 to 3,580-3,430 units amongst operating farmhouses. Against that background, by the 2012-2017 fiscal year, the same quartet of counties Kern, Kings, Madera, and Merced, emerged with averages of 1835-1010 to 1447-2412 farms (Table 2.2). The shockingly bleak picture of outright declines as painted by the percentages of change in the zone, points to back-to-back slides in 2002-2007 through 2012-2017. In the counties, Merced and, San Joaquin experienced double digit reductions of -12%, -10% far ahead of the closest counties of Tulare and Madera which finished with losses of -4% to -8.7%. Apart from the Fresno and Stanislaus’s combined average share of percentage of change values in farms of -3.4% in 2002-2007, Kern and Kings accounted for -1.4 to -2.2% in the loss of farms before, -4 percentage points in declines. In the following periods of 2012-2017, a quartet or half of the of areas comprising of Fresno, Kern, Stanislaus, and Tulare all came under high double digit losses -16% - to -10.7% to-12.6%- 15% in the number of farms as another group of 4 counties (Kings, Madera, Merced, San Joaquin) that were not spared of such a fate, recorded mostly single digits losses at -9%, -8%, -6% to -4.2% as Kern and Merced, posted -5.6% to -9.4%. Although Kern and Tulare averaged 6 percentage points individually, Merced and San Joaquin experienced increments of 4.5-1.2% as well (Table 2.2).Table 2.2. Number of Farms and Percentages of Change California’s Central Valley 02-07
 |
| |
|
3.1.4. Percentages of Change and Irrigated Lands
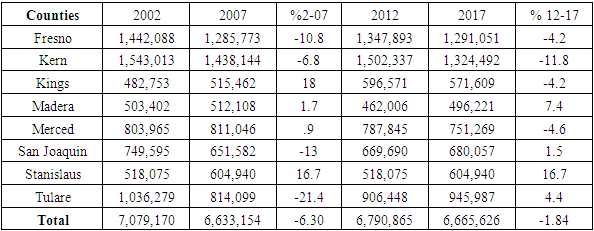
Considering the significance of water, the issue of aridity and the pressures of climate change. It comes as no surprise that the entire area’s irrigated land dropped from 7,079,170 acres to 6,633,154 acres to 6,790,865 to 6,665,626 acres between 2002-2017. In the three counties deemed heavily irrigated, Fresno and Kern all had over million acres in watered areas (1,442,088- 1,285,773- 1,543,013- 1,438,144) in 2002-2007 acres) at an average of 1,363,393 to 1,490,579 acres while the third placed Tulare began with 1,036,279 acres only for the opening values, until it falls to 814,099 acres by 2002-2007. In the second class of irrigated counties, Merced, and San Joaquin water sprinkling efforts to boost farming extended to vast areas measured at hundreds of thousands of acres estimated at 803,965-811,046 to 749,595-651,582 acres, this represents mean values of 807,506 and 700,589 acres (Table 2.3). On the other hand, Madera, and Stanislaus whose irrigated lands in the third grouping, covered average sizes of more than half a million acres of land with total water sprinkled areas of 503,402-512,108 acres to 518,075-604,940 acres. The county of Kings on its part, finished at initial irrigated land areas of 482,753 acres to 515,462, while the average irrigated land sizes also amounted to 499.168 acres. Turning to the 2012-2017 census, Fresno, Kern and Tulare again showed their primacy in irrigated land areas of a million plus to the 900,000 plus acres categories at comparable average index of (1,319,472-1413,418, 926,218). These trio of counties allotted 1,347,893 1,291,051 acres, to 1,502,337-1,324,492 acres and another 906,448-945,987 acres to farms. Further along these lines, in the second-tier counties, farms in Merced, San Joaquin and Stanislaus also distributed water on 787,845 and 751,269 acres to 669,690-680,057 acres to 518,075-604,940 acres during the same period. Madera county in the third and last group sprinkled water on the 462,006-496,221 acres at levels below the other neighbors in 2012 -2017. Considering the actual percentage of change, note that the counties experienced even split of 4 gains and declines in both the periods of 2002-2007 to 2012-2017. In the process, by 2002-2007, the drops in the first quartet of counties at rates of -21.4%, -13%, to -10.8%, -6.8%, involved Tulare, San Joaquin, Fresno, and Kern with the largest declines in the Tulare area. On the gain(s) column, another group of 4 counties made up of Kings, Madera, Merced, and Stanislaus all experienced increases of 18%, to 1.7% and .9 to 16.7% as Kings and Madera saw the highest level of increments in irrigated areas. In as much as, the level of deficits in irrigated land at Fresno, Kern, and Merced stood at over -4%, whereas county of Kern’s irrigated land area declines reached double digit levels of -11.8%. In the adjoining counties, the quartet of areas consisting of San Joaquin, Stanislaus, Tulare, and Madera obtained increases of 1.5%, -16.7% to 4.4% -7.4% (Table 2.3).Table 2.3. Irrigated land acres and Percentages of Change California’s Central Valley 02-07
 |
| |
|
3.2. Impact Assessment
From the surge in agricultural subsidy disbursement to spur production among the core crops of farming operations actively involved in the 8 counties of the study area. There are a mix of notable impacts as manifested with some upsides and downsides at various levels. This is evident from the pressures pertaining to the handful of stressors precipitating disturbances and fragmentation on the ecozone despite the known economic gains and dollar distribution among recipients in South Central California. These impacts consist of pollution, water impairment, depletion, and economic aspects.
3.2.1. Pollutions Risks from Agrochemicals Sprays
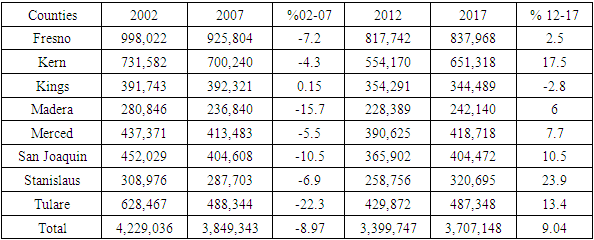
The essence of agrochemicals and their benefits for the purposes of subsidy in the study area cannot be underestimated. Knowing fully well the pace of ecological risks tied to the application of fertilizers on farms. The declining levels in the 2002-2007 seasons as welcoming as they may look in terms of the requirements of best management practices on farm use of chemicals, does not show the full picture. But the sudden surge in 2012-2017 census periods at the regional level can still be very damaging enough to the surrounding ecology. To the effect, by 2002-2007 the region’s vast acreages of land mostly in the upper millions of 4,229,036 acres to 3,849,343 hectares and 3,399,747-3,707,148 acres were sprayed with chemicals and fertilizers. From the highlight on the table, activities in the first three top places, shows Fresno, Kern, and Tulare led all other counties as the biggest users of farm chemicals and fertilizers by 2002-2007 at mean values of 961,913 acres, 715,911 acres to 558,408 acres. In the 2nd group of major users, Merced, San Joaquin, and Kings counties applied farm chemicals on about 425,000-392032 acres while Madera and Stanislaus continued with further spread on average levels of 258,843-298,340 acres from 2002-2007. In the 2012-2017 fiscal year, among the leading counties, Fresno’s fertilized initial land area of 817,742, jumped to 837,968 acres as Kern and Tulare saw their respective farm areas covered with 554,170 acres-651,318 acres, to 429,872-487,348 acres on fertilizers. In the case of the additional trio of counties in the 2nd group made up of Kings, Merced and San Joaquin, the average size of areas under the treatment of chemicals within the respective counties ranged from 349,390 acres, 404,672 to 385,187 acres (Table 3). Table 3. Size of Farms Treated with Fertilizers and Chemicals California’s Central Valley 02-07
 |
| |
|
With in the last group, Madera and Stanislaus finished below the others with over 200,000 acres (235,265, -289,726) under chemicals. In the context of the actual percentage changes from 2002 through 2007, the region went from gains to declines while of the 8 counties in place in which fertilized land areas declined in 7 of them, only Kings posted insignificant gain of 0.15%. In the entire counties, the highest double-digit declines of -22.3 to -15.7and, -10.5% persisted in Tulare, Madera, and San Joaquin. Among the remaining quartet of places, (Fresno, Kern, Merced, Stanislaus), the rate of changes in single digits remained consistent at -7.2%, -4.3%, and -5.5to 6.9 throughout 2002-2007 (Table 3). In the following census periods of 2012-2017, the reversal of the trends surfaced, given the sudden increment in the percentage of land set aside for fertilizers and chemicals at every level except for -2.8% drop at Kings in farmland laced with chemicals. In the process, the avalanche of double-digit increases stretched from Kern, San Joaquin, Stanislaus to Tulare at 17.5%, 10.5, 23.9 to 13.4% whereas Fresno, Madera, and Merced all saw their proportions of change rise by 2.5 to 6 % and 7.7% between 2012 to 2017 (Table 3). The frequency and scale of the applications of these chemical substances not only amount to notable pollution, but it poses risks to the ecosystem in different forms ranging from the tainting of public water supplies. At the same time, flora, and fauna in adjoining marine environments are also endangered in the process. In the region, the endangerment of major rivers persists via pollution hazards due to rife spray of chemicals to boost capacity. As such, fertilizer and insecticide flow, high nutrient loadings and sludges from farm activities many of which are subsidy laden, held firm (Table 3.1). Table 3.1. Farms Treated with Insecticides California’s Central Valley 02-07
 |
| |
|
3.2.2. The Impairment of Major Rivers (Ecological)
Despite the rising handout of farm aids to the counties and the shifts in the greater farmstead structure. There exist visible ecological perils from the current subsidy dependent farm practices in the Central valley zone. As such, irrigated cropland has capacity to severely impact the quality of any kind of agricultural watershed. To begin with, as the sprinkling of water accelerated farmland erosion levels, this in turn implies a sudden spark in extensive sediment flow rates into surrounding lakes. The higher drainage movements linked to irrigation in those circumstances as well amounted to quicker toxin flow. From the magnitude of their liabilities, these elements seem interwoven since the loads of contaminants they carry like pesticides heavy metals and nutrients combine and accumulate as residues (Table 3.2). Furthermore, it has been demonstrated that irrigated crop output applies far more chemical pesticides, herbicides, and fertilizers much more than non-irrigated commodity farming. For that, in the region where insecticides applications and the number of farms under treatment increased between 2002-2017 (Table 3.1-Table 3.3). Table 3.2. The Classification of Agriculture Impairment Along Rivers in the Central Valley
 |
| |
|
Table 3.3. Acres Treated to Control Insects or Insecticides California’s Central Valley 02-07
 |
| |
|
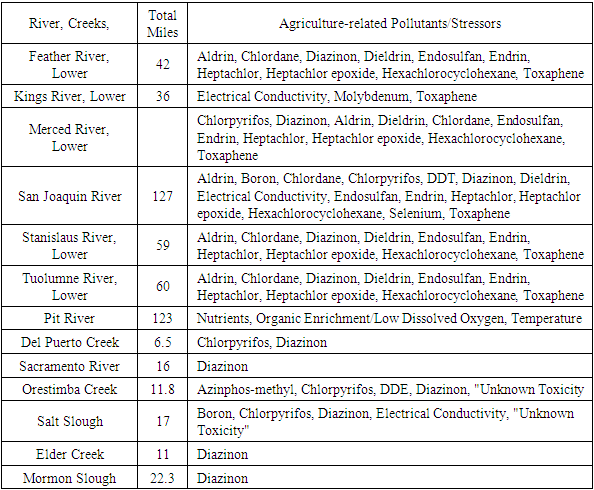
In such circumstances, the presence of extra chemical compounds in the water flow, implies more concerns. While this triggers impairment of water systems, it must be reported to the EPA listings of impairment stressors in places deemed unsuitable for consumption. To that effect, the state's most current impaired water listings cover over 700 miles of waterways, streams, and marshes in the Central Valley, coupled with nearly 55,000 acres of wetlands and creeks where reduced water quality is tied to farming [25]. The issues disclosed encompasses many stressors ranging from surplus sediment and shifting river temperatures to pollution with contaminants like selenium and seventeen brands of pesticides. The impacted streams encompass famous rivers like the Tuolumne, Merced, San Joaquin, Stanislaus, Sacramento, and Feather. Of all these rivers, the most extremely polluted remains the San Joaquin, which was tainted with 12 different pesticides and selenium together with boron. Many others in the mix are the lower Merced River, which is contaminated with 11 separate pesticides, while the lower Tuolumne is poisoned by 10 other toxins as well (Table 3.2).
3.2.3. Subsidy Induced Water Depletion
Seeing that Central Valley accounts for ¼ of the food usage nationwide, valued at nearly $20 billion annually representing 8% of the US farm production. However, unprecedented levels of irrigated farming and a substantial rise in major produces from grape fields to groves, make the study area, site of intense subterranean water transfers. In that way, the Central Valley represents the number two most-pumped groundwater aquifer system in the US. Looking at the agricultural water price index for the Central Valley and the Southern part of the state. Water estimates can change notably and surge in the periods of large water shortage. As such, presently, water district rates are still under $200 per acre-foot in many regions, though in certain places it surpassed the $500 level. In the process, both the southern end of the Central Valley axis attracts the maximum prices, estimated between $200 – $500, as water prices in the northern portion of the Golden state stay under $50 per acre-foot and $1.00 per acre-foot in other districts. In as much as, water district rates do not represent the sole fees to take into consideration, the fact that several regions in the state of California also finance water transfers on the free market. During the most recent drought that persisted all through 2012-2016, statewide water transactions stood at $800 million per year vs. $300 million during an average season. Consistent with Water Market Insider sources, farm operators elsewhere bought at a much higher cost of $2,200 per acre-foot to irrigate farm high-end crops. The other dimensions to water transfer costs prevalent in the zone comes from the Nasdaq Veles California Water Index, during which the resource soared by 30% in the opening phase of 2021, from $530 per acre-foot to $686 per acre-foot. Accordingly, the yearly pace of ground water depletion ranged from 8.58km3 to 9.22km3 from 2019 -2021 due to overuse. All these notwithstanding, the rate of groundwater depletion because of subsidy induced agricultural activities in the Central Valley, has been accelerating since 2003 (at1.86 km3/yr, and in 1961–2021; 2.41 km3/yr, 2003–2021; 8.58 km3/yr, 2019–2021), deemed a period of megadrought in Southwestern North America.
3.2.4. Economic Impacts
On the percentage distribution of the indicator’s dubbed farmers and subsidy amount, both Fresno and Tulare at identical double-digit levels of 17.24%-22.70% to 22.52%-17.44% exceeded the others while a trio of places most notably Kern, King and Merced held their own in the proportions of farmers and aid money by10.71%-18.30% and 11.77% to 14.77% during the same periods as well. With time, the ratio equivalences in the remaining group of three counties in the study area San Joaquin, Stanislaus, and Madera gradually faded into single digits values of 9.25%-6.33%, 9.32%-4.93%-6.00%-4.58%. Note that with its huge presence as the major crop in the Central Valley, cotton averaged over 74.66% of all money earmarked for aid in Fresno, Kern and Kings, but in Merced, Madera, and Tulare, the combined percentages for allotment to the top commodity drooped to 45.33%. With thousands of wells, and $21 billion spent in the central valley H2O project, the water removal level for subsidized farms at $400 million-year, Westlands H2O district at Fresno and Kings on 600,000-acre area, gulps $100 million in H2O from the Central valley aquifers.
3.3. GIS Mappings and Spatial Analysis
The GIS analysis consists of the visual display of spatial patterns underscoring the state of farm subsidy under various commodities of immense significance across multiplicity of counties in the region. This covers the various parameters made up of farm costs subsidy distribution and a mix of land use indices from the dispersion of percentage of change in number of farms, cropland, irrigated land as well as the spots in space where applications of agrochemicals, pesticides and insecticides were visibly present over time. While the said indices consist also of ground water depletion patterns across quite a few counties in the study area and the hydrological potentials and drought intensity levels in place. From the portrayals of the indices in space, the core land use indicators like the land in farms, farms, croplands, and the evolution of farm stressors from the percentage of insecticides and herbicides and agrochemical applied in the South-Central region did take center stage. The info conveyed via geo-analytics on several scales and the shades denotes the possible risks in the sector. The ability to pinpoint spatial-temporal dimensions of the capacity across the counties using GIS as the analytical tool, is quite essential in pinpointing the state of subsidy disbursement and the ecological impacts in California’s South-Central region amidst the continual expansion of the scheme. Looking at the spatial dimensions pertaining to the extent to which the costs of subsidy in California’s South-central zone evolved over the periods 1995-2021. See that the duo of major counties as represented by Tulare and Fresno accounted for the highest levels of 22.52 -17.24%, as Merced followed up with 13.4% in the next order of the listings. Elsewhere, neighboring Kern and Kings in the Southwest held on to slightly identical rates of 11.77% -10.71% in the actual distribution of agricultural farm aid. In the lower end of the classification, the counties of Stanislaus and San Joaquin posted similar ratios of over 9. % (9.35%-9.2%) ahead of Madera County in the Northeast which rounded out on the bottom at just 6% in the total farms that benefited from the disbursement of government subsidy (Figure 2). 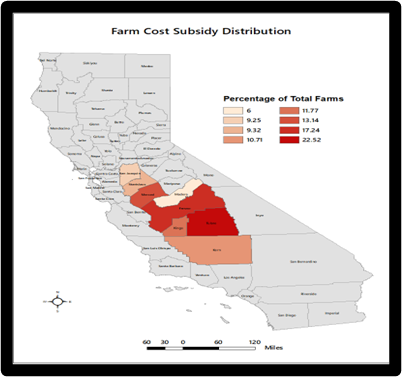 | Figure 2. Subsidy Distribution Percentages Total Farms 1995-2020 |
The percentage of dollar amount of subsidy costs of different programs that accrued the counties shows a trio of places most notably Fresno, Kern and Tulare distinguished in dark blue and purple colors among the top recipients of the assistance. This coincides with the relatively visible concentration of 22.7%-18.3% to 17.44% in farm aid transfers to farmers all through 1995-2000 in the leading three counties of the study area. Even at that, King, and Merced in light blue or purple in space along the northwest corner still emerged as recipients of the allotted share of subsidy funds estimated at double digit rates of 14.77%-10.52%, compared to the single digit fractions of 6.33%-4% plus (4.93% to 4.50%) for San Joaquin, Stanislaus, and Madera in dollar values between 1995-2000 (Figure 2.1).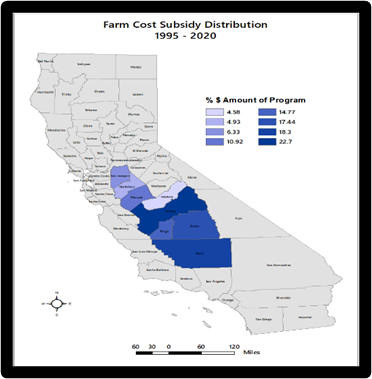 | Figure 2.1. The Dollar Amount of Subsidy Program 1995-2020 |
Of great importance in the spatial analysis is the recurrent nature of emergent patterns involving farm declines in the zone between 2002-2007 to 2012-2017. In the process, the back-to-back declines that occurred, indicates double digit and single digit declines in both sides of the map legends looking at the scales as calibrated therein. The fact that the counties in the study area saw heavy concentration of loses in the number of farms throughout the periods does not come as surprise during the periods 2002-2007 given that the counties of San Joaquin, Merced in the northeast posted losses of -12 to -10% followed by -4% at Madera, whereas Tulare in blue along the lower corner of the map accounted for -8.7%. Further along these lines, the other scales of lower losses of -3.6% to -3.2% started from Stanislaus to Fresno County as losses faded progressively by -2.2-1.4% in the remaining big subsidy counties at Kings and Kern in light orange and pink (Figure 2.2). The evolution of these patterns in the respective counties, reflects the state of farms.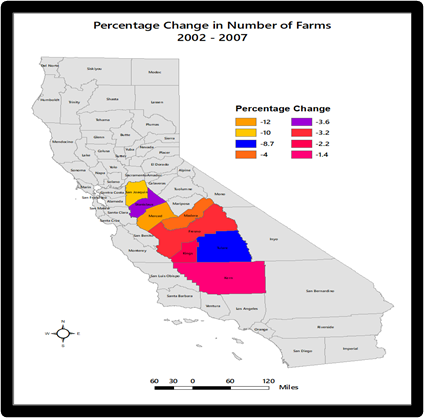 | Figure 2.2. Percentage of Change Number of Farms 2002-2007 |
With the distribution of the percentage of changes in the number of farms in 2012-2017 much deeper in scale than the previous years in the zone, Tulare and Kings experienced highest concentration in losses of 16%-15%, coupled with the drops of -12.6% -10.7% in Stanislaus and Merced. Similar level of declines of -4.2%, to -9% in the number of farms persisted further in places like San Joaquin, kern, Fresno, and Madera (Figure 2.3).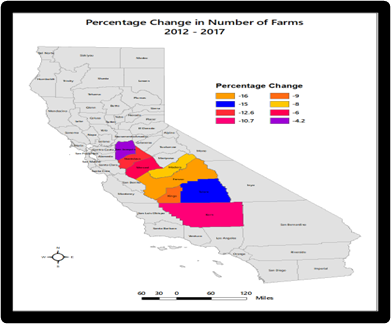 | Figure 2.3. Percentage of Change Number of Farms 2012-2017 |
In the case of percentage of changes in cropland lands during 2002-2007 in which the study area witnessed drops in 7 of 8 counties. From the map, a quartet of areas that suffered heavy losses in space started with -20%-17.1% for Madera, Tulare, and -14% plus rates of declines in cropland in both San Joaquin and nearby Stanislaus County. In the next group of counties, plagued by declines, the trio of Fresno, Merced and Kern saw their cropland fall by -10.6%, - 9.4% to -5.6% until the trends in King County went in another direction by soft gain of 2.6% (Figure 2.4). 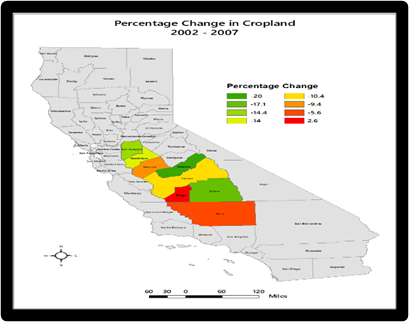 | Figure 2.4. Percentage Change in Cropland 2002-2007 |
Further into the following periods 2012 and 2017, completely different spatial patterns dominated by opening big gains of 18.7% to 13.8%, followed by identical level of increases of over 6% in the lower south counties of Tulare and Kern. This seems at variance in those other places (San Joaquin and Merced) in space where meagre gains remained at 1.2% to 4.5% correspondingly, while percentage pace of loses of -2.6% to -0.9% are highly indicative of the spatial evolution of changes denoted by gains and declines in 2012 through 2017 in the central valley area of California (Figure 2.5).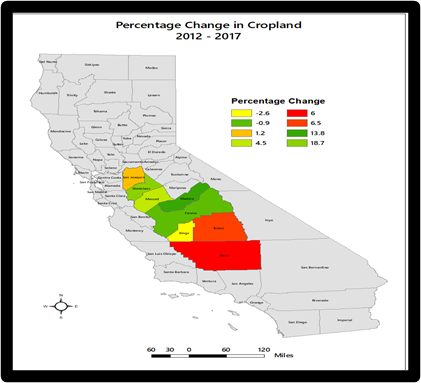 | Figure 2.5. Percentage Change in Cropland 2012-2017 |
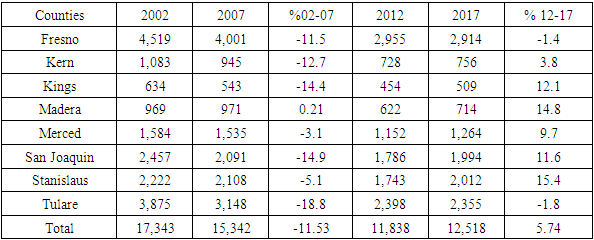
In the period 2002/2007 in which size of farms treated with insecticides in the region declined in most of the counties, Tulare’s level of losses rose by 18% as San Joaquin and King posted similar levels of declines of over -14% on the farmland areas sprayed under insecticides. Just as Fresno and Stanislaus encountered their own double digits drops in insecticides’ treatments of the cultivated areas at 12.7%-11.15%. Within the same periods, areas under insecticides in Merced and Kern, waned further deep by -3.1% to -5.1% despite Madera’s insignificant rise of 0.21% in the spraying of insecticides (Figure 2.6).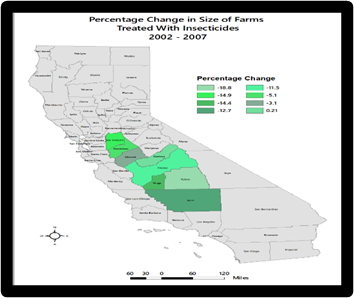 | Figure 2.6. Perntage Change In farmland on Insecticides 2002-2007 |
In the following years 2012-2017, the county on the north corner of the map, Stanislaus followed by Madera began on a high note with increases of 15.4%-14.8%. Since it did not end there, in the mix were the two other counties San Joaquin and Kings that are far from each, but slightly identical in their percentage rates of increases of 11.6% -12.1%. In same order, the remining counties of Merced and Kern both in the Northwest and South emerged with surges of 9.7%-3.8% in size of farm covered by insecticides. Lastly on the tabular listing, two other areas made up of Tulare and Fresno saw their areas treated with insecticides decline by -1.8% to -1.4% all through 2012-2017 census periods from there on, the increment or gains held on in single digits (Figure 2.7). 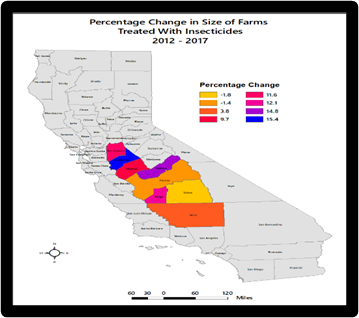 | Figure 2.7. Percentage Change In Farmland on Insecticides 2012-2017 |
Apart from the 0.15% increase in agro chemicals at Kings County in 2002-2007, the same outright losses in the use of fertilizers and chemicals, represents welcome news for the attainment of ecosystem quality. This is so, as the decreases in initial trio of areas including Tulare, Madera and San Joaquin stood at 22.3%,15.7% to 10.15%. Of the next batch of areas, Madera and Stanislaus wasted no time in cutting down nutrient applications individually as indicated with the single digit declines of -7.2% to -6.9%. Along these lines, there were further shifts in the use patterns of agrichemicals in the counties of Fresno and Kern at 4.3% to 5.5% (Figure 2.8). 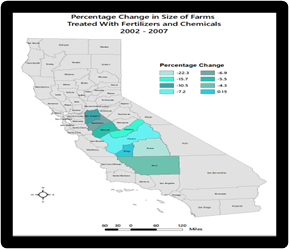 | Figure 2.8. Percentage Change farmland on Fertilizers and Chemicals, 2002-2007 |
The spatial distribution in the evolution of the percentage of change in the size of farms treated with fertilizers and chemicals in the 2012/2017 reveals heavy concentration of large swaths of farms under full applications in the counties of Stanislaus, Kern, Tulare, and San Joaquim at the rates of 23.9%, 17.5% to 13.4% -10.5%. Within the same time frame, the increasing spread of fertilizers and chemicals encountered a sudden slowdown in usage under single digit levels of 7.7%, 6.00% to 2.5% at Merced, Madera, and Fresno counties while Kings County emerged with the only declines of -2.8% (Figure 2.9). 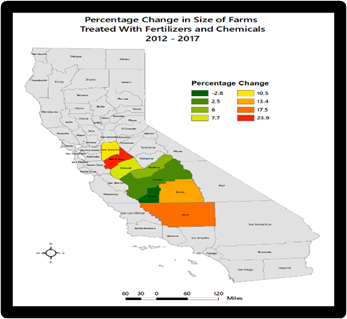 | Figure 2.9. Percentage Change Farmland On Fertilizers and Chemicals 2012-2017 |
Knowing the critical state of water depletion and the pressures from rising demands on the central valley aquifers in the last several years coupled with intense mining of water and the sales as well as the subsidized side of the resource in study area. The extent and forms of irrigation activities on farms remains something on the downside in all the census periods from 2002-2017. Out of the declines that occurred in the south-central area, it really did not surprise us much as to how the spatial transfiguration on the maps, showcases how the trends played out at the farm level. Accordingly, irrigated farm declines across the zone were so visible that the geography of the trends for 2002-2007 to 2012-2017 looked similar in patterns given the across-the-board drops in declines of immense proportions in 2002-2007 at -17.8%, -17.2% to 14.9% in the counties of Tulare, San Jose, and Fresno with minor spillovers of -7.2% at Kern County as well. Even though King County showed a little rebound of only 0.7% during the end of 2002-2007 as the legends in the map pointed out (Figure 2.10). 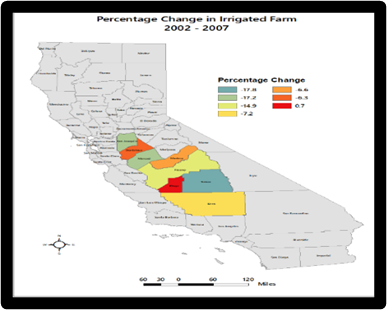 | Figure 2.10. Percentage of Change On Irrigated Farms 2002-2007 |
Following the temporal spatial shift towards the period 2012-2017, note that as the counties of Kern and Fresno located in the lower south of the Valley accounted for the highest proportions in irrigated farm declines estimated at -12.2 -9.6%. In the neighboring areas in the zone, Stanislaus and Madera left no one in doubt over repeated patterns regarding the pilling up of additional skids of -6.3 to -5.7% in the percentage of irrigated farms in the counties. Aside from the miniscule increment in farm irrigation rate in the San Joaquin County at 0.07%, the other drops worthy of note were those in Medera, Kern and Merced measured at -5.5 % to 3.2% and -0.6% all through the 2012 to 2017 census years (Figure 2.11). 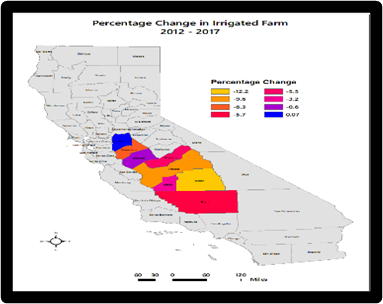 | Figure 2.11. Percentage of Change On Irrigated Farms 2012-2017 |
In accordance with the recurrent spatial trends in the study area pertaining to the percentage distribution of irrigated land areas in 2002-2007. The varying spots in space under multiple colors representing the size of land under water sprinkling, showed little contrasts with Kings and Stanislaus. This is unsurprising given the essence of H2O use in most farms and the growing sectorial requirements.With each of the two counties having experienced close to 18%-16.70% uptick in land under irrigation, the activities in the adjoining areas of Madera and Merced fell short of 2.00% margins as their corresponding increases held firm at 1.7%-0.9%. In the loss column, the counties of Tulare, Fresno and San Joaquin recorded double digit drops of -21.4%-13.00% to -10.8%, at rates far above Kern county’s level of irrigated land declines of 6.8% during 2000-2007 (Figure 2.12). Considering the convergence of rises in land under irrigation in the ensuing periods of 2012-2017. The emergent levels of surge in the patterns as the maps showed, involves a gradual spread across some quartet of counties like Stanislaus, Madera, San Joaquin, and Tulare at varying rates estimated at -16.7% to -7.4% and 4.4% to 1.5%. Another dimension to the spatial distribution in the percentage of change in irrigated areas, reflects sequences of losses in the counties of Kern, Merced, and Fresno at the rates of -11.8%, - 4.6% to -4.2% respectively (Figure 2.13).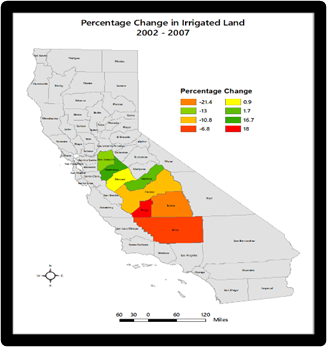 | Figure 2.12. Percentage Change In Irrigated Land, 2002-2007 |
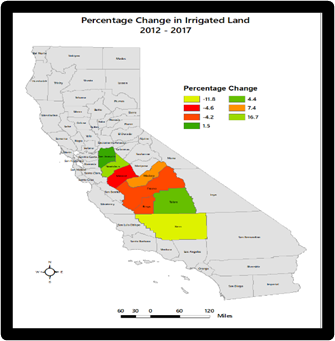 | Figure 2.13. Percentage Change In Irrigated land 2012-2017 |
Just as witnessed in earlier patterns that emerged in previous indicators of land use, during the two different censuses of 2002-2007 and 2012-2012, losses as manifested in the scale of percentage changes in farmland size were quite recurrent except for single spot in space signalling meagre gains. This coincides with the only increase of 3.5% in Merced County in 2002-2007 before a massive wave of losses of -16.1%, -15.7% to -13.2% surfaced across space in the adjoining counties of King, Kern, Fresno, and Tulare around the central and south axis of the map. From then on, there is also no hiding the facts given the emergent patterns in the shifts in farmland losses of different magnitudes, spread further into a trio of other counties (Madera, Stanislaus, and San Joaquin) by 9.2%, 0.1% (Figure 2.14). For the 2012/2017, in the study area, the county of Kern on a higher note posted the only gains of 9.00%. While this is at odds with the emergent patterns dominated by clusters of areas under multiple percentage declines (at 8.6%, 5.9% to -4.3% -3.3%) evident in the counties of King, Merced, Fresno, and Stanislaus. Elsewhere, Madera, Kern and San Joaquin saw single digits declines of 1.3%-1.8% to 1.5% amidst subsidy induced rising drops in the farmland areas (Figure 2.15). 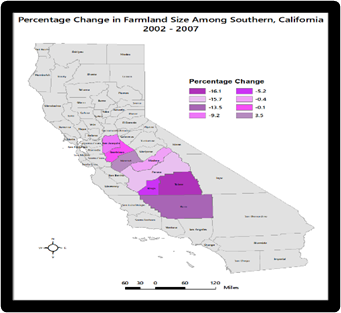 | Figure 2.14. Percentage Change In Farmland 2002-2007 South Central California |
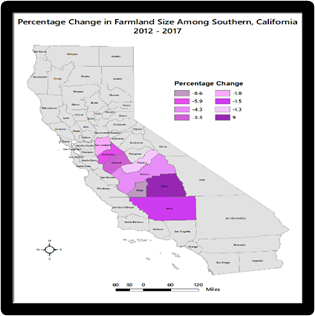 | Figure 2.15. Percentage Change In Farmland 2012-2017 South Central California |
Bearing in mind the large and multiple arrays of water bodies surrounding the study area, and upon which the beneficiaries of federal farm subsidy draw from. With these farm water sources made up of the basins of Tulare, San Joquin, the Estrade streams and the Sacramento Valley serving the sector. The rising demands from timing population in the zone for water from lakes and streams coupled with pressures mounted on the hydrology by subsidized farming through rising transfers for the agriculture activities, is a testament to the correlation between subsidy and water usage. This trend coincides with the pace of well water declines in space as represented by the spots clustered across the map and the proximity to the farm producing areas in the study area. The same applies also to the central valley corridor where ground water depletion has been occurring amidst the pressures from water transfers to farm operations benefiting from subsidy. This is compounded by the different levels of abnormal, moderate, and severe drought intensity based on California’s drought monitor conditions under the colors of red, and dark red, orange, and yellow (Figure 2.16-Figure 2.20). 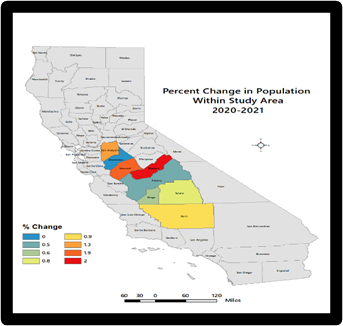 | Figure 2.16. Percentage Change in Population 2020-2021 |
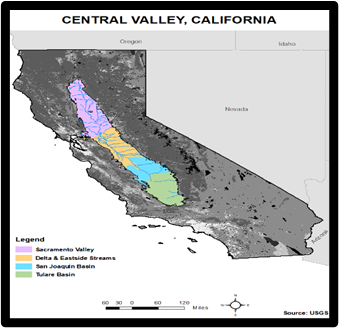 | Figure 2.17. Central Valley Watersheds |
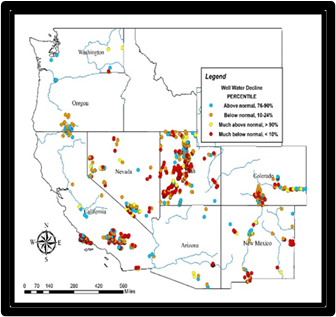 | Figure 2.18. The Percentile of Well Water Declines |
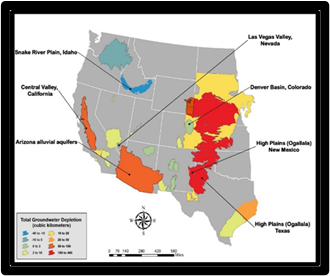 | Figure 2.19. The Total Ground Water Depletions |
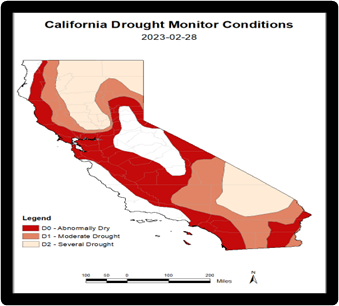 | Figure 2.20. California Drought Monitor Conditions, 2023 |
3.4. Factors Shaping Subsidy Allocations
The essential elements fuelling the environmental impacts of farm subsidy over the years in terms of California’s South-Central region did not occur in isolation. They are linked to different policy, socio-economic, and physical and environmental factors. These elements are described below one after the other.
3.4.1. Policy Elements in Place
The growing continuation and capacity of farms in the study area of South-Central California cannot be separated from the directions of existing policy making process in the country. The one thing among others to glean from policy process stems from the institutional bias and the preference for the five core commodity crops. For sure, the current policy is punctuated with ambiguity seeing the way federal authorities promote subsidies for water, irrigation farming and handouts to commodity crop while negating healthy food crops in the implementation of subsidy in the study area. From the absence of healthy food on those listed as subsidized, one gets the impression, that the United States authorities only assist farmers with aid on those items known to create health issues like the obesity pandemic. While this is based on the manner upon which the government reserves unnecessary preferential treatment for top commodity producers. It comes with no level playing field for fruit farms in the study area, which is not what subsidy should be all about, considering the overall implications on the system and the actual mixed messages and contradictions. The presence of such flawed process and the unreadiness to ensure proper applications of policies are key limiting elements. At the same time, despite negative ecological and health effects of agricultural overflow, such kind of pollution stands largely uncovered by regulation. In as much as, other sectors must conform to the national guidelines intended to make potable water fresh and hygienic and keep all the country's waterways usable. Traces of subsidized farm wastes prohibited in line with the federal Clean Water Act, are often found in lakes. Farming being California’s biggest sector and given one exempt in the list of many water contamination protocols. In the past years, a statewide partnership of community welfare groups has canvassed to control agricultural water contamination, noting the immunity allows runoff comprising of pesticides, nitrates, and heavy metals from more than 7 million acres of agricultural farmland to contaminate hundreds of miles of lakes and rivers waterways and eventually potable water. In the initial part of 2004, after which Central Valley Regional Water Quality Control Board chose to continue the exceptions, Earthjustice, Waterkeepers and group of other organizations, took legal action to induce the regional board and the State Water Resources Control Board to control agricultural runoff impacts, hence the connection.
3.4.2. Economic Forces
California unlike its competitors, is the most influential agricultural state, in the US. As such, the state’s ranking as the number one nationwide and the number 5 globally in terms of economic ranking of over 3 trillion dollars if listed as a country makes the Golden state a powerhouse. Accordingly, the state’s monetary receipts from the transactions in agricultural commodities in every category outpaces other states. For that, during the 2020 planting season, the state’s farms, ranches, and plant nurseries generated $49.1 billion in cash receipts, deemed below 3.3% from the previous year. At the same time, California’s agricultural exports equalled $20.8 billion, but 2.8% below in 2019. Such a drop in economic outlook based on performance, echoes the impacts of C-19 pandemic and the uncertainty of moving vast supplies of milk and dairy products and fresh produce from the farm industry to foodbanks, where it was urgently desired to serve those in need during the crisis. While some of the factors affecting agricultural production include supply chain issues, labor shortages and instability in agricultural commodities markets, as well as the general change in spending power in dollar, dictated by C-19 rules and others. Realizing the influence of the policy interventions essential in stabilizing the market. Concerned citizens of all ideological persuasions raised concerns over subsidies and the actual benefactors of the federal aid justifiably. Out of the $222.8 billion in subsidy payouts between 1995 to 2010, ¾ of all that ended in the hands of just 10 percent of agricultural-industry recipients nationwide. Accordingly, there exist a public outcry for more financial support for local farmers and others. In California, from 1995 to 2010, the top 10% of revenue-generating farms received a yearly average amount of $40,600 each in subsidies, while the bottom 80 percent got $649. During the period 1995-2021, the largest operator in the state was Farmers Rice Coop, Sacramento which received $146,174,314 in subsidies, while Dublin Farms in Corcoran got the second biggest subsidy: $24,457,113. Elsewhere, both Buttonwillow Land and Cattle Co. in Buttonwillow, received $21,283,414. Such an approach does not seem to balance existing gaps since it affects the capacity of marginal growers to hold on to land. Unsurprisingly, in cashing into these prospects in the zone, the number of irrigated farms were quite active over time in the counties. This is evident as subsidy trends in the South-Central Valley not only covered the payment of $3.75 billion to operate farm operations from commodities to conservation, but 44,689 farmers averaged $464m under several programs (cotton, corn, rice, cattle, disaster cost) from 1995-2020. Such yearly concentration of capital in few hands amounts to double standards and inequity while relegating ecosystem protection to the background.
3.4.3. Physical Environment
The study area, being a major national and global and regional agricultural hub, by location benefits from the scenery and tapestry and the allure of the Central Valley, also referred to as the Great Valley of California. As a physical feature conducive to some of the largest agricultural operations, extends through a vast swath of land mass measuring 20,000 square miles. This setting stands out as among the most significant structural sunken landform where water collects below surrounding areas in the globe. Sitting atop a middle posture in California, it is confined by the Cascade Range towards the north, the Sierra Nevada onto the east, while it is bordered by Tehachapi Mountains in the south, and the Coast Ranges and the San Francisco Bay in the western part. The Valley’s key signature feature in the context of farm productivity germane to the subsidy discourse stems from its thundering stature as vast agricultural territory causing water to run through the Sacramento and San Joaquin Rivers. With the zone split into two large parts made up of a northern one-third portion referred to as the Sacramento Valley and the southern side covering the San Joaquin Valley with the San Joaquin and the Tulare Basins in the mix. Considering that the subsidy transactions are made possible by the presence of over 250 different crop types cultivated in the Valley with an estimated market value of $17 billion yearly. The fact that the zone boosts of ¾ of the irrigated land in California and 17% of the US irrigated terrain in the Central Valley. Using less than 1% of U.S. agricultural land, the Central Valley as a food basket accounts for 8% of U.S. farm production (by value) and produces 1/4 of the nation's food, including 40% of the Nation's fruits, nuts, and other table foods. With the predominant crop types ranging from cereal grains to cotton, almost 20% of the country’s ground water needs is provided via pumping through Central Valley aquifers, making it the second-most-pumped aquifer system in the U.S. Now, farmers and towns therein are constructing water wells above 1000 ft. Since mining that much water changed the region's geology, pumping out that much water, the grounds separately begin to fall and collapse. In the study area, it has been noted that the level of groundwater depletion in California’s Central Valley has grown much faster intensely all through the drought periods when substantial farm water transfers has triggered low aquifer levels to unprecedented lows threatening to devastate the sub terrain water assets amidst repeated disbursement of farm subsidy.
4. Discussion
This study used a mix scale model connected to GIS and descriptive statistical techniques and secondary information to assess subsidy usages and the ecological impacts in selected counties in the South Central (Central Valley) region. The emphasis revolved around the issues, trends, impacts, underlying factors, and efforts. Overall, subsidy trends in the Central Valley covers the payoff of $37.15 billion dollars to fund quite a few produces starting with commodities to natural disaster expenditure. In a scheme involving mostly 44,689 farmers into mainly cotton, wheat, corn, rice, and dairy livestock operations supported with disaster and environmental conservation payment costs, gained from the program between 1995-2021. The payout during those periods reaffirms the standing of agricultural commodity at 66% or 4 of 6 of all ranked items on the metrics. The commodity group not only exceeded the remaining sets of the programs by much greater margins in monetary equivalencies estimated at half billion dollars individually. But considering the scale of distribution earmarked for each of the counties, all the farmers in the region remain principal benefactors of farm subsidy. In as much as this shows the depth of the program, and the region’s heavy reliance on subsidies, the primary commodities benefitting from federal subsidy initiatives like in other places in the US, appears genuinely rooted in the South-Central region of California. Considering the domination of cotton among the other items, the produce stood out as the most fully subsidized item from the frequency in 6 of 8 counties (from Fresno to Tulare) minus San Juaquin and Stanislaus County. This massive presence of federal subsidy support in over 99% of all counties as unparalleled as they appear, confers those places enormous possibilities at their own expense. This is still happening under a scheme upon which some still frown about the justifications behind the expenditures, the politics, and the misappropriation of agricultural subsidy disbursement as a policy tool supporting quite a few crops while negating healthy farm produces in the face of inadequate coverage for organics, minor farms, and operations at the fringe. Considering California’s rank as among the recipients of farm aid even though 92% of the state does not, being a rich agricultural producing state. From 1995 to 2021 at number 11 of beneficiaries nationwide with $16.3 billion. Much of the money goes to support cotton and rice growers. Yet only 10% rich and profitable farm operations accounted for much the yearly average distribution of the subsidy. This in turn leaves the outstanding 80% on the lower level of the scale with merely little. This in some ways amounts to dysfunctional system which many critics see as state sponsored privileged exercise exclusively established to serve well positioned predominantly big cooperate farms. With the reputation of the scheme completely riddled with contradictions, considering the composition of the state’s agricultural structure particularly across ethnic, racial and gender lines. This only further leaves the people scratching their heads and seeking more answers as to how they got here. Now this is not intended to lump blame on California alone. Afterall, why would the Golden state, the most productive agricultural state ranked number 11 -12 receive less Federal subsidy below Iowa, Missouri, and Illinois. Such a disparity out of a broken support system only rewards large farms cultivating just a few select crops, keeping off fruit and vegetable planters on farm operations to eke it out on their own. With most payouts tied to acreage sizes, it seems that those writing the legislation exploit loopholes to craft policies that benefit themselves. This leaves further doubts on the veracity of decisions reached in arriving at the allotment phase. Just as this stems from the focus on leading crops not reachable to marginal growers based on the rules. The unequal dispensation of the law in that way widens the gap between rich growers and the poor compelled to seek outside loans under difficult settings that do not serve them to flourish. The fact that the subsidy allocation formular drives the growing of major crops deeply reliant on further acreage enrolments. This usually encourages the urge to enlarge farm areas needing much water spraying, based on irrigation and treatment of agricultural land with nutrients and chemicals enough to press agroecosystems well over their thresholds. This results in the exposures to unwanted environmental risks coming from farming intensification pushed by reactions to the economy of scale in large agri-businesses. Because the dangers involve widespread use of agro-chemicals, farm nutrients and insecticides with risks to fragile ecosystem. Small farms not fully served by present subsidy structure are then forced to selling off their land assets to bidders from other uses resulting in further losses of farmland. Considering that farm subsidy and the activity in the sector depends on the forces located within the larger orbit of international capital. This really influences the continuity of small, operated farms thriving outside the conventional system. Given the small farms incapacity to absorb the fiscal shocks from volatility triggered by large farms in transactions sustained by state supported schemes of subsidy, makes farmland holding very daunting for small operators. In the process, the number of farms in the region not only dropped from 28,357-22,429 at a rate of -24.63% by 2002-2017 as the overall agricultural land area declined further by 12.70% all through 2002-2017. GIS analysis also showed changes in agricultural land indicators and other factors linked to the larger regional agricultural structure together with widespread spraying of agrochemicals and nutrient usage throughout the counties. With increments in land areas treated with fertilizer fully manifested remarkably in 7 of 8 counties during the 2012-2017 census periods. The region’s abundance in large areas of natural sanctuaries of biodiversity and adjoining watersheds remain vulnerable. Given the attribute of Central Valley ecosystem, as agriculturally intense hub where land use indices of farms and farmland are actively in continued use. They appear substantially susceptible to agricultural subsidy effects via immanent shifts evidenced in the patterns of gains and declines in the zone. This entailed regional agricultural land variations of 10,025,419-8,895,167 acres at a combined average rate of -12.70% all through 2002-2017 as 7 of 8 counties posted farmland declines in 2002-2007 and 2012-2017 respectively. Considering the declines in irrigated land at 6.20% from 2002-2017, note that the water table on the Central valley aquifer dropped notably by 8.58 km3/yr, from 2019–2021 due to the diversions of water to bolster farm operations. Based on the reliance of most farms on the central valley waters, this primary water aquifer accounts for 65% of most irrigation supplies in the region. In a setting where farmers and towns are mining and constructing wells above 1000 ft and groundwater providing 50% of irrigation water distribution in central valley. Under the central valley water program, the top 5% or 341 farms, take in 49% of the irrigation water. From the average, the said farms collected an estimated value of 3,400 acre-feet of water. This is equivalent to a subsidy of $513,000 and large enough water to meet the needs of 2.3 million homes yearly. Since the effects emanate from different socio-economic and policy failures and physical elements, recovery initiatives under implementation to mitigate the concerns has not fully done enough to contain the impacts fully. Considering the emerging concerns, the paper offered several suggestions including the need for the reform of farm subsidy policy, the establishment of educational and awareness programs on the effects of farm aid, the need for environmental considerations, regular monitoring of natural areas adjacent to heavily subsided farms, the elimination of both fiscal and market distortions often skewed in favour of big farms and regular use of geo-based analysis.
5. Conclusions
This research focused on an assessment of farm subsidy effects on handful of counties along California’s South Central region and its adjacent ecosystems with important results: a) The study area is heavily dependent on farm subsidy, b) Uneven concentration of subsidy recipients in some areas c) mix scale methods stayed on target in unveiling the issues; d) the natural ecosystem remains highly vulnerable; e) the impacts of farm aid on ecosystem caused by various elements. Generally, the predicted effects of farm subsidy on the California central ecozone remains obvious. This trend cannot be ignored considering the level of monetary and ecological worries ignited by state assisted expenditures earmarked for the beneficiaries in the zone. Notwithstanding the environmental and social disparity risks at work, the study area has over the years received enormous sums of cash in government subsidy directed at farmers. From the census years of 1995 to 2020, the South-Central California zone collected about 37,159 billion dollars. Looking at how large amounts of that magnitude in cash are allocated to farmers for the sustenance of commodity produces. They are also channelled at essential environmental programming made up of conservation and natural disaster mitigation throughout the periods of 1995-2020 period. In the process, Fresno County outpaced any other place in the region as the biggest beneficiary of farm assisted aid estimated at $843,674,371 million dollars. The other two big recipients of huge agricultural aid estimated at more than $600 million amongst top leading counties consists of Kern and Tulare. In the other places, another duo of counties (King and Merced) pulled in sizable amounts of farm aids valued at the combined amount of over $900 million dollars. This represents individual sums of $549,027,868-$406,081,707. In the same periods, a trio of counties, San Joaquin, Stanislaus, and Madera at $200 million plus - $100 million plus in aid, each finished among the last batch of county recipients on the listings. Recognizing the citizens pleas for ethical uprightness and integrity in the disbursement of money, amidst budget deficits and ecological disasters, resource depletion and degradation prompted through subsidy. The capacity of this study in delineating the heavy dependency of planters in California South Central Valley on agricultural assistance, ushered in a system to serve many stakeholders. This encompasses organizations and policy makers committed to evaluating the patterns of disbursements and assure the public, that subsidies are solely meant for the people in a dire need of assistance. The basis is that farm aid ought to be utilized solely for its unique purposes in serving those in need without damaging the environment, while helping underserved planters desirous of assistance to succeed. Hence, the assessment offers a chance for those managing farm subsidy to reconsider the widespread need for change and discourage dependency syndrome in a way that promotes efficiency and fairness.The current allocation formula of farm subsidy in the South-Central Valley seems plagued by unequal disbursement of funds over the past years on one commodity (cotton) and the large concentration of biggest subsidy dollars in quite a few counties to the detriment of the others. The unequal consolidation of a specific crop and of aids beneficiaries within certain areas as manifested in the region, carry little upsides with major liabilities. This might be discomforting in situations where revenue projections are impeded by price volatility and the eruption of diseases specific to popular crops that dry up subsidy dollars meant for planters operating in 6 of 8 counties. While such farmers encounter the plights of unwanted liabilities of restricted harvest in the case of volatility. This indicates how the institutionalized prejudice directed against heathy foods like fruits not covered in the subsidy listings could backfire and haunt those implementing such a myopic policy. The major effects comprise of the contradictions shaping subsidy money disbursement criteria on solely perceived feasibility of leading crops, land area and the size of farm, without considering people deemed ineligible. From the way small-scale and minority farms are marginalized. The present approaches are so characteristically unfair that it always sows the seed of public doubts on issues associated with unequal allocation of agricultural aid to people already rich but overlooking the likes of small farms. In so doing, farm subsidy loses its appeal as policy instrument meant to assist the right individual deemed in need in a bid to sustain the social safety net. In recognizing such anomaly, the expectation is that the individuals directing disbursement of farm aid, will be given the chance to scrutinize the bias involved in the unfair concentration of agricultural subsidy funds in just select few counties for wealthy operators. The intentional dumping of big amounts of aid dollars in only a quartet of counties, underpins unseen fiscal and policy flaws rooted in the enrichment of a few while depriving others. Thus, in the absence of this type of analysis, farm aid allotment standards risk operating under the same obsolete template at the expense of poor groups and ecological health. Essentially, the research outcome will enhance the capacity of managers to grasp the issues with the readiness needed in addressing the common anomaly of unfair concentration of farm subsidy just in few affluent hands. This also raises awareness on how the same huge dollar allocation enticements threaten the region’s delicate agroecosystem. Consequently, the appraisal of subsidy impacts injected new elements for policy makers to draw from in their search for solutions in a much more efficient manner.Similarly, the applications of mix scale method of GIS and descriptive statistics as research tools showed a touch of timeliness. Applying such a versatile mix-scale method of descriptive statistics and GIS mapping as operating devices injected extra depth to the regional appraisal of the environmental effects of agricultural subsidy. Given that the dispensing of agricultural assistance demands a multi-dimensional structure like the mix-scale as applied in the assessment. The tool was overly useful in characterizing the study area and spotting the tendencies, coupled with the procurement of data on the factors, the tabulation of beneficiaries and the subsidy amount. Additionally, the applications pinpointed locations of major freshwater ecosystems and stressors associated with pollution and water depletion. Further along these lines, the method also delineated the usage of farmland during the process, the number of farms, the applications of fertilizers and chemicals and insecticides and others. This method serves a vital purpose in fulfilling the needs of researchers involved in the geo-spatial analysis of regional effects of farm subsidy in the country’s most heavily cultivated farm hubs like the California South Central Valley. Regarding the geographic spreading of stressors and probable risks in the counties. The GIS visual analytics as a planning device, remained very important in pinpointing changes in the core indices of number of farms and farmland size and irrigated spots at the locus of most subsidy dealings. From there, the mapping not only displayed the probable lines of risks based on the location in space of major aquifers and the vicinity to areas of intense farming under analysis. But the coverage also showed the rates of changes in fertilizer spraying and usage of chemicals on farms and farmland, their dispersal, and visions into imminent hazards over time and space. This capacity indicates a big leap ahead in effective planning and minimization of impacts. Detecting these risks enriches the dimensions of policy makers in prioritizing action plans in places considered susceptible to degradation, depletion and locales of underserved planters affected by unequal farm aid. The tool provided effective benchmarks for assessing the difficult category of marginal farming localities and counties habitually disregarded and where people get no considerations in the payment of huge farm aids dollars in the zone. The sound use of mix scale model requiring geographic visualizations together with subsidy info, as analytical device increases our insight on concerns arising from farm aid allotment in the central valley. Realizing the significance, improves the advancement of monitoring abilities vital in mitigating the shocks encountered in farming counties at the margin. The enquiry stayed quite on course in highlighting the rising exposures of the ecosystem. This stems from the heavy allocation of farm aid through usage as manifested from the declines in agricultural land, the volumes of water diversions through irrigation acreages and the use of chemicals and insecticides. Recognising additional dangers encompassing environmental degradation and the use of insecticides on farm landscape and the incessant stress placed on the Central Valley aquifer and the ongoing depletion pace, reiterates the appropriateness of the enquiry. The location of adjoining spots vulnerable to water decline along the aquifers, water pollution and potential erosion of natural habitats from farm nutrients, shown by the enquiry remains very crucial. In this manner, the study brought in ecological protection element necessary in spotting dangers while enhancing the wellbeing of localities and the conservation of a fragile ecosystem now moving beyond limits due to stressors emanating from unwise use of farm aid incentives and limited observance of best management practices. Aside from identifying the risks involved through various stressors associated with farm aid effects in the region and the liabilities for nearby natural areas. Being a study site located in the proximity of a major ecozone in one of the most heavily farmed areas in the nation. The presence therein of lakes, rivers, and marshes which communities rely on for farming amidst degradation, and water depletion impeding the ecosystem, affirms the essence of the enquiry. Demonstrating such disaster hot spots given the growing stressors, shrinking land area and water degradation and aquifer depletion triggered by farm subsidy has many upsides. Making localities abreast of such elements and facts, provides people the opportunity of assessing places at risk and the necessity of making those areas the focus of recovery. By pinpointing the susceptibility to environmental degradation and water pollution and depletion around the region, the enquiry re-affirmed that the impact of agricultural aid extends to every side of society economy-environment interface discourse. Added to that, understand also, that the impacts of farm aid on the study area’s (ecosystem) did not occur in isolation. They are caused by various socio-economic and physical elements rooted in the larger regional agricultural structure. Bearing in mind the vulnerability of the region’s ecosystem to stressors and the nature of liabilities from farming practices sustained by subsidies and what emerged from this study. Decision makers and county planners in the region would be tasked in the periods ahead to seek urgent responses to many pertinent questions that are germane to the welfare of the ecosystem. The questions involve which future liabilities are likely to emerge from farm aid practices in the California Central Valley ecosystem? What will the level of impacts be like? What patterns will the spatial aspects of the risks assume? Which other factors will influence subsidy dependency in the region? From these questions, there are plenty prospects for research and policy practitioners to shift the strategy on subsidy impacts. This can be attained using policy interventions emphasizing mitigation with effective measures in the decision-making process. The belief is that this will protect communities and the surrounding ecosystem from environmental liabilities of farm aid in the years ahead. Fundamentally, the South-central region as a heavily farmed area dependent on subsidy remains an ecosystem under stress given the persistent vulnerability to agricultural subsidy burdens.
References
| [1] | Merem, E.C. (2022). Assessing the Environmental Impacts of Farm Subsidy in North Texas Region. International Journal of Agriculture and Forestry. 2022, 12:1: 9-28. |
| [2] | Environmental Working Group (EWG). (2022 a). Farm Subsidy Data Base. Farm Subsidy Rankings For Counties In California For Total Subsidies. Washington, DC: EWG. |
| [3] | Environmental Working Group (EWG). (2022).1995-2021 Farm Subsidy Top Programs Data Base: California Summary Information” Washington, DC:EWG. |
| [4] | U.S. Department of Agriculture, USDA (2002). US Farm Bill. 24 CBO Now Forecasts that The farm Bill Will Cost US$190 billion (US$9.3 Billion More Than the 2001 Baseline. Retrieved 2023 March 28th From http://www.usda.gov/farmbill/. |
| [5] | Pearce, D. (2002). Environmentally Harmful Subsidies: Barriers to Sustainable Development. Paper Presented At the OECD Workshop On Environmentally Harmful Subsidies, Paris, France 7-8 November 2002, p.9. |
| [6] | Mayer, H. (2002 July). The 2002 US Farm Bill`s Implications for Commodity Markets and Canada`s Agri-food Sector. ONT, Guelph: George Morris Center. |
| [7] | Merem, E. C. (2023 May-June). The Environmental Impacts of Farm Subsidy in California’s South-Central Region. Department of Urban and Regional Planning Unpublished Manuscript. Jackson, MS: Jackson State University. |
| [8] | Merem, E.C. (2022 March). Evaluating the Ecological Effects of Agricultural Subsidy in The North Texas Region. Paper Presented at the 31st Annual International (West Coast) Conference on Soil, Water, Energy, and Air (AEHS). San Diego, CA: March 14-17, 2022. |
| [9] | Merem, E. C. (2016). Assessing the environmental impacts of agricultural subsidy in the Mississippi Delta region using GIS. International Journal of Agriculture and Forestry, 6(1), 1-21 |
| [10] | Merem, E. C. (2015, March). The Environmental impacts of farm subsidy in the Mississippi delta using GIS. Poster presented at 25th Annual AEHS Conference, San Diego, CA. |
| [11] | Porter, G. (2003). Fisheries Subsidies and Overfishing: Towards a Structured Discussion. New York Cit, NY: Economic and Trade Branch. Division of Technology, Economics, and Industry. United Nations Environment Program. |
| [12] | Editorial Board (2011 April). Federal Farm Subsidies Should Be Slashed. The Washington Post. |
| [13] | Organization for Economic Co-operation and Development. OECD. (1998). Improving the Environment through Reducing Subsidies, Paris, France: OECD. |
| [14] | Edwards, C. (2018 April). Reforming Federal Farm Policies. Washington, DC: CATO Institute. |
| [15] | Karel, M. (2003 May). The Economic and Environmental Impacts of Agricultural Subsidies: An Assessment of the 2002 US Farm Bill and Doha Round.: An Overview of the State of Knowledge, paper presented in Session 2.1 at the OECD Workshop on Environmentally Harmful Subsidies, Paris, France: OECD, 7-9 November 2002. |
| [16] | Environmental Working Group (EWG). (2023). 1995-2021 Farm Subsidy Top Programs Data Base: Various Years Summary Information. Washington, D.C: EWG. |
| [17] | Environmental Working Group EWG. (2022). California Water Subsidies Large Agribusiness Operations - Not Small Family Farmers- Are Reaping a Windfall From Taxpayer-subsidized Cheap Water. Retrieved 2023 March 28th From https://www.ewg.org/research/california-water-subsidies. |
| [18] | Taxpayers For Common Sense. (2018 April). Corporate welfare. Factsheet Impact of U.S. Agriculture Subsidies on Water Quality Washington, DC: Taxpayers For Common Sense Retrieved 2023 March 28th From https://www.taxpayer.net/agriculture/impact-of-u-s-agriculture-subsidies-on-water-quality/ U.S. agriculture. |
| [19] | Taxpayers For Common Sense. (2018 April). Effects of Farm Subsidies on Farm Management Decisions. Washington, DC: Taxpayers For Common Sense. |
| [20] | Amadeo, K. (2020 November). Farm Subsidies with Pros, Cons, and Impact How Farm Subsidies Affect You. The Balance. |
| [21] | The Editors. (May 2012). For Healthy Country, Overhaul Farm Subsidies. Scientific American. 306:5:1-2. |
| [22] | Physicians Committee For Responsible Medicine. (2014). Agriculture and Health Policies In Conflict. Washington, DC: Physicians Committee For Responsible Medicine. |
| [23] | Wallinga, D. (2010). Agricultural Policy and Childhood Obesity: a Food Systems and Public Health Commentary. Health Affairs. 29: 405-410. |
| [24] | Franck, C. (2013). Agricultural Subsidies and the American Obesity Epidemic. American Journal of Preventive Medicine. 45:3:327-333. |
| [25] | Fields, S. (2004 October). The Fat of the Land. Do Agricultural Subsidies Foster Poor Health. Environmental Health Perspectives. 112: 14: A820- A823. |
| [26] | Bittman, M. (2011 July). Bad Food? Tax It and Subsidize Vegetables. The New York Times. |
| [27] | Frisvold, G. B (2004 November). Water Policy, Economics, and Systems Analysis Free Access; How Federal Farm Programs Affect Water use, Quality, and Allocation Among Sectors. Retrieved 2023 March 28th From https://agupubs.onlinelibrary.wiley.com/doi/full/10.1029/2003WR002753. |
| [28] | Ostria, M. (2013 August). How US Agricultural Subsides Harm The Environment, Taxpayers and The Poor. Washington, D.C: National Center For Policy Analysis. 126:1-4. |
| [29] | United States Department of Agriculture (USDA). (2017). Various Years Census Data: County Highlights. Washington, D.C: USDA NASS. |
| [30] | United States Department of Agriculture (USDA). (2021). Various Years Census Data: County Highlights. Washington, D.C: USDA NASS. |
| [31] | National Public Radio (NPR). (2021). In the Absence of Adequate Water to Be Shared to All; California Growers, Are Depleting Aquifers. Retrieved 2023 March 28th From https://www.npr.org/2021/07/22/1019483661/without-enough-water-to-go-around-farmers-in-california-are-exhausting-aquiferswww.npr.org/. |
| [32] | LA Times. (2022 June). California Land is Sinking as Groundwater Levels Drop. New Research Shows How California Could Fix it. Los Angeles Times. |
| [33] | US Department of Interior. (1997). The Impact of Federal Programs on Wetlands - Vol. II. Office of Environmental Policy and Compliance. Retrieved 2023 March 28th From https: //www.doi.gov/oepc/wetlands2/v2ch11.html |
| [34] | Merem, E. C. (2023 March). a The Environmental Impacts of Farm Subsidy in California’s South-Central Region. Presented at the 32nd Annual International (West Coast) Conference on Soil, Water, Energy, and Air (AEHS). San Diego, CA. March 20-23, 2023. |
| [35] | US Congressional Budget Office. (1997 August). Water Use Conflicts In the West: Implications of Reforming the Bureau of Reclamation's Water Supply Policies. The Congress of the United States. Retrieved 2023 March 28th From https: www.cbo.gov/ftpdocs/0xx/doc46/water use.pdf. |
| [36] | Jamess, I. (2022 December). Climate & Environment. ‘Full-on crisis’: Groundwater in California’s Central Valley disappearing at Alarming Rate. LA Times. Retrieved 2023 March 28th From https://www.latimes.com/environment/story/2022-12-22/groundwater-depletion-is-accelerating-in-the-central-valley. |
| [37] | Garthwaite, J. (June 2022). Groundwater Depletion Causes California Farmland To Sink. Stanford Study Shows Water Levels Must Rise To Halt Subsidence. Stanford, CA: School of Earth, Energy & Environmental Sciences Stanford University. Retrieved 2023 March 28th From: https://news.stanford.edu/2022/06/02/will-californias-san-joaquin-valley-stop-sinking. |
| [38] | Friedemann, A. (2021 September). Aquifer Decline in California. Seventy Percent of Our Groundwater Is Used to Grow Irrigated Crops. Energyskeptic. Retrieved 2023 March 28th From https:www.energyskeptic.com. |
| [39] | Merem, E. C. (2021). Assessing Hydraulic Fracking Issues in the US Southeast and Western Region, Energy and Power, 11: 1: 1-19. |
| [40] | Merem, E. C. (2021). Assessing the Risks from Changing Climate in South Texas Region, Resources and Environment, 11: 1: 18-34. |
| [41] | Merem, E. C. (2021). The Assessment of China’s Scramble for Natural Resources Extraction in Africa, World Environment. 11: 1: 9-25. |
| [42] | Merem, E.C. (2021). Analyzing the Use of Genetic Modified Organisms (GMOs) in Agriculture in the US Midwest Region, Food and Public Health. 11: 1: 1-17. |
| [43] | Merem, E.C. (2022). Analyzing Water Resources Management Issues Along the US Midwest Region. Resources and Environment. 12:2: 25-46. |
| [44] | Merem, E. C. (2021). The Regional Assessment of Groundnut Farmland Use in Northern Nigeria, International Journal of Food Science and Nutrition Engineering. 11:1. 1-19. |
| [45] | Merem, E. C. (2020). Assessing Water Resource Issues Among States in the US Southeast Region. Marine Science. 8:1: 1-23. |
| [46] | Merem, E.C. (2022). The Evaluation of Wind Energy Potentials in South Africa. Energy and Power. 2022, 12:1: 9-25. |
| [47] | Merem, E.C. (2022). Assessing Issues in Water Resources Use within Countries in West Africa. International Journal of Ecosystem. 12:1: 1-19. |
| [48] | Merem, E.C. (2020, February). Analyzing the Use of Genetic Modified Organisms GMOs in US Agriculture In the Midwest Region. Paper Presented At The 2020 Mississippi Political Science Conference (MPCC), Jackson, MS. |
| [49] | United States Bureau of Census. (2020). Census Quick Facts. Washington. D.C: Bureau of Census. |
| [50] | Merem, E C. (2023 March b). The Environmental Impacts of Farm Subsidy in California’s South-Central Region. Abstract submitted the 32nd Annual International (West Coast) Conference on Soil, Water, Energy, and Air (AEHS). San Diego, CA. March 20-23, 2023. |
| [51] | United States Geological Survey (USGS) (2022). California Central Valley. Water Science Center. The Department of Interior. Washington. D.C: USGS. |
| [52] | Wahl, R. (1989). Markets for federal water. Subsidies, property rights, and the Bureau of Reclamation. Washington, DC: Resources for the Future. |
| [53] | US General Accounting Office. (1989 October). Water Subsidies. Basic Changes Needed to Avoid Abuse of the 960-Acre Limit. Retrieved 2023 March 28th From https:// www.gao.gov/cgi-bin/getrpt?GAO/RCED-90-6. |
| [54] | Levy, MC. (2020). Fine-Scale Spatiotemporal Variation In Subsidence Across California’s San Joaquin Valley Explained By Groundwater Demand. Environmental Research Letters 16. |
| [55] | Gerbens-Leenes, W. (2009) The Water Footprint of Bioenergy. Proceedings of the National Academy of Sciences. 106: 10219-10223. |
| [56] | Famiglietti, J. (2022). Groundwater Depletion in California’s Central Valley Accelerates During Megadrought. Nature Communications. 13: 7825. |
| [57] | Gasparini, A. (2021). Scientists worry that California’s ‘fossil water’ is vanishing. Mercury News. |
| [58] | Faunt, C.C (2009). Ground Availability of The Central Valley Aquifer, California USA. US Geological Survey (USGS). Professional Paper. Washington, DC: USGS. |
| [59] | Newman, C. (2018). How Are Western Water Districts Managing Ground water Basins. California Agriculture, 72-28-37. |
| [60] | Faunt C.C. (2016.) Water Availability and Land Subsidence In The Central Valley, California USA. Hydrogeological Journal, 24-675-684. |
| [61] | Abrahm, L. (2015 May). Federal Dollars Are Financing the Water Crisis In the West. ProPublica Examination Shows That the Scarcity of Water is As Much a Man-Made Crisis as a natural One Retrieved 2023 March 28th From https://www.scientificamerican.com/article/federal-dollars-are-financing-the-water-crisis-in-the-west. |
| [62] | Merem, E. C. (2020). Evaluating Geothermal Energy Potentials In The US Western Region With GIS. International Journal of Engineering. 10:2: 23-40. |
| [63] | Merem, E. C. (2019). Assessing Issues in Wildland Habitat Management in the State of Mississippi. Frontiers in Science, 9:1: 5-19. |
| [64] | Merem, E. C. (2019). Regional Assessment of Climate Change Hazards in Southern Nigeria with GIS. Journal of Safety Engineering, 8:1: 9-27. |
| [65] | Merem, E. C. (2019). Regional Assessment of the Food Security Situation in West Africa with GIS. Food and Public Health. 9:2: 60-77 |
| [66] | Merem, E. C. (2015). GIS assessment of farm landscape change in South Carolina lower region. International Journal of Agriculture and Forestry. 5:2: 92-112. |

 Abstract
 Reference
 Full-Text PDF
 Full-text HTML