-
Paper Information
- Paper Submission
-
Journal Information
- About This Journal
- Editorial Board
- Current Issue
- Archive
- Author Guidelines
- Contact Us
Food and Public Health
p-ISSN: 2162-9412 e-ISSN: 2162-8440
2022; 12(1): 14-28
doi:10.5923/j.fph.20221201.03
Received: Mar. 18, 2022; Accepted: Apr. 6, 2022; Published: Apr. 29, 2022

The Analysis of Dairy Production and Milk Use in Africa Using GIS
 Abstract
 Reference
 Full-Text PDF
 Full-text HTML
E. C. Merem1, Y. Twumasi2, J. Wesley1, D. Olagbegi1, M. Crisler1, C. Romorno1, M. Alsarari1, P. Isokpehi1, A. Hines3, G. Hirse3, G. S. Ochai4, E. Nwagboso5, S. Fageir6, S. Leggett7, J. Offiah1, S. Emakpor8
1Department of Urban and Regional Planning, Jackson State University, 101 Capitol Center, Jackson, MS, USA
2Department of Urban Forestry and Natural Resources, Southern University, Baton Rouge, LA, USA
3Department of Public Policy and Administration, Jackson State University, 101 Capitol Center, Jackson, MS, USA
4African Development Bank, AfDB, 101 BP 1387 Avenue Joseph Anoma, Abidjan, AB, Ivory Coast
5Department of Political Science, Jackson State University, 1400 John R. Lynch Street, Jackson, MS, USA
6Department of Criminal Justice and Sociology, Jackson State University, 1400 John R. Lynch Street, Jackson, MS, USA
7Department of Behavioral and Environmental Health, Jackson State University, 350 Woodrow Wilson, Jackson, MS, USA
8Department of Environmental Science, Jackson State University, 1400 John R. Lynch Street, Jackson, MS, USA
Correspondence to: E. C. Merem, Department of Urban and Regional Planning, Jackson State University, 101 Capitol Center, Jackson, MS, USA.
| Email: |  |
Copyright © 2022 The Author(s). Published by Scientific & Academic Publishing.
This work is licensed under the Creative Commons Attribution International License (CC BY).
http://creativecommons.org/licenses/by/4.0/

Milk production and intake in many countries in the African continent is very essential in the daily lives of communities. Dairy is not only at the center of community welfare from North to Southern portions of Africa, but it remains a vital component of economic viability in terms of employment and income generation and nutritional intake in many countries. Yet, over the last several years, milk production among nations continues to be besieged by multiplicity of challenges that are both regional, global, and local in nature and somewhat compounded by current policy in the continent regarding marketing access to foreign producers and limited intake below the required thresholds in the globe. Being a continent with the lowest median age in the world with many very young citizens, one would assume that in the context of food security, public enlightenment campaigns over regular milk and dairy intake should be the norm, but that has not always been the case. At the same time, the problem seems compounded by the current pace at which many European Union nations are turning the African continent into a dumping ground of imported milk. This anomaly impacts the capacity of local producers in meeting the rising demands among consumers. Given the current policy lapses in Africa and the ability of EU producers and other nations to exploit it in the face of limited production capacity, and regional disparities in the continent in which the North and Southern zone outpace the other areas. Very little has been done in the literature using mix scale techniques of Geographic Information Systems (GIS) and descriptive statistics to capture this issue spatially. While this enquiry will fill that void in research, this paper assesses milk production trends in the continent of Africa. The study emphasizes the issues, trends, factors, and future lines of action. Accordingly, the results under the mix scale model shows rising output, and changes in production, gains and declines, regional disparities, limited usage of milk and gradual dispersion of production indices across space. In as much as the changing trends emanate from a host of socio-economic and physical and environmental factors located within the larger agricultural structure. The paper proffered five solutions ranging from education on milk intake among the public, efficient policy, monetary assistance to local producers, closure of dumping loopholes, periodic monitoring, and the design of regional and continental dairy management information system.
Keywords: Dairy production, Milk, Africa, Food security, Regions, GIS, Change and Factors
Cite this paper: E. C. Merem, Y. Twumasi, J. Wesley, D. Olagbegi, M. Crisler, C. Romorno, M. Alsarari, P. Isokpehi, A. Hines, G. Hirse, G. S. Ochai, E. Nwagboso, S. Fageir, S. Leggett, J. Offiah, S. Emakpor, The Analysis of Dairy Production and Milk Use in Africa Using GIS, Food and Public Health, Vol. 12 No. 1, 2022, pp. 14-28. doi: 10.5923/j.fph.20221201.03.
Article Outline
1. Introduction
- Milk production and intake in many countries in the African continent is very essential in the daily lives of communities in quite a multiplicity of ways [1,2]. This is so since milk ranks high amongst the deepest providers of animal protein essential for humans [3] and readily available in practically the whole thing people treasure beginning as crushed or processed milk and cheese to deep freeze ice cream together with yoghurt [4]. They are now commonly displayed in most supermarkets all through the continent of Africa [5]. Accordingly, dairy is not only at the center of community welfare from North to South Africa but remains a vital component of fiscal viability via jobs and income generation and nutritional intake in many nations [6]. Surely, dairy production in Africa plays central role in economic and sustainable development all over the continent [7]. How can nations and communities talk of prosperity of future generation without guaranteeing regular access to milk for its children and citizens [8,9,10,11] especially in a part of the globe with one of the highest birth rates over time [12]. While milk use enhances food security [12], good nutrition and poverty reduction, dairy is also a catalyst for rural economy in pastoral areas [13]. Yet, over the last several years, milk production among the countries continues to be besieged by multiplicity of challenges that are both regional, global, and local in nature and somewhat compounded by current policy in the continent regarding market access to foreign producers and limited intake below the required thresholds in other parts of the globe. Being a continent with the lowest median age in the world with vast proportion of very young citizens, one would assume that in the context of food security. Public enlightenment campaigns over regular milk and dairy intake should be the norm, but that has not always been the case [14,15,16,17,18,19,20].Given the potentials, authorities even anticipate robust surge in the region considering the large quantity of cows, goats, and sheep [21,22,23,24,25]. In the process, local milk production in West Africa has already risen by 50% since 2000-2016 to 4 billion liters in 2019[26]. Similar turnarounds have been seen in East Africa and the South African zones as well [27,28]. Despite substantial growth in recent years, the dairy sector in Africa faces major drawbacks such as high production costs and low yields. In a continent where cows are abundant, it remains a shocking reality that Africa currently does not produce enough milk to meet its own needs [28]. Just as local output therein does not currently meet the demands in the sector by 100%. Only 50% of consumption comes from local production while imported milk powder helps meet the remaining needs [29]. Despite having more than 10% of the world’s cattle population, Africa contributes less than 3 percent to global milk production, but spends over $500 million on imports from EU and the Americas while its farmers stay impoverished [30]. For a food product as basic and vital to the human diet as milk, the consumption and demand potentials for milk in Africa remains underexploited [31]. At the same time, the issues seem compounded by the pace at which many European Union nations are turning the African continent into a dumping ground for imported milk and dairy products. In the face of current policy lapses in the continent and the ability of EU producers and other nations to exploit it due to limited production capacity [32]. Regional disparities in the continent shows how the North and Southern zone outpace the other areas. This has been made worse by the lack of infrastructure and appropriate equipment in the production process, Africa’s limited tech innovation in dairy and milk preservation, low-grade feed affecting animals and the changing ecology. This anomaly not only impacts the capacity of local producers of the industry in Africa in meeting the rising demands among consumers, but it does keep the continent worse off, considering the pace of declines in milk production therein, amidst rising production in Europe, Asia, and America [31-35].From the tabulation of total global production of cow milk estimated at 675.6 metric tonnes in 2017. Africa produced 35.4 metric tonnes in 2017 or 5.2% of the output. Although such level of production does not seem adequate to quell the need for milk and diary items throughout the continent of Africa, it still results in importations from various areas. Even at that, Africa possesses the capacity to expand milk output and fulfil the demands of its 1.2 billion citizens and set aside the remainder for shipments elsewhere. Given the pace at which global trade of dairy items related to milk products rose by 72.9 million tonnes to 75 million tonnes from 2017-2018 at a rate of 3%. At same time, in 2018, around 2.6 million tonnes of skim milk powder, 2.57 million tonnes of cheese, 2.46 million tonnes of whole milk powder, and 917.9 tonnes of butter were shipped out. With the quest for milk expected to increase yearly at 2.5% in 2020 in the face of surge in suburbanization and growing earnings [30]. The existing void in milk transactions in the continent of Africa are filled through overseas importations [30]. Whereas folks many see it as serving a need for the time being, it comes at a cost deemed unsustainable in the likely future. With earnings surging throughout Africa and many individuals moving up in socio-economic strata, the necessity and use of milk will likely blow up in upcoming times. Yet, more than 300 million Africans are expected to migrate to towns and built-up areas in the coming 2 decades [30]. Therefore, the need for milk related dairy items like cheese, yoghurt, ice cream along with many more will rise. While a better answer to milk production issues in the continent is overdue and must be found immediately [36,37,38,39,43]. Very little has been done in the literature using mix scale techniques of GIS and descriptive statistics to capture this issue spatially [44-48]. Accordingly, mix-scale model offers opportunities to assess the situation in Africa. For that, this enquiry will fill that void by assessing milk production trends in Africa with emphases on the issues, trends, factors, and future lines of action [49-52]. The paper has five objectives and sections. Of the five sections in the enquiry, parts one to three cover the introduction, methods, and results coupled with the factors, impacts, and current efforts. Sections four and five consists of the discussions and closure. The primary two objectives cover the current issues in milk and dairy use and to assess production capacity. The third and fourth aims, endeavours to assess the potentials and state of dairy products distribution and the regional snapshots across Africa. The last and fifth objective is to design a decision support tool for managers.
2. Methods and Materials
- The study area consists of 16 nations from Algeria, Benin, Nigeria, to South Africa and others (Fig 1). The area spans across the Lower West coastal Belt, along East, South, to the North on 9,668,375 km2 land area with a population of over 1.2 billion to 685 million in 2021 February (Table 1). [53]
|
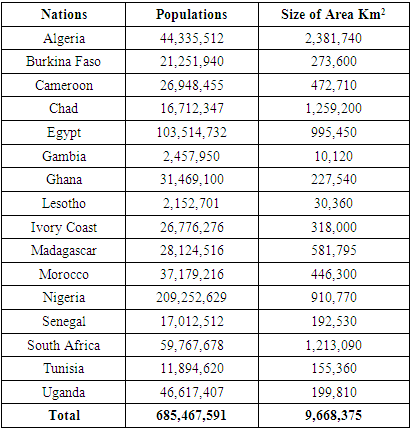
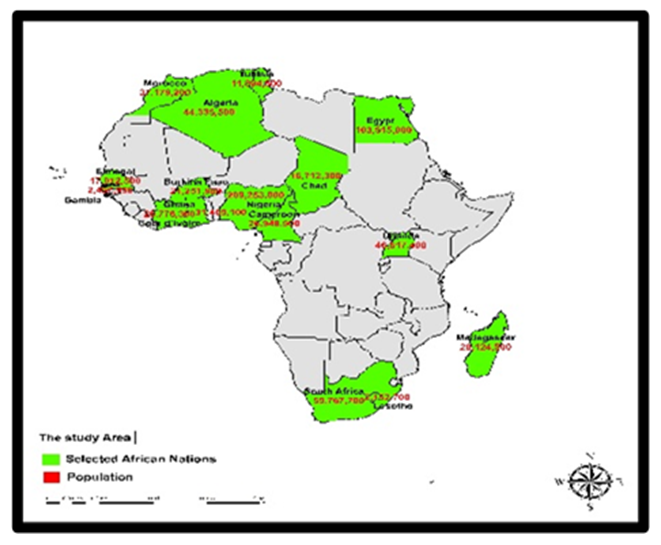 | Figure 1. The Study Area Africa |
2.1. Methods Used
- The paper uses a mix scale approach of descriptive statistics and secondary data connected to GIS. The spatial information for the research was obtained from various sources including the University of Maryland Online Data services, the African Development Bank (ADB), United Nation Economic Commission for Africa (ECA), the US Geological Survey (USGS), United Nations Food and Agricultural Organization, (FAO), and FAO’s Natural Resource online Spatial information and the World Health Organisation (WHO). Other sources consist of The International Farm Comparison Network (IFCN) and data bases like Statsista data Inc and KEOMA. This was pertinent in the procurement of time series and geo data on the global dairy trends and milk production costs for the periods of 1979-2015. Added that are the FAOSTAT food and diary info, Friesland Campina, Nestlé, Lactalis, Danone, Arla Foods and Sodiaal in Africa, Africa Milk, New Kenya Cooperative Creameries Ltd, the Eastern and Southern Africa Dairy Association and The European Union. The East Africa Dairy Regulatory Authorities Council (EADRAC), The Economic Community of West African States (ECOWAS) and Nigeria’s Federal Ministry of Agriculture and Rural Development (FMARD) were all instrumental in the provision of other relevant info pertaining to the contours of export and import index germane to the mapping and econometric information. Given that some of these entities furnished the dairy time series data and index for the periods of 2006-2018. The Federal geographic identifier codes for the nations and regions were used to geo-code the information contained in the data sets. This information was analysed with basic descriptive statistics, and GIS, with particular attention paid to temporal-spatial trends at the national and regional boundary levels. The relevant processes consist of two stages.
2.2. Stage 1: Identification of Variables, Data Gathering and Study Design
- The initial step in this research involved the identification of variables required to examine the extent of milk and dairy yield or production and changes at the continental, national level and regional from 2006 to 2021. The variables consist of socio-economic and environmental information of production volume of milk, ranking of top milk producing nations, production or output of the top producers, population, and area of the countries. The other indicators cover percentage changes in milk production, milk imports, volumes of processed milk, milk per capita consumption, milk consumption, and milk export. Notable among the variables are indices from GDP, cattle, total milk consumption per capita, milk animals per farm, dairy supply and demand, costs of milk production, milk farm types, milk demand and supply, averages, total, percentages of total, percentages of change, total milk production and milk production trends. Also note the presence of additional variables like spatial distribution of cow milk production, milk animals per farm, per capita milk availability, milk consumption per capita and divergence in supply and demand. These variables as mentioned earlier were derived from secondary sources made up of government documents, newsletters, and other documents from NGOs. This process was followed by the design of data matrices for socio-economic and land use (environmental) variables covering the periods from 2006 to 2007, 2010 to 2018 and 2020. The design of spatial data for the GIS analysis required the delineation of county, national and regional boundary lines within the study area as well. Given that the official boundary lines between the 16 nations remained the same, a common geographic identifier code was assigned to each of the area units for analytical coherency.
2.3. Stage 2: Spatial Data Analysis and GIS Mapping
- In the second stage, descriptive statistics and spatial analysis were employed to transform the original socio-economic and ecological data into relative measures (percentages, ratios and rates, averages). This process generated the parameters for establishing the extent of milk and dairy use, milk production trends, impacts and limiting factors, export and import, consumption, and the actual totals and the per capita, and the situation throughout the region among each of the 16 nations, using measurement and comparisons across time. While the spatial units of analysis consist of countries, region and the boundary and locations where milk imports, export and consumption and animal breading operations and the percentage and volumes of output and sizes of cows flourished. This approach allows for the detection of change, while the tables highlight the actual frequency and averages, impacts, demand and distribution, and regional distribution of the scope of production by country. The other use of the approach involves vivid display of the concentration of activities and the trends as well as the price of milk and related expenses in various places. The remaining steps involve spatial analysis and output (maps-tables-text) covering the study period, using Arc GIS 10.4 and SPSS 10.4. With spatial units of analysis covered in 16 nations (Figure 1), the study area map indicates boundary limits of the units and their geographic locations. The outputs for each country were not only mapped and compared across time, but the geo-graphic data for the units which covered boundaries, also includes ecological data of land cover files and paper and digital maps from early 2006-2018. This process helped show the spatial evolution of location of various activities and the trends, the ensuing environmental and economic effects, ecological degradation as well as changes in other variables and factors influencing milk production, use, changes, and impacts in the study area.
3. The Results
- This portion of the research stresses temporal and spatial analysis of milk use and production trends in the study area. Applying descriptive statistics there is an initial spotlight on the assessment of milk output trends and potentials in the continent at the regional and national levels, mainly on the present situation and comparative dimensions. The other parts cover the identification of percentage compositions, and inherent production changes over time together with the impact assessment of what transpired in the sector from both internal and external events. This is followed by the remaining segments of the section covering GIS mappings, and the major elements linked with the changes, the potentials, and downsides in Africa’s milk production activities. There is also a coverage of the initiatives among key stakeholders engaged in institutional responses to the sector’s needs.
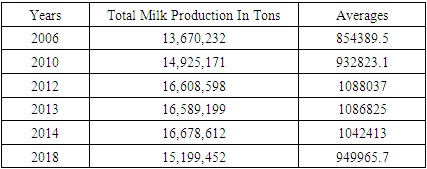
3.1. Africa’s Total Milk Production 2006-2018
- To further put the situation into perspective, despite the ongoing challenges in the continent, the total volume of milk output in the entire study area over the years grew into multiple surplus levels. This is evident from the 13,670,232 million tonnes to 14,925171 million tonnes during 2006 through 2010. The same trend continued with surges of over 16,000,000 million tonnes onto 2012, 2013 all through 2014. With that came a slight drop of 15,199452 million tonnes in 2018. Of great importance in the analysis, are the temporal display of both peak and lower points in production (Table 2).
|
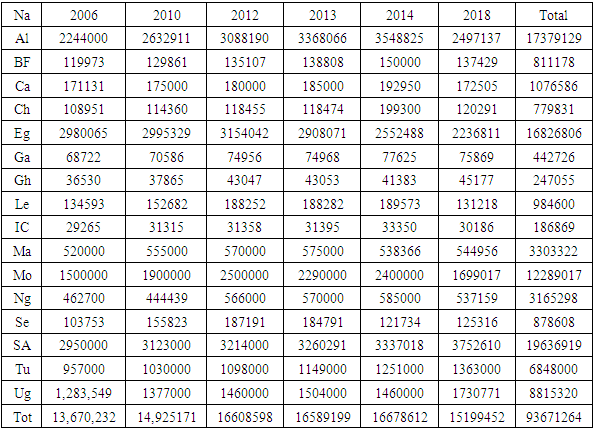
3.1.1. Milk Output at the National Level 2006-2012
- In the context of milk production trends in the study area over the years beginning in 2006. See that, of the total of 13,670232 tons of milk, a quintet of nations in the prime group led by South Africa, Egypt, Algeria, Morocco, and Uganda accounted for over 100,0000-200,000,00 tons of the produce. Thus, the temporal distribution of the product among these individual nations showed the total milk values of 2,950000 tonnes-2,980065 tonnes to 2,244000 tonnes-1,500000 tonnes and another 1,283,549 tonnes for South Africa, Egypt, Algeria, Morocco, and Uganda (Table 3).In the second-tier class of nations headlined by Tunisia, Madagascar, and Nigeria, the actual dairy or milk output in those places as captured in the under a million tonnes mark, ranges from 957,000, 520,000 to 462,700, respectively. This far exceeds the combined values of 400,055 tonnes, 269,110 for the other 7 nations in the continent (Burkina Faso, Cameroon, Chad, Gambia, Ghana, Lesotho, and Ivory Coast) as Senegal’s production level stood at 103,753 tonnes (Table 3).
|
3.1.2. Milk Production Capacity in Africa 2013-2018
- Towards the last three periods, 2013-2018, the five leading producers had combined for about 13,330,428, 13,298,331 to 11,916,346 tonnes in milk production during 2013, 2014, and 2018. This in turn culminated in a total of 38,545,105 tonnes. Looking further into the temporal profile of what transpired in the sector during the periods in question. Aside from the robust activities among the nations of South Africa and Alegria who consolidated their prime spots of 1 and 2 with 10,349,919-9,414,028 tonnes. The adjoining Middle East and North African nations of Egypt and Morocco on the 3rd and 4th spots in the ranking, held identical milk production values of 7,697,370- 6,389,017 tonnes, somewhat above Uganda’s total output of 4,694,771 tonnes in a spate of 5 years. In the next category of states consisting of Madagascar, Nigeria, Tunisia and Senegal, the total milk output therein reached similar levels of 2 million plus tonnes between 2013-2018 at overall estimate of 7,545322 tonnes. Note that Madagascar and Nigeria posted slightly equal values of 1,600,000 plus liters of milk compared to Senegal’s 431,841 tonnes. However, they remained below Tunisia’s total output of 3,763,000 tones for 2013-2018 (Table 3). Among the others, the temporal profile of the 3rd tier group of nations from Burkina Faso, Lesotho to the Ivory Coast. Note that these places saw their milk output vacillate notably by 779,980-884,181 to 712,675 tonnes at a combined total of 2,376,836 tones. Individually, the nations of Cameroon, Lesotho, Chad, and Burkina Faso had similar values (of half a million plus to 400,000 tonnes and above) in their production values far ahead of other nations in their production bracket (Table 3).
3.1.3. Regional Comparisons in Milk Output
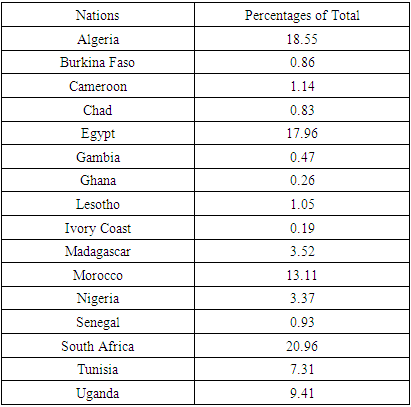
- In terms of the total milk output among the nations, South Africa, Algeria, Egypt, at 19,636,919, 17,379,129, 16,826,806 tonnes held on to the highest volumes between 2006-2018 while Morocco and Uganda stood firm on the remaining spots with 12,289,017 to 88,153,200 during the same periods. Considering such level of milk production activities among the big five nations in study area. Unsurprisingly, the remaining 11 nations during 2006-2018, and mostly in Sub Saharan Africa, were in no way a match for the leading milk producers in those periods fully dominated by the North African side of the continent (Table 3).
3.1.4. Percentages of Change and Percentage
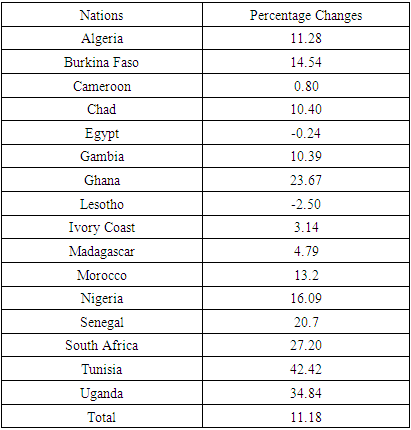
- When it comes to the percentage changes all through 2006-2018, the entire study area’s milk production rose by 11.18% except for Egypt and Lesotho who saw production declines of -0.24 to -2.50%, as the output surged to double digit levels in 10 of the 16 countries. Of these nations, Tunisia and Uganda posted the highest double-digit gains of 42.42-34.84% while South Africa, Ghana and Senegal saw similar growth levels of over 20 percentage points (Table 4).
|
|
3.2. Impact Assessment
- From the surge in milk and dairy production activities over the regions and the countries in the study area. There are a mix of impacts as manifested with many some upsides and downsides. While this is reflected at various levels pertaining to milk output and distribution in African nations. In that way, such themes like milk output and export surge, local ingenuity, and socio-economic effects have taken the center stage.
3.2.1. East Africa’s Milk Output Surge and Exports
- The evidence of the upsides, in milk production through output increments and internal fiscal impacts and exports are obvious. They have continued to reverberate in the region of East Africa through glowing wave of success stories in the sector despite other concerns. In the case of Uganda, where milk production and exports have tended to impress market observers and planners over the years. The nation’s Dairy Development Authority (DDA) shows, milk output rose by 2.08 billion litres in 2015 to about 2.5 billion litres in 2017/18. Of these, at least 80% of total milk produced therein is marketed and 20% consumed by the farming households, only 33% are processed while about 67% are marketed in their raw form. In as much as dairy exports reached US $60 million in 2016, the produce surged by US$ 130 million in 2017/18, as imports fell by US$ 5.4-5.2 million in the period. Note that the increases in net export stems from improved compliance by producers and the demands placed on them in meeting the standards set by Uganda’s regulators. The other reasons come from local and global markets where diary items are regularly traded. This is so, considering that much of the Uganda’s dairy exports mainly go to EAC, COMESA nations, SADC, UAE, Nigeria, Syria, Egypt, Omen, USA, Nepal, and Bangladesh. Regarding, Kenya’s, milk, and dairy trends, being a regional power, the nation not only stands out as the leading milk producer in East Africa. But dairy is the largest agricultural sub-sector in the country known for its income and employment creation capacity and yearly contribution to the overall GDP at 4%%. Because Kenya has 6.1 million dairy cows, producing about 607 kg/year/cow, and a total annual production value of around 3.7 million kg of milk. The sector as shown provides income and employment opportunities to over 1.5 million households across the dairy value chain.
3.2.2. West and South Africa’s Corporate Activities, Local Ingenuity and Primacy
- Along the other regions of the continent, both Nigeria and South Africa fully demonstrated the extent of their corporate ingenuity and production capacities relevant to the dairy sector in both places. For Nigeria, the corporate giant Friesland Campina WAMCO, one of Nigeria’s largest milk firms produces some of the most popular milk brands in the nation. In the process, for decades, the company, like many others across Africa, imports milk powder from Europe to meet its supply needs for local output. However, since 2011, the company noticed huge increases in the prices of dairy commodities on the world market. The increments, coincided with milk powder dumping due to rises in global demand for milk (especially from China), the proliferation of droughts, and the weakening of the Euro currency. Faced with this issue, Friesland Campina turned to local milk producers to reduce the quantity of imports and cut down on EU dependence. This ingenuity turned out well for the firm. Another major impact stems from the intensity of production which seems to have sparked the rally in the largest producer, South Africa. With the nation’s vast concentration of an average of 357 cows per herd, a feat reserved for only 13 countries globally who boast of an average of 100 or more. It is not surprising that Danone the leading provider of sour milk products, including yogurt therein, in South Africa dominates a market where about 42% of sales occur that way. Notwithstanding all that, South Africa now has a total cattle population of 14 million head ranked the 21st globally. All these enabled cows in the nation produce more milk seasonally, with 40% of more milk available between the months of September-November during the year.
3.2.3. Socio-Economic Effects: Market Distortions and Mass Protests
- Just like West Africa, where the cheap EU milk distorts the markets and impacts the region’s producers and processors, there are concerns in Kenya that the local producers risk similar same fate. Accordingly, the EU is exploiting the erratic production of milk in East Africa caused by volatile weather patterns to flood the region’s market with milk powder. In all these, while milk production in Kenya stands at 5.5 billion litres annually, in Tanzania the output reached about two billion litres. Yet, Tanzania has one of the lowest per capita milk consumption rates of 47 litres per annum compared to 120 litres per annum in Kenya and 54 litres in Uganda. Moreso, the unprecedented dumping of fat-filled milk powder therein has gone unabated. In 2018, the European Union exported 92,620 tons of milk powder to West Africa and 276,982 tons of fat-filled milk powder. This is an increase of 234% since 2008. Since fat-filled milk mixtures comprise of milk constituents and vegetable oils, such as palm oil to enrich them. This milk derivative sells 30% cheaper than the whole milk powder in African markets, generating unfair competition for African dairy farmers. Furthermore, the milk lookalike does not contain the same nutritional value as whole milk with regards to its fatty acids, minerals, and vitamin content. Because locals worry about the health impacts milk import could have on their community. They believe the flooding of schools with milk is very unhealthy for their children. Added to that are issues rooted in social and policy dimensions of the situation, unsustainability, and mass protests as manifested recently. Thus, in the face of trade imbalance and distortions associated with milk export and the damage done to the livelihood of African producers. Dairy farmers from Africa on April 10, 2019, protested outside the European Union (EU) headquarters in Brussels. These farmers covered thousands of kilometres to demand in the heart of Europe, that the EU ensure a sustainable production of milk in European states in way that would not destroy the African dairy industry. The protesting farmers from Burkina Faso, Mali, Niger, Algeria, etc, felt since EU provides indirect subsidy to export dairy products, there is an incentive to engage in over-production of milk in EU nations that is detrimental to African producers.
3.3. GIS Mapping and Spatial Analysis
- The GIS analysis consists of the visual display of spatial patterns underscoring the dimensions of milk and dairy production. This consists of the numerous indices of dairy products in the form of cost of milk, milk production and cow milk production and market flow synonymous with their volumes, capacity, and availability in the respective places as shown. From the depictions of the indices in space, the remaining milk variables products like cow milk production, milk consumption per capita, milk animals per farm, supply and demand of products and per capita availability saw ample display highlighting their potentials The info conveyed via geo-analytics on several scales and shades denote the potential lanes of the sector. The ability to pinpoint spatial-temporal dimensions of the capacity across sites using GIS as the investigative tool, is very vital in showing the state of milk and dairy production and the capacities in Africa markets despite the challenges. The GIS mappings of the trends indicates the dispersion of essential indices of milk production and usage tightly evident on various points as well as more spread onto various locations in the continent of Africa. Seeing the present tempo in the activities in study area, the dairy and milk indices production, consumption, and the actual capacities and weights and costs appeared visibly strong within the spots in the hubs where production remains viable and steady amidst consumption and distribution across time and space. Considering the sketchy nature of milk production costs and the spread along the different areas in 2012. The high costs of $US 50-60 per 100 Kg in yellow seems fairly felt on only 2 spots located within the upper Northwest side of the map, together with the $US 40-50 per kg in North and South African zones of the continent. In the same order, are the spatial flow of the lowest costs in dark and light green scales of $US 20-30 to $ US 0-20 in display along both the west and east central parts of Africa (Figure 2). In as much as the map pinpoints the presence of higher levels of cow milk production in 2010 more in the horn of Africa, Northeast Africa, and lower South Africa, depicted in dark and light blue and light green colors (Figure 3). Similar patterns held firm under the red and pink spots of the map (Figure 4).
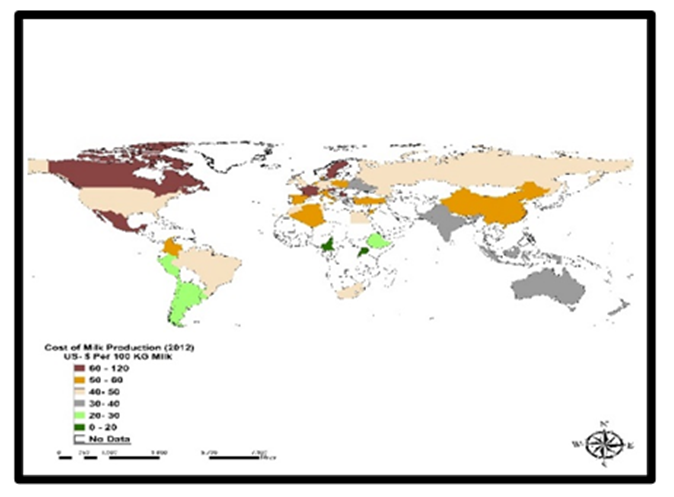 | Figure 2. Cost of Milk Production, 2012 |
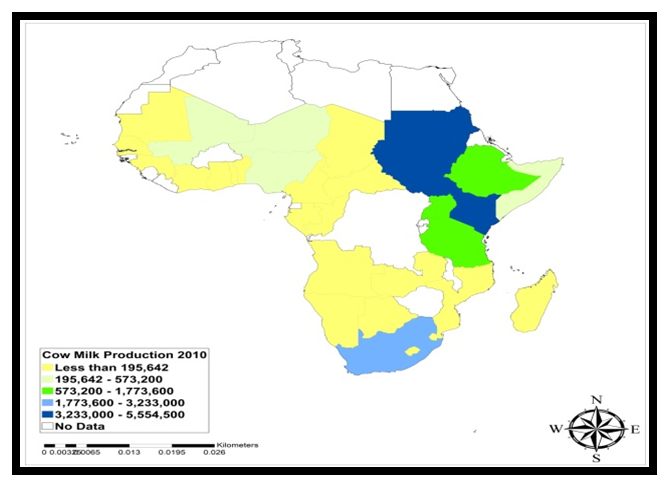 | Figure 3. Cow Milk Production, 2010 |
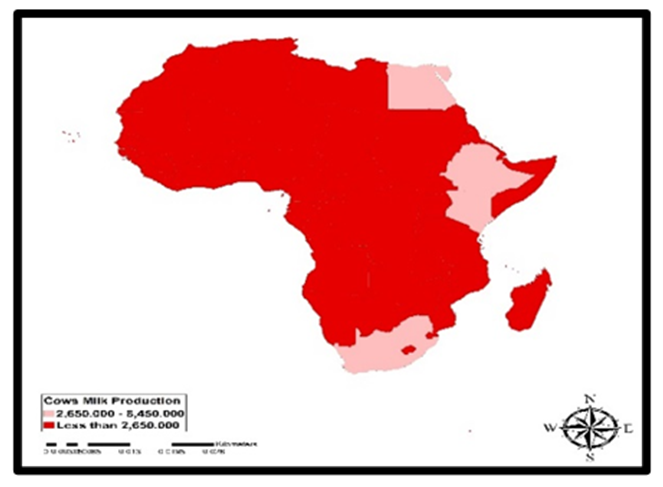 | Figure 4. Cows Milk Production Volume |
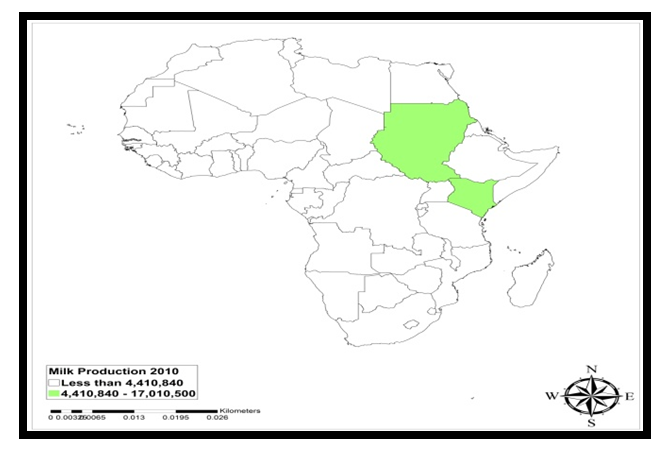 | Figure 5. Milk Production, 2010 |
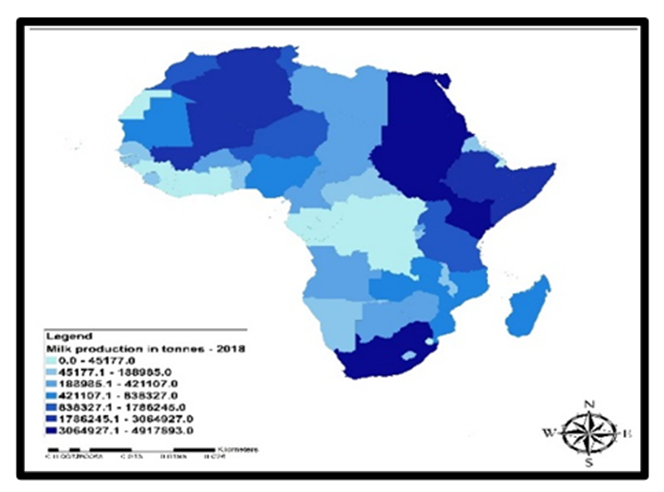 | Figure 6. Milk Production, 2018 |
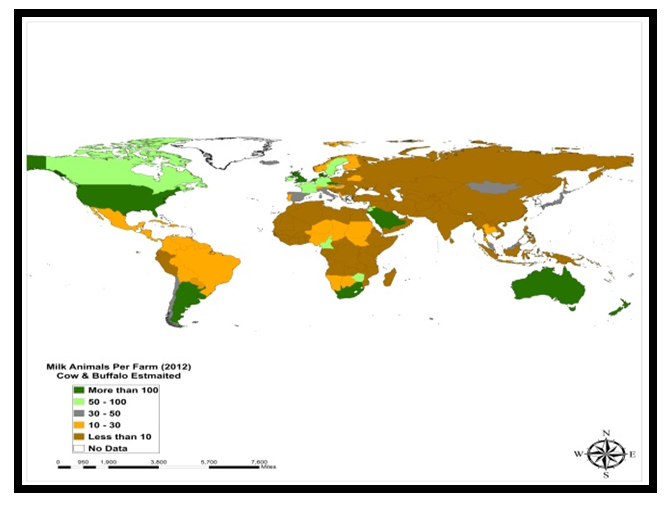 | Figure 7. Milk Animals Per Farm, 2012 |
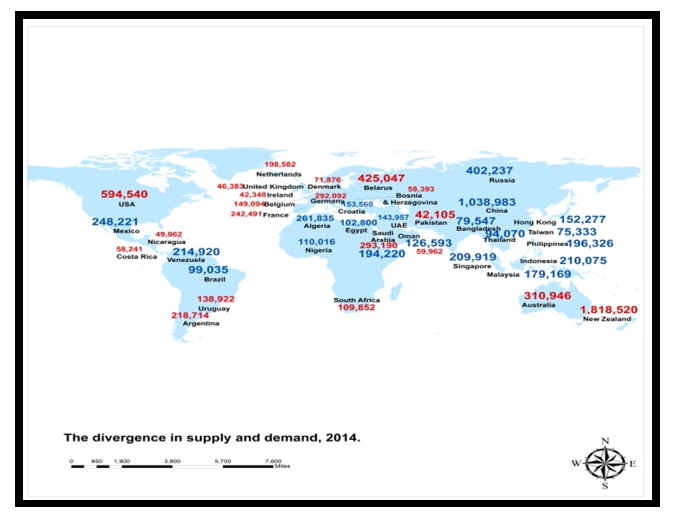 | Figure 8. Spatial Distribution of Supply and Demand, 2014 |
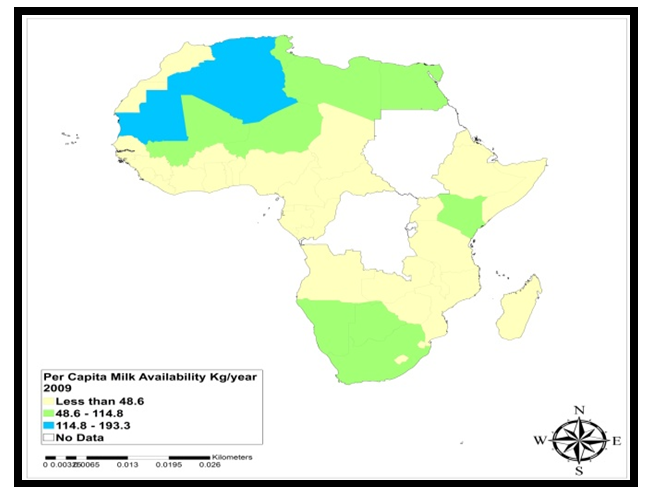 | Figure 9. Spatial distribution of Per capita Milk Availability |
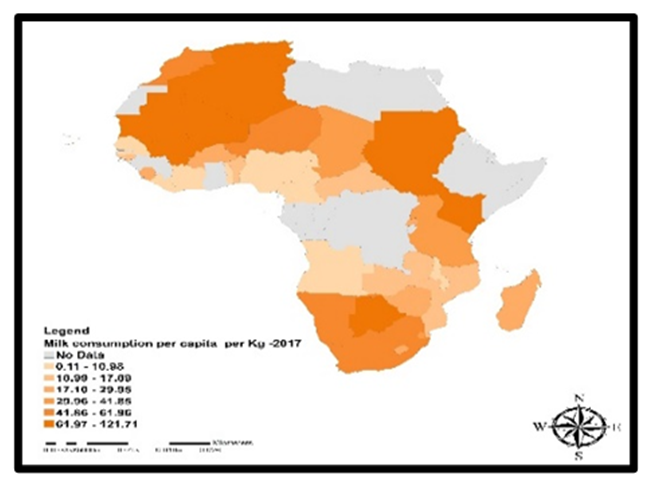 | Figure 10. Milk Consumption Per Capita, 2017 |
3.4. Factors Responsible for Changes in Milk Output
- The are many essential factors that fuelled changes in milk production over the years in the African continent. Just as these forces mirror consumption, output volumes and the demands. From what transpired, the changes do not materialize in isolation. They are associated with various policy, socio-economic, and physical factors. These elements are described below one after the other.
3.4.1. Economic, Policy, and Global Elements
- The astute tenor of foreign investment strategies and policy went a long way in impeding the interests of African producers. Out of that, current analysis shows that while Africa saw only 3 major deals by EU firms in the dairy industry before the global milk crisis of 2015. After the crunch, the EU market confidence on the investment climate grew to 14 new dairy deals in the process. Because Africa has long been on the EU radar for its dairy market due to rising population and income growth. As a result, 2 EU multinationals, (Danone/Arla Foods) earned billions from deals amidst global price crises. In taking advantage of the market environment, the EU whose exports account for a large chunk of the West African market, especially for milk powders jumped into East Africa. While this is so in Tanzania and Kenya, the EU saw a market among African companies in need of fat-filled milk powder. Thus, between January and November 2017, when EU processors exported 3,837 tonnes of skimmed milk powder (SMP) to Kenya, Nigeria stood out as the biggest market in sub-Saharan Africa at 23,677 tonnes followed by Ghana at 9,475 tonnes. Elsewhere in Tanzania, given the loopholes, the EU exported 6,525 tonnes, into a nation that is a net importer of dairy products as South Africa held a tight grip on its own side of the market. Surely, all these affected local outputs and the eventual changes as well.
3.4.2. Socio-Demographic, Planning and Development
- The socio-demographic limitations are obvious in the study area. In addition to that, the lack of economic development and institutional capacity made the situation more challenging. Significantly, climate variability will have a serious effect on pastoralists, whose livelihood depends upon livestock for food, economic security, cultural preservation in the wake of land use conflicts triggered by their practices. Even at that, the issue of changes in the marketing and pricing of commodities brought about by fluctuations, remains of paramount importance. Moreso, rapid urbanization, and population surge implies that the addition of hundreds of millions of new folks into cities in the next 2 decades will likely drive-up the demands and costs. Additionally, the unprecedented growth of the middle class and increased awareness by consumers on milk quality and safety have cumulatively expanded the market for quality and safe milk products. While African farmers lack facilities to transport their milk to urban areas, where people have better purchasing power. The milk firms in the EU nations take advantage of such amenities and opportunity to market their products. Accordingly, the limited quality of storage infrastructure vital in preserving milk and dairy products under the right conditions for supply adds to the strain. With recurrent power outages affecting dairy firms’ capacity. Meeting quality control thresholds in an already volatile market, shaped by EU competition, pushes informal African producers to the brink.
3.4.3. Ecological and Physical Forces
- As part of the limiting effects in the face of changing environments and their role. Unfortunately, in many parts of Sub-Saharan Africa, milk production is highly dependent on rain-grown fodder (grass) which is threatened by erratic precipitations patterns in some places. As a result, the market experiences sharp fluctuations in milk production and supply throughout the year due to forces beyond the control of producers in the zone. In that way, surplus milk is often produced during the rainy season while in the dry seasons, milk production can be very low and limited in supply. Since impediment to watering can be an issue. There exists a whole set of critical environmental conservation measures and forces vital to the sector. Under limiting physical elements, production activities in milk farming are vulnerable to climate change. Whereas this occurs through increased temperatures and changes in rainfall patterns. Africa’s livestock sector remains at risk of climate change and this in turn affects the volume of milk output.
3.5. Efforts and Initiatives
- From the state of Africa’s dairy sector, the potentials, and the inherent trends together with the mixed profile regarding the upsides and downsides. The place of milk and dairy production in the continent and the EU dumping practices has sparked notable responses among stakeholders linked to the sector to turn things around. Accordingly, actions are being taken by government entities and other actors in the industry to address the gains and ensuing leakages and sustain the industry in Africa.
3.5.1. Institutional Efforts
- Members of the EU, the West African governments and private companies have all taken actions to support the local dairy market. Among them, Vétérinaires Sans Frontières is a Belgian NGO supporting agriculture and breeding in eight African countries. It has involved itself in helping farmers improve all stages of production including livestock feed, herd health and animal hygiene, milk collection and processing as well as marketing for their products. Also, Fairebel, a Belgian milk brand, created the “advocacy brand” Fairefaso that partnered with local milk producers in Burkina Faso to support small-scale local farmers by helping them maximize sales and profits. On its part, the ECOWAS, has initiated a regional offensive intended to increase the production and collection of fresh milk. Drawing on cooperation from EU Producers and institutional support, change is forthcoming for African livestock keepers. With increased funding and new import regulations, projections have determined that dairy production in Africa will continue growing to meet the needs of local communities and beyond. For that, Uganda invested in increasing milk output reducing post-harvest milk losses through rehabilitation of Milk Collection Centers (MCC’s). Elsewhere, Friesland Campina WAMCO, in Nigeria built milk collection points in various regions of the country. Through that scheme, small-scale milk suppliers, supply fresh milk to these collection centers every day in 10-litre buckets provided by the company in place of the traditional calabashes which often contaminate the milk. These centers are equipped with cooling facilities from where the company collects the milk in vehicles installed with cooling equipment and transports, to its main factories for commercial milk production. As a result, the firm has cut down on its raw milk and powder milk imports from Europe.
4. Discussion
- The relevance of milk intake in a continent like Africa can no longer be over emphasized considering its essence in the daily nutritional intakes of the populace and their economic welfare. Yet, despite having 10% of the cattle in the globe, Africa’s output of only less than 3% still lags other continents in milk production. Appropriately, the paper emphasized the extent of milk production in Africa by examining the activities in the dairy sector. This entailed coverage of usage over time under various indicators across nations in the continent. With that came synopsis of the scope of changes in the form of gains and declines in the context of dairy output among the producing countries and emergent concerns like the ratio of regional disparities in milk production and the sequence of higher concentration in some countries than the others. For that, the other important component of the enquiry consists of the delineation of the linkages between milk consumption, production levels, self-sufficiency in dairy, imports, and socio-economic, environmental elements. Considering that some of these elements negatively influence milk production and the capacity of dairy farms in the continent to thrive amidst market uncertainty. The study also presented regional impact analysis indicative of the trends and the dilemmas in milk production from East to West and Southern Africa. Consequently, production of milk has not kept pace with demands as Africa’s average annual intake of 36kg for every individual fall below the global average of 103kg. As if Africa has not had enough, she continues to be burdened by internal limitations forcing local dairy framers into needless competition from low-cost milk items dumped therein from the E.U. Such coordinated unfair trade practice allowing EU milk is very damaging and has risen so much that imported milk, now looms larger over the market in Africa. As Africa expends more than half a $ billion on imports and its local farmers languishing, yearly milk demand outpaces local production in Nigeria. With such policy flaws hindering the capacity of marginal farms to thrive, the industry is besieged by climate risks in arid areas for herds grazing, due to 25% drop in rainfall in 5 decades. But this mixed profile should not diminish local potentials of the sector. From the results of the enquiry, the state of milk production and consumption in the continent of Africa seems somewhat satisfactory with promise and more rooms for improvement. However, given the potentials in the continent and numerous opportunities awaiting to be tapped into, it is not enough considering the disparate regional concentration. Even though this is not really where most producers and observers in the continent would want to be. The analysis under the mix scale model shows rising output, and changes in production among the countries. From the percentage levels in distribution, there were also gains and declines as well as regional disparities synonymous with current challenges facing the continent’s diary sector. To measure the extent of milk use, output, variations, and evolution in the primary diary indicators. The paper adopted mix-scale techniques of descriptive statistics and GIS with secondary data under groups of socio-economic, physical, ecological, and demographic indicators from percentage of change in milk production, to regional and national milk production percentages. Among the most interesting inferences in the study. Note that despite the superb rallies in total production by 2006-2018 in a quartet of leading milk producers (South Africa, Algeria, Egypt, and Morocco). The second-tier nations of Uganda, Tunisia, Madagascar, and Nigeria held their own. While GIS mappings revealed gradual dispersion of production indices across space, the changing patterns in milk production and usage did not occur in vacuum. They originated from various policy, socio-economic, demographic, environmental and tech elements situated in the bigger farm structure. To address the concerns, the paper proffered solutions ranging from education on milk intake among the public, efficient policy, monetary assistance to local producers, closure of dumping loopholes, periodic monitoring, and the design of regional and continental dairy management information system.
5. Conclusions
- This study focused on the analysis of milk production trends and potentials in terms of quantities and the impacts on the sector across various nations in Africa from North, West, East and South African region with vital outcomes listed under the following headings: a) mix scale methods effective; b) changes prompted by various factors; c) deficits and gaps evident; d) milk production and potentials rising; e) impacts exist.In underscoring the scope of milk production and usage in nations of Africa and regions from 2006 and 2018, mix-scale methodology showed various dimensions not completely applied previously by planners. The uses of descriptive statistics in the model, exhibited glimmers of originality in the capability of the system to pinpoint the strength of the tool on regions actively involved in robust production. The same analytical promise holds in nations that saw a mix of gains and declines coupled with the risks posed by multiplicity of limiting stressors. Understanding the degree to which GIS mappings detected the structure of milk production costs, cow milk production, also required the notations of the concrete spread involving usage, milk production trends, milk animal per farm and milk consumption per capita and trends, and the demand and supply patterns. The temporal profile of these indicators using descriptive statistics provided snapshots of milk production outlooks as manifested across the regions in terms of total production, percentages, and the average percentages of change. Through that mode, managers are better equipped in designing feasible strategies suited for dealing with emerging eventualities. From those settings both researchers, farmers, and investors, decision makers and the customers have within reach critical info upon which to evaluate opportunities and risks posed to the dairy industry as a step towards wise use in localities hard pressed by the challenges. The changes in milk production and usage came from a host of socio-economic and ecological forces. This involves ineffective policy, growing population shifts (demography) and irregular precipitation and climate change risks. Considering the common ecological and physical constraints impeding output. In much of Sub-Saharan Africa, milk farms rely on rain-grown fodder (grass) whose moisture content remain affected by irregular rainfall in certain areas amidst the dry-wet season interface. In the process, the market faces strong fluctuations in milk output beginning with shortfalls in the dry periods and surpluses in the wet season. With the dairy farms now susceptible to climate change. The ensuing stressors in the form of recurrent natural disasters, variations in temperature and shrinking pastures and water deficits and disease outbreaks usually rank high amongst some of the factors limiting milk production as well. On the socio-demographic front, the entrenchment of underdevelopment, land use conflicts and population surge are huge concerns. Of great importance is the looming pressures from rapid population growth and the anticipated migration of hundreds of millions of new residents into cities across African, low productivity among farms, poor infrastructure, and the inability to meet rising demands for milk products among consumers. Furthermore, the astute investment strategies out of the EU undercuts the interests of African producers in ways that stifle local output. By identifying these indices, the enquiry inserted new factors essential to managers in tracking forces shaping milk output in Africa.From the analysis, milk production among the countries remains riddled by visible gaps. Such shortfalls are manifested in the poor showing of Africa in global rankings pertaining to comparisons with other continents. However, despite Africa’s size and the availability of tens of millions of livestock, the continent remains behind others as it languishes under single digit values in global ordinal rankings of producers. With this has come very poor per capita availability ratio in 2009 dispersed across space among the countries. Such exposure to deficits really translates into limited intake in a part of the world with lowest median age group where regular usage ought to be daily focus. Accordingly, the continent faces an uphill task on multiple fronts that are global, regional, and local in scope. This not only creates a situation where local production size still cannot fulfill the needs of dairy consumers. But the production declines of -0.24 to -2.50% for Egypt and Lesotho during the same periods are indicative of the trends. By identifying the scope of these shortfalls, the enquiry provided a model for the continent to build on as the respective regions and nations confront these challenges by crafting better plans for improvement.With the projected household income growth in the continent taking shape and numerous people now in the middle class. The necessities of milk use have added to a major jump to the potentials of the sector where product orders in 2018 resulted in the delivery of about 2.6 -2.57 million tonnes (MT) of skim milk powder and cheese. The other ways to see the potentials further despite production issues, stems from the state of total volume of milk output over the years, which rose to excess quantities coupled with the presence of tens of millions of cattle in Africa. Furthermore, by 2006-2018, milk output increased by 11.18% of which 10 of 16 nations experienced double digits gains. Among them, two nations (Tunisia and Uganda) in separate regions of the continent saw the biggest increases at double digit rates of over 40 to 30% plus, while another trio mostly in the SSA (South Africa, Ghana, and Senegal) experienced identical surges at more than over 20% respectively. In all these cases pertaining to potentials and production, despite the dominance of North African, one cannot ignore the turnarounds as East Africa where Uganda stayed overly impressive in ways that surprised market experts in 2015 to 2017/18. In all these, the study area did show some turnarounds in dairy production vital in food security. Constructing dairy index of this dimension in the study as analytical tool, improves the capacity of managers to monitor production levels over time. This will keep various actors including investors, industry and governments informed about shifts and trends in the sector in case uncertainty emerges.Building on the results of this study, the paper documented the visible impacts. Clearly, current production systems even though rosy, seems to augment the over concentration of production capacity in just a few places which often translates into ample regional disparities. This then creates dairy and milk insecurity manifested by limited access and low intake among citizens at levels below the other continents. The bleak pictures so far have not stopped the economic and fiscal upturn given the turnarounds in the East African region involving Kenya, the regional powerhouse. Out of necessity, Nigerian producer Friesland Campina had no choice but invoke the virtues of inward looking local corporate ingenuity, in a sharp turn towards indigenous supplies to curb EU imports. With the downsides of the impacts punctuated with market distortion, low production, meagre intake, and the dumping of fat filled foreign milk. The damage done to sustainable milk production remains obvious as African producers vented their frustration through protests in the EU. Still, in 2018, the EU dumped over 90,000-200,000 plus tons of milk powder and fat filled powder to West Africa at a rate of over 200% since 2008. This created notable worries among citizens over the effects on their health and the safety of school children given the fatty contents. Having seen the imbalance and distortions linked to milk export and the threats to their welfare. Uncovering these risks given the gravity in terms of milk deficits, regional disparity, low productivity and unfair practices, deliberate dumping, and the threat to local farmers in the paper, remains vital in the push towards food security. Considering the consumption levels, volumes in milk production and the challenges encountered in the past years, and the concerns raised over the shortfalls in output and intake as indicated in this enquiry. Planners and researchers will be required to elicit crucial answers to several queries that are essential to milk production and dairy. The questions are as follows: How would future consumption levels influence milk production? What are the implications of existing production disparities among regions in the continent? How will changing climate shape dairy and milk production? How will the current growth levels in some places impact future decisions and strategies in the study area towards access? How will the nations in various regions address the mounting problems of milk dumping and market distortion from the EU? From these questions, full opportunities exist for rigorous enquiry and practice to enhance the focus on sustainable milk and dairy use and production.