E. C. Merem 1, Y. A. Twumasi 2, J. Wesley 1, D. Olagbegi 1, M. Crisler 1, C. Romorno 1, M. Alsarari 1, P. Isokpehi 1, M. Alrefai 1, S. Ochai 3, E. Nwagboso 4, S. Fageir 5, S. Leggett 6
1Department of Urban and Regional Planning, Jackson State University, 101 Capitol Center, Jackson, MS, USA
2Department of Urban Forestry and Natural Resources, Southern University, Baton Rouge, LA, USA
3African Development Bank, AfDB, 101 BP 1387 Avenue Joseph Anoma, Abidjan, AB 1, Ivory Coast
4Department of Political Science, Jackson State University, 1400 John R. Lynch Street, Jackson, MS, USA
5Department of Criminal Justice and Sociology, Jackson State University, 1400 John R. Lynch Street, Jackson, MS, USA
6Department of Behavioral and Environmental Health, Jackson State University, 350 Woodrow Wilson, Jackson, MS, USA
Correspondence to: E. C. Merem , Department of Urban and Regional Planning, Jackson State University, 101 Capitol Center, Jackson, MS, USA.
| Email: |  |
Copyright © 2021 The Author(s). Published by Scientific & Academic Publishing.
This work is licensed under the Creative Commons Attribution International License (CC BY).
http://creativecommons.org/licenses/by/4.0/

Abstract
GMO farming practices continue to be at the center of debates surrounding food production and varying debates on policy guiding US agriculture. On the one hand, many see the emergence of GMOs food in farming as a testament to the latest advances in technological innovations. On the other, there are those concerned about the threats posed to food safety and quality. Aside from that, in the last several years, the influence of GMOs in farming areas of the nation has gained widespread currency with applications in nutrient sprays, and the proliferation of bioengineered crops (soya bean, corn) with herbicide resistant traits and the capacity to endure weedkiller treatments that could have ruined the produces. With that came the adoption of herbicide resistant crops in which crops inserted with insect resistant traits are now vastly cultivated in areas across the country, especially the Mid-West region. Seeing the pros and cons surrounding GMOs in food production, very little exists on the issues and the areas devoted to it during production, the land use aspects, the regulatory dimensions, and distribution patterns. In view of the widespread usage of GMOs in agriculture and the dichotomy over the adoption of bioengineered alimentation in the agricultural sector. This paper will fill that void in research by assessing the adoption of GMO food production in the US Midwest with emphasis on the issues, trends, production, and land use interactions, and factors under mix scale methods based on the techniques of Geographic Information Systems (GIS), and descriptive statistics. In applying the model, results point to rising changes in the proportion of areas devoted to GMO food production, concerns over the impacts, and growth in the adoption of core bio engineered crops. With all these attributed to socio-economic and ecological factors, GIS mappings of the trends, pinpointed the gradual dispersion of various indicators clustered across GMO food producing areas within the Midwest region. To remedy the concerns and the divergent positions on GMOs in US agriculture, the paper recommends education, effective policy, transparency and dialogue among opposing views and the recourse to ethical guidelines regarding the production of bioengineered food.
Keywords:
GMOs, Agriculture, GIS, Midwest Region, Food Production, Impacts, Changes
Cite this paper: E. C. Merem , Y. A. Twumasi , J. Wesley , D. Olagbegi , M. Crisler , C. Romorno , M. Alsarari , P. Isokpehi , M. Alrefai , S. Ochai , E. Nwagboso , S. Fageir , S. Leggett , Analyzing the Use of Genetic Modified Organisms (GMOs) in Agriculture in the US Midwest Region, Food and Public Health, Vol. 11 No. 1, 2021, pp. 1-17. doi: 10.5923/j.fph.20211101.01.
1. Introduction
In a world fraught with uncertainties regarding access in which some still struggle to put food on the table given the proliferation of food banks serving needy citizens. The issue of food security and rising scarcity has catapulted the GMO debate into arena of public policy in a manner not seen before [1]. Accordingly, in the context of this study, the World Health Organization (WHO) defines genetically modified organisms (GMOs) in food as “organisms in which the genetic material (DNA) has been altered in a way that does not occur naturally.” As an option to the lengthy periods of rearing flora or faunal species under the conventional pathway, the invention of GMOs in agriculture accelerated the anticipated outcome [2]. Accordingly, GMO farming practices continue to be at the center of debates surrounding food production and discussions on policy guiding US agriculture [3]. On the one hand, many see the ascension of GMOs food in farming as a testament to the latest advances in tech innovations [4,5,6,7,8]. On the other, there are those afraid about the threats posed to food safety due to reservations over quality, non-disclosure, and reluctance towards labelling [9-15]. Yet, research indicates that over 90% of Americans show interest in being informed of the Genetically Engineered (GE) content of food intake despite the slow adoption of labelling across the country [16]. While over time, society witnessed a gradual surge in state laws. In 2016, the US Food and Drug Administration (FDA) lifted a moratorium on the importation of GM salmon eggs destined to a food company in Indiana [17].Aside from that, in the last several years, the influence of GMOs in farming areas of the nation has gained widespread currency [18,19]. This came with applications in nutrient sprays, and the proliferation of bioengineered crops (soya bean, corn) with herbicide resistant traits and the capacity to endure the herbicide treatments that could have ruined the produces [20]. In other words, GMOs emerged initially in the middle of 1990s with the intent of common good while those in research discovered the modes to alter rice structure genetically to endure heavy rainstorms in Eastern India [21]. Instead of sustaining huge losses in crop acreages, the transformed rice withstood the harsh settings and ensured food access to needy citizens. In the process, endless promises like gold rice, emerged since then as a variety and forebear of vitamin A in cooked portions of rice and a widely sought remedy in the fight against impaired vision in the Third World [22].Seeing that the recurse to GMO farming today knows no geographic boundary, the situation in the US Midwest region as a major agricultural hub globally merits attention [23,24]. In that case, during the last several years, the advent of GMOs has pushed through the pastures and farmhouses of the US [25] and the Midwest, changing the modalities of farm business. With such a trend driving the mechanization of farming, GMOs have forced the ethos of agriculture to novel path given the approval of GE crops for growing in the US since the 1990s [26,27,28]. As a result, today, there are 10 GMO crops currently produced in the US, while more than 120 GM seeds with unique traits have been deregulated. Also, over 90% of corn, soybean, cotton, canola, and sugar beet acreage in the US stems from GMO [29]. Against that background, despite the benefits in farms to enhance quality and reliability of the food, and supply since the mid-1990s, the release of GMOs into the environment and the marketing of foods derived from GM crops has triggered debates. Although public concerns have risen on environmental and food safety of GM crops [30], debates over the genetic alteration of food sources are widespread with legislations to inform consumers if food products contain GMO [31,32,33]. But after 2 decades of using genetically modified crops, US farmers are continuing to see an array of benefits [34,35].In the past two decades, GMOs have rapidly risen to comprise 88%, 94% and 93% of total corn, cotton, and soybean crops grown in the US in 2012 [36]. In that case, GMO supporters point to evidence that the technique must be deemed vital for promoting sustainable agriculture [37], as they can limit agriculture’s ecological footprint, reducing the use of pesticides and saving fossil fuel use. Seeing how proponents consider GM crops crucial in facing the challenges of food and nutrition security problem in the 3rd World. The increased knowledge of plant and animal genetics led to the practice becoming more sophisticated, allowing farmers and scientists to precisely select the desired traits. Besides that, experts also began creating new crop hybrids in laboratories and applying chemicals and radiation to induce desired changes in plants' genetic makeup [38,39,40]. These efforts have led to a variety of new crops [41,42], including rice cultivars that are resistant to drought and high yielding wheat cultivars, yet these potentials seem overlooked in the literature. See Appendix A-B. With that came the adoption of herbicide resistant crops in which seeds inserted with insect resistant traits are now vastly cultivated in areas across the US, especially the Mid-West [43,44]. Seeing the pros and cons surrounding GMOs in food production [45], very little exists on the issues and the areas devoted to it during production, land use aspects, the regulatory dimensions as well as distribution patterns [46,47]. In view of the widespread usage of GMOs in farms and the dichotomy over the adoption in the sector and existing gaps, this enquiry assesses the adoption of GMOs in farming in the Midwest via mix-scale model [48,49,50]. Undertaking a regional assessment of GMO food farms offers us a preamble to unlocking the capacity therein with emphasis on the issues, trends, production, and land use, impacts and factors under mix scale techniques of GIS and descriptive statistics. The research has four objectives beginning with the need to explore current issues in GMO farming, and the assessment of the status of GE agriculture in the Midwest. The other three consists of change analysis in GE farm parameters and to identify factors driving the rise and to design a decision support device for managers. The organization covers five parts made up of the introduction, methods and the results as highlighted in sections 1 to 3. This is followed by the discussions and the conclusion under sections 4 and 5.
2. Methods and Materials
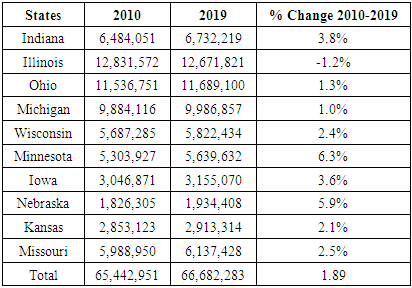
The study area stretches over 10 states made up of Illinois, Indiana, Iowa, Kansas, Michigan, Minnesota, Missouri, Nebraska, Ohio, and Wisconsin (Figure 1). Between 2010 through 2013 the population of the zone changed from 65,442,951 to 66,682,283 million at a rate of 1.89% (Table 1). Located along the middle of continental USA, the size of region extends through 1,014,542.33 square miles area from Northern Missouri to Southern Ohio [51]. The region’s vast swaths of open farm fields reflect its designation as a major and vibrant agricultural hub in the nation. Among the states in the zone, about 8 of them (Illinois, Indiana, Iowa, Michigan, Minnesota, Missouri, Ohio, and Wisconsin) usually referred to as the “Corn Belt” are very active in the sector [52]. Nonetheless, this area provides opportunities for a wide range of farming not limited to corn and soybean. Accordingly, the US Midwest region stands among the most heavily farmed places in the globe and regularly impacts international capital flow and transactions. During the fiscal year 2007, the states in the study area posted a tradable farm commodity price estimated at more than $76 billion in deals covering corn, soybean, livestock, vegetables, fruits, and related produces. Also, out of the region’s 127 million acres in agricultural land, ¾ (75%) of the land mass are devoted to corn and soybeans, with the remaining 25% tied up towards the production of various fruits from grapes to potatoes [53]. Being an area rich in fertile soils and fully endowed in natural substances and nitrogen, the landscape is comparatively flat. While the long humid evenings, warm daylight hours, and balanced and regular precipitation patterns in the zone all through the farming season, provides perfect surroundings for corn production. Most of the farms in the region are usually household operations at average sizes of over 300 acres (120 hectares).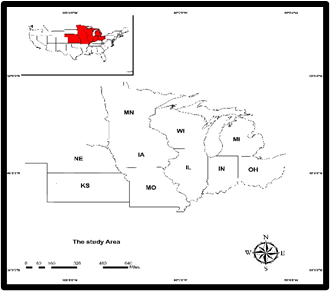 | Figure 1. The Study Area US Midwest Region |
Table 1. Population Trends In the Study Area -Mid-West 2010-2019
 |
| |
|
Under such conducive ecosystem for farming, the proportion of areas devoted to GMO food production in various varieties like corm, soya bean, and others reached unprecedented levels amidst the biggest rallies from the year 2000 to 2018. Aside from the rich environmental features of sensitive wetlands, fish and wildlife streams and lakes, the Midwest region boasts of abundant biodiversity and vibrant ecosystems germane to GE food output. The high adoption rates of GMO food cultivation in large farm fields in the leading states like Missouri, Iowa, Nebraska, and Kansas seems spurred partly by advances in science, policy and the environment that has helped farmers and the region carve out a niche in the sector amidst rising demands [54]. Such unparalleled expansion using genetically modified organisms in the farm seeds planted in agricultural land areas across the Midwest region can be buttressed by the surge in the proportion of the core indicators. Thus, the Mid west saw a spike in regional average of 13.6% to 15.42% in areas planted with herbicide tolerant corn and GE corn varieties from 2000 to 2018 in line with recurrent increases since the 1990s [54]. Given these variabilities, the US Midwestern zone remains the frontier of GMO food production built on the potentials, open farm fields, and an enabling setting that outweighs some of the lingering doubts about the sector. Analyzing these trends through mix scale model provides ample opportunities for research in the study area.
2.1. Methods Used
The paper uses a mix scale approach involving descriptive statistics and secondary data connected to GIS to analyse the rising progression of genetically modified Organisms farming trends within some selected states of the US Mid-Western region from the Corn Belt zone of Nebraska -Kansas to the Michigan and Ohio axis in the industrial Midwest along the heartland. The spatial information for the study was obtained through numerous organizations consisting of the United States Geological Survey (USGS), the United States Department of Agriculture (USDA), The US Food and Drug Administration (FDA), the University of California and the National Conference of State Legislatures and the USDA Economic Research Service (ERS). Other sources of spatial info emanates from the United Nations Food and Agriculture Organization (FAO) and Bio High breed international and center for food safety and The US Environmental Protection Agency (EPA), US Fishery and Wildlife Service, US Fish and Wildlife Society. In addition to that, the USDA National Agricultural statistics Service (NASS), the Pew Research Center, National Academy of Sciences, The American Association for the Advancement of Science, the European Commission, US Congress, the various states Departments of Agriculture, the Stanford Law School Center for Law, and the Biosciences and Cornell University also offered other information required in the research. Generally, the bulk of genetically modified organism’s food indicators germane to the region and individual states emanated from the state archives from Wisconsin to Kansas and Michigan to Nebraska, and the USDA Animal and Health Inspection Service, National Corn Growers Association, Agri-Pulse, Center for Science in the Public Interest, Grocery Manufacturers Association and USDA’s Agricultural Marketing Service, for some of the years. At the same time, critical insights on the relevant data also came from the World Health Organization, the FAO, the Department of Health and Human Services, The American Farm Bureau Federation and Environmental Working Group. On the one hand, the Sustainable Food Policy Alliance, New Mexico state University agricultural extension services, Organization for Economic Cooperation and Development (OECD), US Biotech Alliance, of the National Sustainable Agriculture Coalition (NSAC) and Michigan State University ushered in valuable perspectives on the path towards the data search. On the other, the USDA NASS and USDA Economic Research Service (ERS) provided the relevant time series and secondary data on the percentages of agricultural land area covered by GMOs. For additional data needs, the Washington State University, the International Service for the Acquisition of Agri-Biotech Applications, and the US Census Bureau were respectively essential in the procurement of information on the critical information highlighting the extent, and various dimensions of GMO farming activities and population changes. Given that regional and federal geographic identifier codes of the states were used to geo-code the info contained in the data sets. This information was processed and analyzed with basic descriptive statistics, and GIS with attention paid to the temporal-spatial trends at the county, state, and regional levels in the US Mid-Western region. The relevant procedures consist of two stages listed below.
2.2. Stage 1: Identification of Variables, Data Gathering and Study Design
The preliminary step in this research involved the identification of variables required to analyze the extent of harvest or production and changes at the national, state and regional level from 2001 to 2011. The variables consist of socio-economic and environmental information of GMO Crops, agricultural use of glyphosate, population, spread of resistant weeds, GE food labelling, legislations, regulations ballot initiatives, biotech food labelling safety activity, areas planted or covered by Bt corn, and herbicide Bt cotton tolerant soybeans corn. The others consist of states with GMO laws, legislations defeated or withdrawn, GMO labelling, state that have passed GMO labelling, states that have reviewed, states that have yet to address the issue, US labelling map, herbicide use on corn, cotton and soybean, average gross farm income, impacts, cost of technology, aggregate income benefit, and type of benefit. Added to that are the percent of areas covered by GE varieties, GE corn varieties herbicides tolerant Bt Corn: only, percent averages GE corn varieties insect resistant Bt corn: only, all GE corn varieties percent of corn planted 2000-2018, GE soya beans varieties herbicide tolerant corn: only percent planted, GE corn varieties insect resistant Bt corn: only percent average, income and the Bt crops with insect-resistant traits. These variables as mentioned earlier were derived from secondary sources made up of government documents, newsletters, and other documents from NGOs. This process was followed by the design of data matrices for socio-economic and land use (environmental) and Genetic Engineered farm variables covering various periods from 2001, 2003, 2006, 2008, 2011, 2016, to 2018. The design of spatial data for the GIS analysis required the delineation of county boundary lines within the study area as well. Given that the official boundary lines between the 10 Midwestern states remained the same, a common geographic identifier code was assigned to each of the area units for analytical coherency.
2.3. Stage 2: Step 2: Data Analysis and GIS Mapping
In the second stage, descriptive statistics and spatial analysis were employed to transform the original socio-economic and ecological data into relative measures (percentages, ratios, and rates). This process generated the parameters for establishing, the extent of and ratio of areas covered by GE varieties, and the percent averages in GE corn varieties insect resistant Bt corn: only, population, changes in population, analysis of GE food variety insect resistant Bt corn 2000-2018, analysis of GE corn variety herbicides tolerant Bt corn assessment of GE percent in all corn planted areas, the percent of soybean planted herbicides tolerant corn only area, and number of people driving the viability and the distribution of biotech farming operations and the trends throughout the zone for each of the 10 states through measurement and comparisons overtime. While the spatial units of analysis consist of states, the region and the boundary and locations where the rate of GMO food farm sales, acreages of planted fields and the percent of cornfield, soybean tilled areas, proportion of insect resistant herbicides treated areas and the types of varieties of GMO crops that thrived. This analytical approach allows the detection of change, even though the tables highlight the actual frequency and averages on common GMO farm cultivated areas, population change as well as glyphosate use distribution, GE food labelling, states with GMO laws, and the percent of US Corn Farms who adopted Bt seeds and share of soya bean acres planted with GMO materials. The remaining steps involve spatial analysis and output (maps-tables-text) covering the study period, using Arch GIS 10.4 and SPSS 10.4. With spatial units of analysis covered in 10 states (Figure 1), the study area map indicates boundary limits of the units and their geographic locations. The outputs for each state were not only mapped and compared across time, but the geographic data for the units which covered boundaries, also includes ecological data of land cover files and paper and digital maps from 2001-2016. This process helped show the spatial evolution, location of various activities and the trends, the ensuing environmental and economic elements, as well as changes in other variables and factors driving the surge in organic food and the evolution in the study area.
3. The Results
This portion of the enquiry focuses on temporal and spatial analysis of the GMO farm activities and land use across cultivated fields in the study area with descriptive statistics. There is a starting focus on an initial temporal profile of the GE farm parameters involving corn, soya bean and the respective insect and herbicides tolerant types in the study area and the major states. This is followed by the remaining portions of the section comprising of GIS mappings, and the identification of the elements behind the rise in GMOs across farms in the US Midwest region and the efforts.
3.1. GE Food Variety Insect Resistant Bt Corn Area 2000-2018
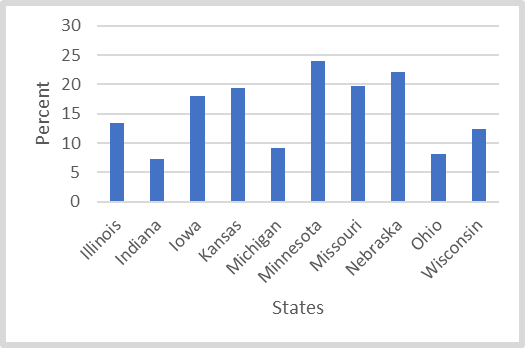
Looking at the proportion of allotted areas in Genetic Engineered food variety fields planted with Bt corn in different parts of the US Midwest all through 2000 to 2018. The entire Mid-western region had about 16.17% of the available land base dedicated to Bt corn type. As time went on in 2004, the cultivated land for the crop jumped to 25 percent, but only to come down to 17.5% during the 2008 planting season. Further into the ensuing years 2012 to 2018, the percent of area dedicated to GE Bt corn type stood at 13.9 to 3.9%. Overall, the zone saw averages at the maximum points in the first three periods of 2000-2008 (Figure 2). Aside from the fluctuations, it remains a very significant showing pertaining to the actual GE corn farm productivity index in the Mid-western region of the country. Among the individual states, a trio of areas most notably Minnesota, Nebraska, Kansas, and Missouri held the top spots in the proportions of GE Bt corn cultivated areas. In the following level, the medium tier group of states consisting of Illinois and Wisconsin mostly in double digits scales held firm in that range while Michigan, Ohio and Indiana rounded out the bottom among the lower tier areas in mostly single digits. The percentage breakdown of the distribution of cultivated areas in the first-tier group, shows a trio of states Minnesota, Nebraska, Missouri, and Iowa with larger proportions of fields planted with GE Bt corn variety followed by the next group of states such as Kansas, Missouri, and Iowa where Genetically Engineered variety of Bt corn area stood at 19.4 to19.8% and 18%. Elsewhere, Michigan, Ohio, and Indiana, maintained single digit equivalents estimated at 9.6% to 8.7% and 7.2% in land area planted with GE corn varieties insect resistant Bt corn type between 2000 to 2018. For that, the consistency of the leading big farm states and the adjoining ones in allotting vast areas to GE corn cultivation should not be a surprise considering the huge concentration of such farms in that region of the country (Figure 3).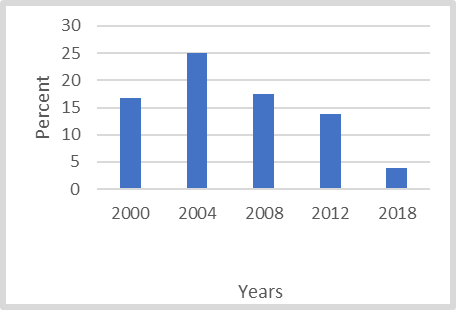 | Figure 2. The Percent of Areas Covered by GE Varieties Midwest Region 2000-2018 |
 | Figure 3. Percent Averages GE Corn Varieties Insect Resistant Bt Corn Only 2000-2018 |
3.1.1. GE Corn Variety Herbicides Tolerant Bt Corn Only 2002-2018
When it comes to the next category of indicators at the regional scale, tagged as all GE corn variety herbicides tolerant Bt corn only planted area from the different periods 2000 to 2018. The trends in the Mid-west region indicates that in the year 2000, about 5.1% of the farm areas in the zone covered herbicides tolerant corn variety. From 2004 and 2008, the cultivated area size of the crop peaked up by 12.2% to 21.7%. This continued in the next periods as cultivated fields ratio in herbicides tolerant corn only varied by 19.8 to 9.2% during 2012-2018. The things to be gleaned from the picture painted so far in the region is that aside from the slow starts in the planted area percentages of 5.1 and 9.2% during the periods 2000-2018, the years 2004, 2008, 2012 on other hand represent the highest points of GE farm operations in the zone. This again affirms the degree to which the planting of herbicides tolerant Bt corn intensified among farms in the Midwest region (Figure 4). 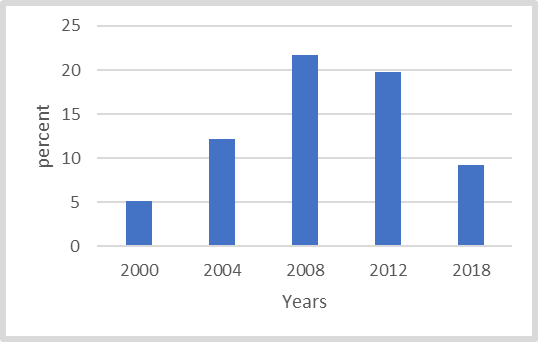 | Figure 4. GE Corn Varieties Herbicides Tolerant Bt Corn: Only Midwest Region 2000-2018 |
Considering that all Genetic Engineered varieties percent areas under corn in the US Midwest region were mostly in the high double-digit levels. It is then unsurprising that such elevated proportions in land coverage remained evident much of the time between 2000-2018, throughout the entire zone. To that effect, it is only during the periods 2000 to 2018 that the planting of all GE varieties corn plots fell below 50% compared to the maximum years in 2000 to 2012 and 2018. Above all, based on the information from the figure, the study area had 22.9 to 41.8% of the activities under cultivated areas in the GE variety of corns during 2000 through 2004. In other words, as the zone opened in the first two years with 22.9-4.1 percent in all corn planted GE varieties, the same proportion of cultivated areas surged to 78% to 86.3% and 90.7% in 2018. Just as the quintet of states Wisconsin, Minnesota, Michigan, Nebraska, and Missouri held the largest proportions (16+,15.8-13.4%) in herbicides tolerant Bt corn variety during 2000-2018 as leading areas. The next group of states made up of Ohio, Iowa, Indiana, Kansas, and Illinois followed with appreciable pace of 11.6-9.2% in cultivated areas under the Bt corn varieties during the fiscal years 2000-2018 (Figure 5). This once again attests to the level of GMO induced farming activities that occurred during those years within states in the zone. 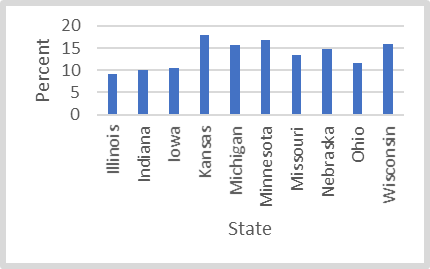 | Figure 5. GE Corn Varieties Herbicides Tolerant Bt Corn: Only 2000-2018 |
3.1.2. All GE Percent of All Corn Planted Area 2000-2018
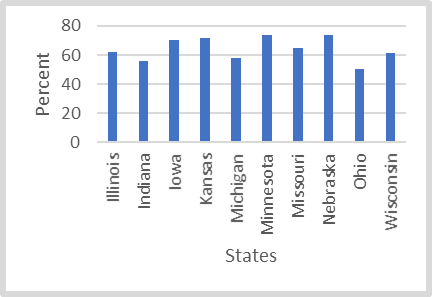
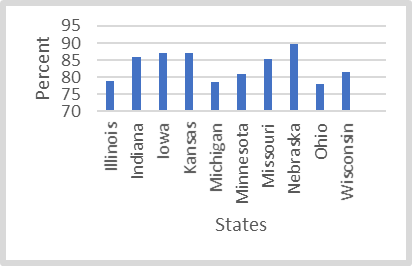
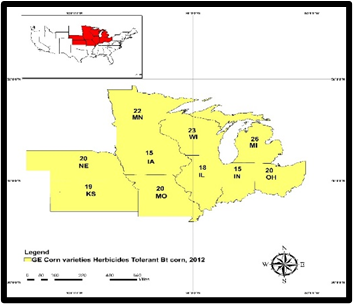
In the 2000-2008 periods during which all Genetic Engineered varieties percent of areas under corn in the Midwest region were mostly in high double-digit levels. It so happened that it was only by 2000 to 2004 that the planting of all GE varieties Corn plots fell below 50% compared to the maximum years 2008 to 2012 and 2018. Based on the information from the graphic, during 2000 to 2004, the study area planted 22.9 to 41.8% of GE variety of corns on the available farm fields. In the later years, 2008-2018, the proportions of cultivated areas surged to 78% to 86.3% and 90.7% respectively (Figure 6). Among states, the leading producers Minnesota, Kansas, Nebraska, Iowa, Missouri, and Wisconsin outpaced their neighbors in percent of the varieties of all GE Corn planted areas dedicated to farming. The scale of production activities in the seven 7 of 10 ten states were mostly in the upper levels for those years at 61-73.8%. This exceeded 50-57% in planted areas accumulated in the farming seasons among the other Midwestern neighboring states of Michigan, Indiana, and Ohio (Figure 7).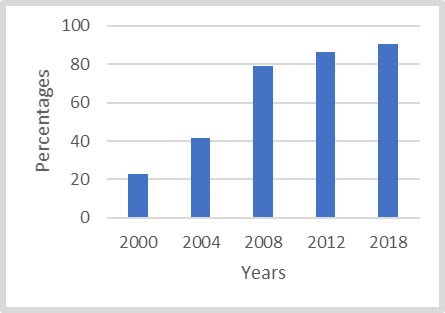 | Figure 6. All GE Corn Varieties Percent of Corn Planted 2000-2018, Mid-West Region |
 | Figure 7. All GE Corn Varieties Percent Planted 2000-2018 |
3.1.3. The Percent of Soybean Varieties Planted Herbicide Tolerant Corn Only
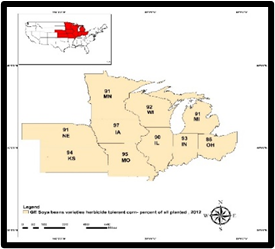
Pertaining to the distribution of areas planted with soya bean corn herbicides resistant varieties during 2000 through 2018. Note that the temporal display of the values as it appears indicates that the region as whole exceeded its previous percentage levels. With the proportion of planted areas at an all-time high, the tallies from the percentage distributions rose from 56 to 83.8% between 2000 to 2004. In the subsequent periods 2008 through 2018, the ratio of areas planted with GE soya beans reached over 90.1%. The individual percentage levels for each planting season points to a 91.6% GE coverage in 2018, followed by 92% to 93.2% between 2012 to 2018 (Figure 8). Interestingly, at the state level, 7 in 10 of them showed similar patterns again, as many of them saw their percent of planted areas surge to over 80% while the remaining two states had slightly identical values estimated in the high seventies. Further look on the farm activities among the states in the zone pertaining to the scale of GE crop land coverage points to the dominance of Nebraska, Kansas, Iowa, Indiana, and Minnesota. In these areas, Nebraska, Iowa, and Kansas stood out with significant proportions (89-96% to 87% and 86%) of farm fields planted with soya bean corn alongside Minnesota and Wisconsin whose GE cropland percent areas reached estimated levels of more than 81% (Figure 9). The second group of states where farm fields set aside for soya bean varieties herbicides tolerant corn cultivation stood at 79-78.6 percent includes Illinois and Michigan during the same periods (Figure 9). In putting the GE activities into context at state level in the Mid-west over the years. Both the GE varieties of all corn planted, and the percent of soya bean herbicides resistant corn areas exceeded farm fields cultivated with insect resistant and herbicides tolerant corn by quite a higher margin of notable importance. Notwithstanding all that, Nebraska, Kansas, and Missouri and Iowa remained quiet ahead of their neighbors in the proportions of all GE crops cultivated areas. 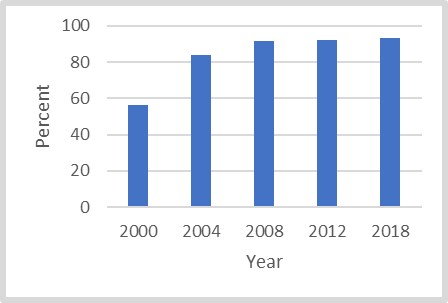 | Figure 8. GE Soya beans Varieties Herbicide Tolerant Corn: Only Percent planted Mid-west Region 2000-2018 |
 | Figure 9. GE Soya beans Varieties Herbicide Tolerant Corn: Only Percent Planted 2000-2018 |
3.2. GIS Mapping and Spatial Analysis
The Geospatial analysis involves the visualization of various GE indicators germane to farming activities in the US Midwest region. For that, the analysis covers the geographic identification of certain crops that make up the GE varieties in the marketplace, the use levels and spatial distribution of chemicals like glyphosate and others (herbicides) linked to GM farming. Added to that are mapping of state legislations and programs demanding mandatory labelling of GMOs foods in circulation to the public among the states in the Midwest. Further, the GIS visualization of the patterns also covers the dispersion of key crops of corn and soya bean cultivated across farm fields in the Midwest and others grown from GE seeds. With the growing popularity of the integration of GE organisms into the cultivation of certain crops like corn and soybean, and others came the use of herbicides, insecticides, and glyphosate in the zone. The capacity to track the geographic contours of these GMO farm trends under a GIS environment as a vital analytical tool, instils faith in assessing the evolution of these activities in GE farm fields in the US Mid-West.In the case of glyphosate usage based on the visualization and distribution in 2012, see that it covers the area distinguished in 4 different colors of yellow, light orange, orange, and the dark blood under visible concentration in the middle of continental US situated on the right side of the map. From the breakdown on the map legends, the proportions of glyphosate spraying falls also under a quartet of scales calibrated under varying proportions of <4.52, 4.52-21.12 to 21.13-86.06 and >88.06. The geographic classifications and tracking of the estimated farm use of glyphosate categories show higher levels in pounds per square miles heavily concentrated in places where the volumes applied hovered at over 88.06 on the scale. There were also other spots in 2012 with values denoting <4.52 and 4.52-21.12 as represented in orange and yellow colors in the region (Figure 10). 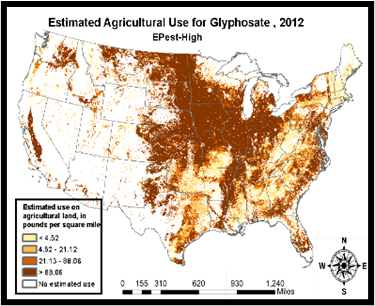 | Figure 10. Spatial Distribution of Farm Applications of Glyphosate, 2012 |
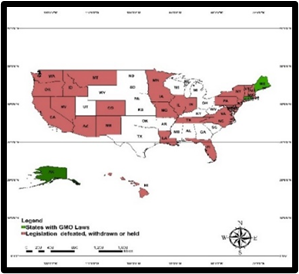
Considering the proliferations of GMO farming activities and the associated controversies coupled with little clarity about the safety, many in the country have toyed with binding legislations pertaining to food labelling under (various or) three rubrics over the years. This includes actions by states, biotech food labelling and GMO labelling. In those periods, the emergent themes from the map legends ranged from passed legislations, ballot initiatives, and introduced legislations. The other contents in the map legends also consists of legislations introduced, defeated, and withdrawn or held, coupled with the areas that passed, reviewing or have yet to address it. In accordance with information on the labelling maps, efforts to legislate GMO food labelling has not been fully adopted across the United States, not to talk of the Mid-west region being the major hub for the cultivation of Genetically Engineered food. Seeing the fiscal benefits that accrues the GE farming sector in the Mid-West region, there is no serious inclinations towards the legal adoption of GE food labelling in the region since 2013 through 2015, hence the reluctance among the states involved (Figure 11, 12, 13).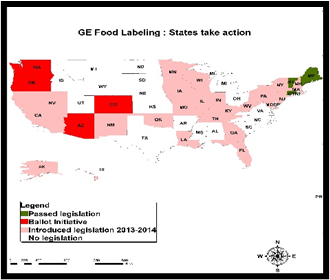 | Figure 11. Dispersion of GE Food Labelling: Action by States |
 | Figure 12. Spatial Concentration of Biotech Food Labelling Measures |
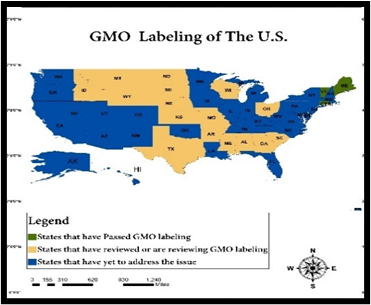 | Figure 13. Spatial Clusters of GMO Labelling in the US |
With much of the high values in the percent of soya bean varieties of herbicides tolerant corn planted in 2004 in the study area clearly firm in the 90s at Nebraska and Kansas along the south corner of the map and ahead of the other states in 2004. The ensuing geographic patterns in the same period reveals visible concentration in the proportion of planted areas along the upper north west states of Minnesota and Wisconsin and Iowa where the values consisted of 82-89% and then followed by 81-87% in planting activities in the nearby lower southern Eastern areas of the map (Missouri, Indiana, and Illinois). Further in the North East, as the map shows, emerges identical proportions of 75-76% in planted areas for both Michigan and Ohio at levels below the rest of the states in the region during 2004 (Figure 14). Notwithstanding the relative stability in values at 91% to mid-90 percentage points among the lower corn belt states of Missouri, Kansas and Nebraska in fields planted with soya beans varieties herbicides tolerant crops in 2012. The trio of farm producing states in the Northwest part of the region (Minnesota, Iowa, and Wisconsin) saw surges of 97, 91 to 92% in the proportion of planted areas at above 2004 levels. With similar patterns of upticks in the proportion of farm fields at 91-86 % in the North East side of the region evident in Michigan and Ohio, the duo of other states (Indiana and Illinois) saw a rally and held on at considerable levels (93-90%) in planted areas clustered on the lower end of the map (Figure 15).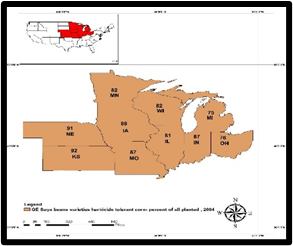 | Figure 14. GE Soya Beans Varieties Herbicides Tolerant 2004 |
 | Figure 15. GE Soya Beans Varieties Herbicides Tolerant 2012 |
When it comes to the proportions of corn varieties herbicides tolerant BT corn fields in 2004-2012, there seems to be a mix of gain and declines as manifested among the respective states over the years. Accordingly, note that during the first fiscal year 2004, just as the low south states of Missouri, Kansas and Nebraska maintained about 13-24 percentage points in the proportion of herbicide tolerant Bt corn areas in space. The state of Kansas among the group in the corn belt part in the lower zone outpaced all the states in the Mid-west region in that category as well. Moving further into the upper Midwest states in the North west parts of Iowa, Minnesota, and Wisconsin. The areas under corn varieties herbicides tolerant Bt went up by 10% 17 to 14% like in Michigan in the North East at similar levels until a gradual slide of mostly single digit values of 4% -8% and 6% in Ohio, Indiana, and Illinois (Figure 16). By the fiscal year 2012, the proportions of areas planted with herbicides tolerant Bt corn shows noticeable jumps of 20% for Missouri and Nebraska while Kansas dropped to 19%. Added to that, in the North west upper states (Iowa, Minnesota, Wisconsin) of the region, also note the sequence of across-the-board increments of 15%, 22 -23% in herbicides tolerant Bt corn area with inroads into other neighboring places. This same geographic pattern represented as 26-20% with spill over into Michigan and Ohio, embodies a reversal from the previous fiscal year even though Indiana and Illinois held firm at slightly identical values of 15 to 18% (Figure 17).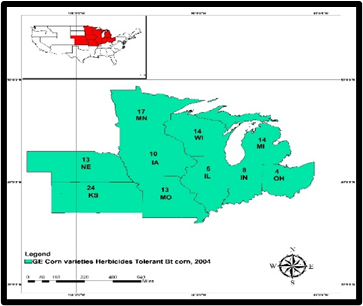 | Figure 16. Corn Varieties Herbicides Tolerant Bt Corn 2004 |
 | Figure 17. Corn Varieties Herbicides Tolerant Bt Corn2012 |
Comparatively speaking, the spatial dispersions of areas treated with insect resistant Bt corn varieties in 2004 through 2012 shows the former enjoys a huge advantage in terms of geographic concentration in such farming activities in all parts of the Midwest region. Consider the extent and form of GE farm operations involving Missouri, Kansas, and Nebraska in which the percentage levels of 32, 25 and 41 in 2004 exceeded the 2012 levels estimated at 18, 20 to 16%. The same patterns hold in the upper North west farm producing areas where the proportions of insect resistant Bt corn fields in Minnesota, Iowa, and Wisconsin during 2004 at 35, 36, and 22% dropped notably to 19 -12%, and 10% by 2012. In the same periods, while Michigan, Illinois and Indiana started with opening values of 15, 26, to 11% in 2004. By 2012, the percent of farm fields in the trio of Mid-western states all came down to single digit values of 8 to 9% for Michigan and Indiana followed by double digit drops of 14% for Illinois, whereas the patterns in Ohio jumped 8% to 13% between 2004 through 2012 (Figure 18-Figure 19). 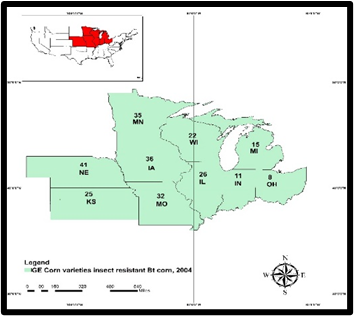 | Figure 18. GE Corn Varieties Insect Resistant BT Corn 2004 |
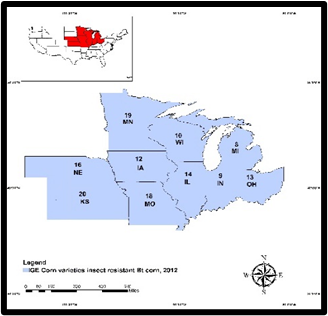 | Figure 19. GE Corn Varieties Insect Resistant BT Corn 2012 |
In terms of the proportions of all GE corn varieties in corn planted areas throughout the period 2004-2012 in the Mid-western region, the entire zone not only experienced major activities in GE farming, but all the states posted appreciable gains sparked by rallies beginning with the lower south areas. In that zone of the Corn Belt, the size of all GE corn planted areas opened at the rates of 49 to 54 and 60% in the states of Missouri, Kansas, and Nebraska in 2004 but only to rise further in 2012 at astronomical percentage levels of 86,90 to 91% higher than the past years and above the levels in adjoining states. Elsewhere in the region’s North west zone, the rates of GE corn fields planted in Iowa, Minnesota, and Wisconsin ranged from 54%, 63 to 38% in 2004, followed by surges of 91-88 to 86 % in 2012. In the remaining places, made up of Michigan, Illinois, Indiana, and Ohio, the percent of GE corn planted areas rose noticeably by 33, 21 to 13% to 86 -85% to 84-76% from 2004 to 2012 (Figure 20-Figure 21).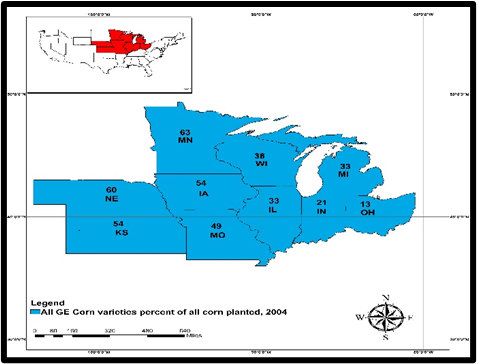 | Figure 20. All GE Corn Varieties Percent all Corn Planted 2004 |
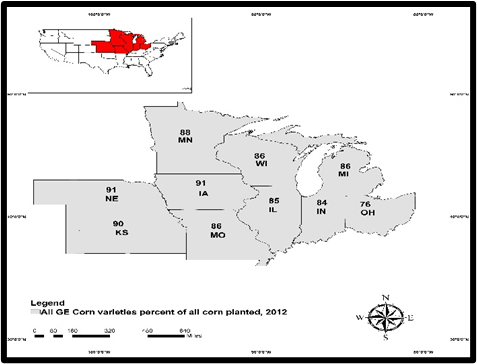 | Figure 21. All GE Corn Varieties Percent all Corn Planted 2012 |
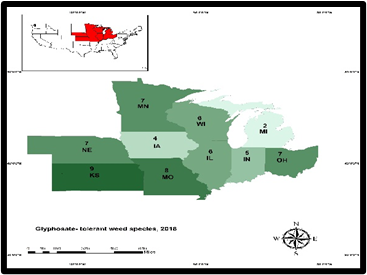 | Figure 22. Glyphosate Tolerant Weed Species 2016 |
Aside from the notable presence in 2016 of 8-9% areas under glyphosate tolerant weed species stretched through Missouri and Kansas together with host of others states like Nebraska and Ohio at 7%. Patches of fields covered by glyphosate tolerant weed species in the order of 5-6 percentage points appeared more in Wisconsin, Illinois, and Indiana as the levels in Michigan and Iowa in 2016 stood at 2-4% (Figure 22). By 2018, Kansas’s share of soya bean acres planted with Dicamba tolerant seeds at 68% outpaced all the states in the Midwestern region while the nearest states (Indiana, Illinois, and Iowa) occupied 43-46% in terms of the proportion in acres as the remaining upper states from Minnesota, Wisconsin, Michigan to Ohio held on to 38-25% of share of the planted acres (Figure 23).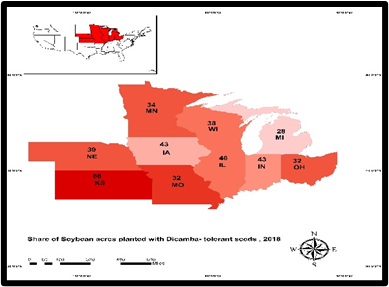 | Figure 23. Share of Soybean acres Planted with Dicamba Tolerant Seeds 2018 |
The spatial distribution of percent of farm operators who took to Bt seeds in 2011-2014 is distinguished by light green, light, and dark blue colors. From the breakdown of the geographic clusters in place during the periods, Illinois, and Nebraska in dark blue corner in the South and the center points of the map at 5.7% -7.4% levels occupied the top spots while closely followed by a quartet of states beginning with Missouri, Kansas, Iowa, and Ohio in the mid index category of 1.1-2.7%. In that order, another group of 4 upper Midwestern states (Minnesota, Wisconsin, Michigan, and Indiana) accounted for just 0.2%-1.0% of places that adopted Bt seeds all through 2011-2014 (Figure 24).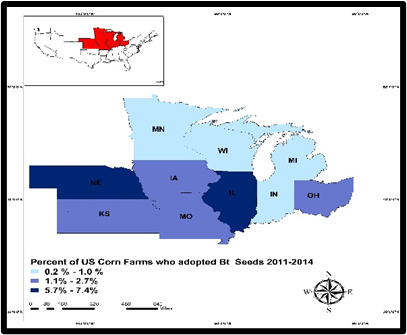 | Figure 24. The Percent of US Corn Farms Adoption Bt Seeds 2011-2014 |
Of great relevance in the adoption of GE types in the period 2000 as the map indicates, is the concentration of the states with the highest, mid, and lower percentage levels. With these places clustered around the left and right side of the map in the fiscal year 2000. Along the lower side of the map, note that the trio of states therein (Missouri, Kansas, Nebraska) maintained GE corn adoption levels of 28, 33-34%. Further in the Upper North of the region, Iowa and Minnesota posted much higher adoption rates of 30-37% above neighboring Wisconsin at 18%. The other quartet of states Michigan, Indiana, Illinois, and Ohio had lower GE adoption levels of 12,11,17 and 10% below the previous group of states (Figure 25).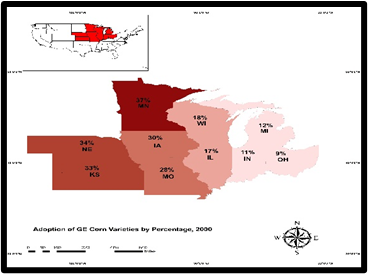 | Figure 25. Adoption of GE Corn Varieties By Percentage, 2000 |
3.3. Factors Influencing Rise in GMO Farming
The growth in GE food indicators in the study area does not operate in a vacuum. It is predicated on a set of policy, economic, technological, and environmental factors outlined below. These elements are examined fully in the following paragraphs.
3.3.1. Enabling Policy Setting/Contradictions
GMOs are regulated in the United States under the coordinated framework for the control of biotechnology, issued in 1986. Yet policymakers at the USDA enabled a huge loophole into its new rule that blatantly benefits major agricultural interests. As a result, this has sparked large increases in farm output among the willing growers eager to cash in on the available opportunities. Notwithstanding all that, as much as the three US government regulatory entities (USDA, EPA, FDA) have authority to standardize GM crops production activities. They still lack regulatory oversight on all GE crops. The same dilemma applies to the EPA which still lacks control over a vitamin-enhanced tomato production. Accordingly, under such settings, it is not surprising as to how the Food and Drug Administration (FDA) would not regulate a drought tolerant turfgrass. Another thing to bear in mind also is that any time these agencies are satisfied that a proposed crop meets the stipulated safety and environmental standards without increased risks to food consumption. The crop not only moves from a non-regulated status, but it is then approved for commercialization. The promulgation of and adherence to various components of the existing policies may have fuelled the sudden rise in GMO farming in the US Midwest region and hence the status therein.
3.3.2. Economic Elements: Benefits and Consumer Habits
Over the years, the financial benefits to US farmers accounted for no more than a third of the total gains in biotech crops in 1997. In that way, the distribution of benefits varies by crops, but bigger portions of the profits went to the biotechnology developers. Since this came in the form of technology fees for gene tech designers in the sector, other actors like domestic and foreign consumers profited through lower commodity prices in the marketplace as well and that drove the supply. With the savings linked with biotech adoption, the sensitivity of supply chains and demand to each commodity price changes remains integral part of the market component in GMO farming operations. For sure, they do suggest that consumers reap many of the financial advantages associated with more efficient production of GE agriculture in ways that influence market and trade transactions. In the process, a large proportion of US consumers constitutes a varied group whose reactions to the appearance of new biotech foods known to spur growth vary significantly as well. Said that, such reactions to new products in those settings, do reflect the demographic characteristics of the buyers, their needs, and preferences and viability of the sought item. This in turn drives the growing preferences among consumers for these products under the prevailing economic conditions for purchase.
3.3.3. Advances in Bio-Technology and Physical Environment
Much of what is known about agricultural biotechnology stems from experience with first generation of biotech items. Being mainly crops with enhanced agronomic traits such as pest resistance or herbicide tolerance. These products help farmers by reducing production costs while increasing yields. With only a third of the first-generation of most agricultural biotech products often tailored towards commercial use during the initial phases, the remaining ones regularly come through in the subsequent years. Realizing that second generation of biotech products, now being developed, are food items with benefits beyond the farm gate. Many of the farmers using first-generation products have generally benefited from modest increases in yields and net returns from reduced use of insecticides and herbicides that are heavily dependent on the latest advances in biotechnology under a heavily tilled conducive landscape. Added to that, are the vast open fertile farm fields in the Midwest region and the resulting level of productivity currently in place where farm size is crucial.
4. Discussion
At a time in which daily experiences are riddled with worries over food production in terms of availability, quality, and quantity in various places of the world. GMO farming has made ample headway with growing acceptance in the US as manifested with significant proportion of activities within the sector in that direction. The current pace of GMO adoption in the nation reflects the advances in science coupled with the penetration into the domain of decision making considering the patronage and confidence among growers and the benefits that accrue the food sector as well. Being a novel approach far different from traditional techniques of food production, the strides made over years has enabled the integration of GMO food farming into policy discourse shaping US agriculture with ample presence in the lives and preferences of consumers. Notwithstanding the concerns about the risks linked to food safety and quality, the spill overs from the success of GMO over the years are evident through the successes in GE crops (soya bean, corn) carrying herbicide resistant traits and the capability to tolerate the herbicide treatments. The turnaround is now so such that US presently produces 10 GMOs crops while more than 90% of corn, soybean, cotton, canola, and sugar beet land in the US stems from GMO farming. Besides that, are growing acceptance of herbicide resistant crops involving seeds inserted with insect resistant traits now being planted in many parts of the US, particularly the Mid-West region. With the region’s role as the food basket of the nation that accounted for $76 billion in tradable farm commodity products including soya, corn, and others in 2012 under large swaths of land. These attributes of the Midwest have clearly optimized GMO farming since 2001-2018 despite the variations in indicators.To understand the penetration of a somewhat non-conventional farming type in a major hub, this study assessed the adoption of GMO food production in the US Midwest using secondary data analyzed by mix scale tools of GIS and descriptive statistics at the regional and local levels across ten states in the zone from 2000 to 2018. In as much as the spike in adoption rates of GMO food farming in the major producing states (Missouri, Iowa, Nebraska, and Kansas) appeared driven relatively by innovations in biotech, the policy framework, and the environment. The Mid west maintained an increase in regional averages estimated at 13 to 15% in the size of fields cultivated with herbicide tolerant corn and GE corn types between 2000 to 2018 in accordance with persistent surge ever since the 1990s. Whereas the ratio of fields set aside for GE food sowed with Bt corn in various sides of the study area from 2000 to 2018 represents about 16.17% of the available land base. The distribution of areas with planted soya bean corn herbicides resistant varieties during 2000 through 2018 in the Mid-west region exceeded its previous percentage levels, as the tallies from the percentage distributions increased by 56 to 83.8% from 2000 to 2004.Considering the vibrant agricultural ecosystem in Mid-West region under a conducive climate, rich in fertile soil in which 75% of the land mass are dedicated to corn and soybeans, together with massive market potentials and opportunities. The prospects of sustainable agricultural practices and the tendency to minimize ecological footprint of farms while reducing pesticides use and fossil fuel conservation epitomizes the utility of GE operations. Thus, GMO farming with its numerous upsides is not only flourishing at much higher level, amidst formidable farm structure. The temporal distribution of GMOs farm index showed much promise with increments in the activities based on the ratios and percentages. This is evident with the sizable proportions of farm fields dedicated to the cultivation of an array of GE crops in the area as well. The breakdown of these land use variables indicative of the extent of GMOs farming adoption over the years in the zone encompasses the percent of areas covered, GE food variety, GE percent of all corn planted area, percent averages of GE corn varieties insect resistant BT corn, GE soya beans varieties herbicide tolerant corn by 2000-2018 and other indicators. Given that the GIS mappings point to a surge in GE farm operations as manifested by a gradual spread across space amongst such indicators like GE soya beans varieties herbicide tolerant and corn varieties herbicides tolerant Bt corn, and the concentration on the farm fields across the states in the region. The spatial patterns also revealed clusters of activities involving GE corn varieties insect resistant BT corn and all GE corn varieties in GMO food producing areas within the Midwest region. Knowing that all these did not happen in isolation, they stem from a host of factors predicated on the enabling policy setting and its contradictions, economic forces based on benefits and consumer habits and the advances in biotechnology and the physical environment of the region. From the analysis, the US Mid-Western region as a major agricultural hub maintains an overwhelming advantage in the proportions of GMO farming fields planted with herbicides tolerant and insect resistant corn and others. Also, the proportion of crops in the US from GMO seeds beginning in their initial applications in 1996 has risen tremendously. Part of the major take ways from the enquiry stems from the dominance of leading areas like Minnesota, Nebraska, Iowa, Kansas, and Missouri in the core GMO farm indicators germane to cultivation since 2000 to 2018 regionwide. In other words, these states remained quiet ahead of their neighbors in the proportions of all GE crops cultivated areas. In contrast, the other adjoining states made up of Michigan, Indiana, and Ohio on the medium/lower tier of GE agricultural production did hold their own as well. In that way, the assessment of GE farming status in the Mid-West reveals it is quite robust as ever and will continue. Accordingly, the study ushers in a viable tool for policy making in assessing the status of alternative and innovative forms of agriculture in various states. To ensure continuity in GMO farming, the paper recommends education, effective policy, transparency and dialogue among opposing views and the recourse to ethical guidelines regarding the production of bioengineered food. For more info see Appendix C.
5. Conclusions
This research assessed the state of GMO farming in the US Mid-Western region alongside the production potentials and activities among the various states in the zone with valuable results listed in the following order. a) GE food and crop types abundant; b) land use indicators rising; c) activities associated with many factors; d) mix scale model effective.From the enquiry, it is evident that the study area stands out as key GMO food belt where an agricultural ecosystem system germane to a variety of crops production has justifiably taken GE farming to commanding heights based on the proportions of production and cultivation fields dedicated to meeting the needs of consumers in the sector. This overlaps with the surge in the range of GE farm indicators viewed as alternative to mainstream agriculture in US Midwest ecozone drawing from advances in genetics science. Against that background, as much as, the nation presently boasts of about 10 GMO produced crops, there exists over hundreds of GM seeds with rare characteristics listed as unregulated. In that light, more than 90% of crops from corn to soybean cultivated areas carry GMO traits. Notwithstanding notable gains at the disposal of farmers to improve food quality, GMO foods have grown so much that in 2012 in the nation, it accounted for 88%-94% of overall corn, cotton, and soybean crops, cultivated in the US. With that came the adoption of herbicide resistant crops in which crops inserted with insect resistant traits are now vastly cultivated in areas across the Mid-West region. In the context of that, being the major farm frontier of the nation, it came as no surprise that the study area, US Midwest region held substantial portions of fields under GE food variety deemed insect resistant Bt corn Areas all through 2000 to 2018. To that effect, the region not only had 16.17% of the available land base dedicated to Bt corn type, but in 2004, the cultivated land for the GE crop jumped to 25%. Considering the extent of variations in the proportions, the performance indicators highlighting the actual GE corn farm output and activities in the US Mid-western region remains promising. To further buttress, the proliferation of GE food variety in the study area during 2000-2018, note that a multiplicity of farm producing states made up of Minnesota, Nebraska, Kansas, and Missouri maintained higher rankings in the percentages of GE Bt corn cultivated fields. As a food basket towering over vast areas, the versatility of essential crop types namely, corn and soya bean and others and their temporal profile between 2000 to 2018 epitomizes the promising nature of GM food abundance in the US Midwest. Aside from a soft start in some of the years, the size of GE cultivated fields peaked up remarkable steam that added a major boost to food security in the entire region.From the volume of GM farm activities in the US Mid-Western region where over 75% of the land mass are devoted to corn and soybeans. Note that two core land use indicators essential in GM farm production, from the proportions of herbicides tolerant Bt corn to soybean varieties fields rose notably. Thus, when it comes to understanding the degree of changes that occurred in the core GMO land use indicators in terms of upticks at the regional level between 2000-2018, look no further than the temporal distribution of the trends. Accordingly, the surge in various farmland parameters (like GE corn variety herbicides tolerant Bt corn, GE percent of all corn planted area and the percent of soybean varieties planted herbicide tolerant corn only), in the respective states while indicative of the intensity of activities, reflects a measure of changes that occurred in the Mid-west. Judging by the assessments, the emergent tendencies in farm areas in the zone showed that planted herbicides tolerant corn variety not only opened at 5.1% in the fiscal year 2000, from 2004 and 2008, but the cultivated area size of the crop grew by 12.2% to 21.7 %. With time, this pattern extended further into the 2012-2018 periods when planted farmland ratio in herbicides tolerant corn changed from 19.8 to 9.2%. Whereas this again affirms the degree to which the planting of herbicides tolerant Bt corn intensified among farms in the Midwest region. Other indications of unprecedented expansions of GE farmland use activities involves the 2000-2008 periods, during which all GE varieties percent of areas under corn in the Midwest region reached mostly high double-digit levels of 78% to 86.3% and 90.7% individually. At the same time, the soybean varieties planted herbicide tolerant corn only side of the assessments echoed the proportion of planted areas at an all-time high as the tallies from the percentage distributions rose from 56 to 83.8 % between 2000 to 2004. In the subsequent periods 2008 through 2018, the ratio of areas planted with GE soya beans reached over 91.1%. At that pace, the single percentage breakdown for each planting season points to enormously high levels (91.6%, 92 to 93.2%) from 2012 to 2018. This is large enough to consolidate the widespread patterns of steady growth in GE farmland use indicators in the US Midwest region. Access to such large swaths of land areas in the zone set aside for GE soya beans and corn cultivation in the face of massive increases, again underscores the abundance of these critical GMO land use indicators vital in food production in the zone.Considering that a whole range of variables to some degree shaped the evolution of GMO farming activities in the Mid-West. Essentially, the research was quite on track in detecting those elements. Because the growth in GE food indicators in the study area emanated from a set of policy, economic, technological, and environmental factors located within the larger farm structure. The enabling regulatory environment in several ways enhanced the advancement of GMO farming with success. With GMOs farming control in the country based on the synchronized structure that extends to biotechnology, since 1986. The existing policy directions as initiated by the nation’s premier agricultural agency; the USDA has been in the forefront in ensuring the delivery of programs aimed at improving the operational capability of the sector by enacting new rulings deemed beneficial to big agricultural interests in GE food. Consequently, proactive measures like that triggered far bigger expansions in farm production from motivated planters willing to capitalize on the existing prospects. At the same time, other regulatory entities in the US like EPA and FDA with vested powers to regulate GM crops production activities remained at the center of current turnaround in GE farming. Other than that, the volume of cash inflow into the agricultural sector brought about by the rallies in market distribution of GE food products to consumers at lower prices may have drawn widespread interest that sparked production through the cultivation of the core crops in the farming fields, hence the expansion and the extent of changes in GMO food land indicators. Additionally, the physical and environmental conditions of the Midwest as one of the most heavily farmed areas in the globe and the nation’s food basket with earnings estimated at over $70 billion in 2017 facilitated the rapid entrenchment of GMO farming over the years. Besides, there is also other added advantages like the region’s fertile soils, the plenty of flat land and the array of ground-breaking research and advances in genetic sciences that resulted in pest resistance crops and higher yields. Although factors shaping GE agriculture are beyond the powers of farm operators in the Mid-western region, these elements continue to shape GMO farm activities. While underscoring links from policy to physical and tech innovations, within the purview of GMO farming in the Mid-West given the omission in the literature, remains a right move in regional studies. Inserting the various factors situated within the bigger farm structure in the enquiry, did place them at the foci of GE farming in the zone.Furthermore, the timely use of mix scale methodology as analytical device stood out in a big way. Utilizing the model which is comprised of descriptive statistics and GIS mapping as analytical tools provided us a novel way towards regional assessment of GMO farming activities. The approach was quite efficient in outlining the area of study and spotting the trends, alongside the gathering of information on the factors and other variables from GE food variety insect resistant bt corn area to GE corn variety herbicides tolerant bt corn only and the percent of areas covered by GE varieties to GE soya beans varieties herbicide tolerant corn and population. This model remains quite essential in serving the desires of scholars charged with the task of temporal-spatial analysis of variations in GMO farmland use indicators within multi states in a region. In addition, the geographic mapping of the trends which encompasses GIS analysis shows visible concentration of states where the proliferation of GMO farm indicators stayed active across time. Consequently, GIS mapping as a planning device remained valuable in stressing the diffusion of GE food indices clustered across GMO food producing areas within the Midwest region, the pace of their spreading, the patterns and weight of their evolution through space. These analytical attributes as indicated from the inferences, affirms the benefits of the enquiry as a prelude to efficient management in agricultural land use. The efficiency of GIS in precisely pinpointing evolving forms of top GE farming states, adoption of legislations pertaining to GMO labelling, the applications of glyphosate, and spatial distribution of the core indicators from all GE corn varieties percent and planted areas to GE soya beans herbicides tolerant Bt corn over time, are of great importance as the study area showed steadiness in the concentration of these variables clustered all over the states. This will allow the enactment of land use plans that ensures the sustainable use of essential GE food cultivation corridors and their monitoring as agricultural areas worthy of preservation for continuity of the sector. In that way, it improves common understanding of the state of GMOs food farming and changes in the key indicators shaping the sector. Given its relevance in the design of land use index and atlas, it sharpens the capacity of managers engaged in the current discussion driving GE agriculture and mainstream farming. Seeing the increasing capacities of GMO farming and the activities across the region and the study outcome, decision makers and planners will need to seek answers to many important queries pertinent to the surge in output and farmland use and cultivation. The queries consist of which issues could minimize continuity of GM farm activities? What evolving elements can influence GE farm production and land use? How can the region deal with the demands and effects of GE food labelling requirements? How will future policies address concerns over the ecological impacts of GE farming? Building on these queries, researchers and practitioners can redirect the spotlight towards the production of quality and abundant GE food materials bound for various markets and consumers.
Appendix A
1.1. Images of GE Golden Rice 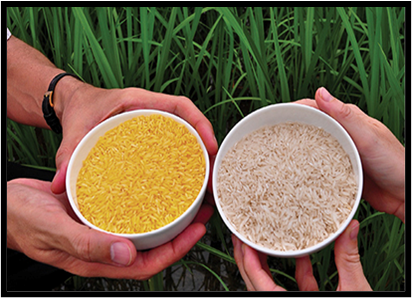 | Figure 2. GE Golden Rice variety (left) so rice kernels generate beta carotene for control of vitamin A defects. Source: International Rice Institute |
Appendix B
1.2. Contrasting Images of GE Corn vs Usual Corn 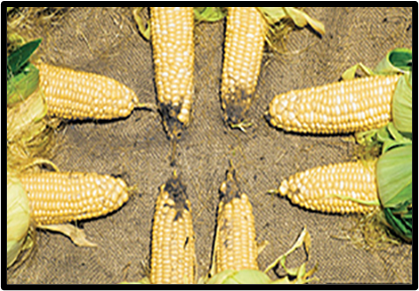 | Figure 5. GM Corn vs. Usual Corn: Upper and Lower Usual varieties ravaged by corn earworm, unravaged ears on the left and right; Bt corn types. Source: University of Georgia. UGA |
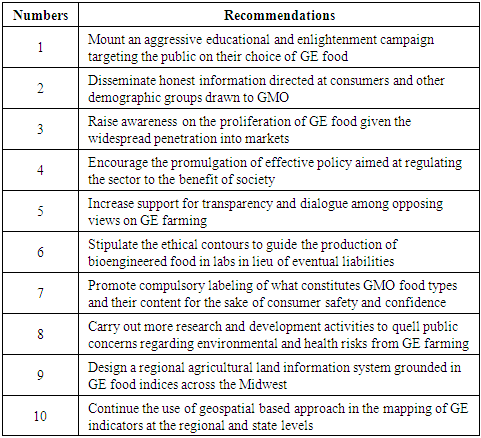
Appendix C
4.1. Recommendations Table 2. Brief Remedies
 |
| |
|
References
| [1] | Merem, E. C. (2019). Regional Assessment of the Food Security Situation in West Africa with GIS. Food and Public Health. 9(2): 60-77. |
| [2] | World Health Organization [2020]. Questions on Genetically Modified (GM) Foods 20 Questions on Genetically Modified (GM) Foods (iatp.org) World Health Organization Online Available: https://www.iatp.org/sites/default/files/20_Questions_on_Genetically_Modified_GM_Foods.htm definition. |
| [3] | United States Department of Agriculture. (2018 June). Adoption of Genetically Engineered Corn In the United States, By Trait 2000-18. Economic Research service Using Data from USDA. National Agricultural Statistics Service annual. Agricultural Survey. DC: Washington. |
| [4] | Plumer, Brad. (2014 August). How GMO Crops Conquered The United States. Vox. |
| [5] | World Health Organization (2014 May). Frequently asked questions on genetically modified foods Q&A. WHO GEN: Switzerland. |
| [6] | Jorge, Fernandez-Cornejo. (2002 May). Adoption of Bioengineered Crops. Agricultural Economic Report No. (AER-810) 67 pp USDA Economic Research Service/USDA, DC: Washington. |
| [7] | Daniel, Norero. (2018 February). GMO crops have been increasing yield for 20 years, with more progress ahead. Cornell University. Alliance for Science Operating Globally. Ithaca: NY. |
| [8] | USDA (2002). The Extent of Adoption of Bioengineered Crops Herbicide-Tolerant Crops. Economic Research Service/USDA. Washington, DC. AER-810: 7 https://www.ers.usda.gov/webdocs/publications/41422/28457_aer810d_1_.pdf?v=0. |
| [9] | The Organic & Non-GMO Report. (2012 November). Pesticide Use Increases with GM Crops. Evergreen Publishing, Inc. Fairfield, IA. Online Available: https://non-gmoreport.com/articles/november2012/pesticideuseincreasesGMcrops.php. |
| [10] | Centers for Disease Control. (2001 November) Investigation of Human Health Effects Associated with Potential Exposure to Genetically Modified Corn. A Report to the U.S. Food and Drug Administration from the Centers for Disease Control and Prevention 4-24. CDC, Atlanta: GA. Online Available: https://www.cdc.gov/nceh/ehhe/Cry9Creport/. |
| [11] | Gillam, Carey. (2014 February). US. GMO Crops Show Mix of Benefits, Concerns - USDA report. Reuters. |
| [12] | Armenakas, Sophia. (2013 August). Genetically-Modified Organisms in United States Agriculture: Mandate for Food Labeling. Food and Nutrition Sciences. 4:807-811. Online Available: https://file.scirp.org/pdf/FNS_2013072516034975.pdf. |
| [13] | Carpenter, J. (2002). Comparative Environmental Impacts of Biotechnology-Derived and Traditional Soybean, Corn, and Cotton Crops. Ames, IA: Council for Agricultural Science and Technology. Online Available: http://www.soyconnection.com/soybean_oil/pdf/EnvironmentalImpactStudy-English.pdf. Accessed March 31, 2010. |
| [14] | Benbrook, C. (2012). Impacts of genetically engineered crops on pesticide use in the U.S.- The First Sixteen Years.” Environmental Sciences Europe. 24: 24. |
| [15] | Price, Gregory. (2003 November). Size and Distribution of Market Benefits From Adopting Biotech Crops. United States Department of Agriculture. Economic Research Service, DC: Washington. TB-1906. |
| [16] | Swanson, Abbie Fentress. (2013 March). Could Genetically-Modified Food Labeling Laws Pass In The Midwest? Harvest Public Media. |
| [17] | The Organic & Non-GMO Report. (2019 April 6). FDA Lifts Import Ban, Clears Path for GMO Salmon To be Sold in U.S. Evergreen Publishing, Inc Fairfield, IA. |
| [18] | Nestle (2020). What is Nestlé’s position on genetically modified organism’s. Online Available: https://www.nestle.com/ask-nestle/environment/answers/gmo-genetically-modified-organisms. |
| [19] | Beetham, Peter. (2018 September). GMOs Are Not Agriculture's Future--Biotech Is. scientific American. |
| [20] | Buiatti, M. (2013 May). The application of GMOs in agriculture and in food production for a better nutrition: two different scientific points of view. Genes Nutr. 8:3: 255–270. |
| [21] | Hanson. Steve. (2017 January). GMO Crops in New Mexico Agriculture. Circular 682 College of Agriculture, Consumer and Environmental Sciences New Mexico State University. Las Cruces, NM. |
| [22] | R and D Midwest. (2016 August) Good, Bad & Ugly About GMOs. Online Available: https://rdinthemidwest.com/2016/08/08/the-good-bad-ugly-about-gmos/ Posted in Dietitian News, Nutrition. |
| [23] | Mulvany, Lydia. (2017 November). GMO Apples Head to the Midwest. Bloomberg. |
| [24] | International Business Journal (2017 November). Get Ready for GMO fruit as modified apples head to Midwest. IBJ https://www.ibj.com/articles/66139-get-ready-for-gmo-fruit-as-modified-apples-head-to-midwest. |
| [25] | Riesselman, Adam. (2015 August). GMOs in My Lifetime: How Genetically Modified Crops Have Transformed Rural America. Special Edition On GMOs. Harvard University, Graduate College of Arts and Sciences. Cambridge: MA. |
| [26] | Food and Drug Administration (2020). New Plant Variety Regulatory Information FDA. DC: Washington. 1-19. Online Available: https://www.fda.gov/food/food-new-plant-varieties/new-plant-variety-regulatory-information. |
| [27] | Acosta, Luis. (2014 March )Restrictions on Genetically Modified Organisms: United States. US library of Congress. DC Washington. |
| [28] | Chow. Lorraine (2018 Dec.) USDA Releases Final GMO Labeling Standard The USDA's approved "BE" symbol. |
| [29] | Raman, Ryan. (2020 July). GMOs: Pros and Cons. Healthline. Online Available: https://www.healthline.com/nutrition/gmo-pros-and-cons#pros. |
| [30] | Farm aid (2021). Issues. GMOs — Top Five Concerns For Family Farmers: Factsheets. Online Available: https://www.farmaid.org/issues/gmos/gmos-top-5-concerns-for-family-farmers. |
| [31] | O'Reilly, Katie. (2018 May). USDA Proposes GMO Labeling Rules But as they stand, they’ll simply sow consumer confusion—to Big Ag’s benefit. the Sierra Club Magazine. Online Available: https://www.sierraclub.org/sierra/usda-proposes-gmo-labeling-rules. |
| [32] | Purdy, Chase. (2018 December). Even Major Food Companies Hate The New US rules for GMO Food Labeling. |
| [33] | Johal, G.S. (2009). Glyphosate Effects On diseases of Plants. European Journal of Agronomy. 31:144-152. |
| [34] | Honig, Esther. (May 2018). Sugar Beet Farmers Caught In GMO Debate, Wait For USDA Labeling Decision. Kansas City Public Radio, Kansas City: MO |
| [35] | USDA (2014 February). Genetically Engineered Crops in the United States. Economic Research Service Economic Research Report; 162. USDA Economic Research Service / USDA, DC: Washington. |
| [36] | Nutrifusion. (2020). Half of Cropland Acres in the U.S. Were Devoted to GMO Crops in 2012. 2020 NutriFusion LLC. Naples, FL. Online Available: https://nutrifusion.com/half-farmland-us-devoted-gmo-crops-2012/. |
| [37] | National Research Council. (2010).The Impact of Genetically Engineered Crops on Farm Sustainability in the United States. National Academies Press. Washington, DC. |
| [38] | Food and Drug Administration FDA. (2020 b March). Consumer Info About Food from Genetically Engineered Plan. Online Available: https://www.fda.gov/food/food-ingredients-packaging/food-new-plant-varieties. |
| [39] | Jorge, Fernandez-Cornejo, (2016 November). The Adoption of Genetically Engineered Alfalfa, Canola and Sugar Beets in the United States. Economic Research Service/USDA, DC: Washington. Economic Information Bulletin No. (EIB-163) 28. |
| [40] | Christopher Furlong/Getty (2018 December), The USDA finally gave a deadline to GMO labeling. Busines Insider. Online Available: https://www.businessinsider.com/gmo-products-must-be-labeled-by-2022-usda-2018-12. |
| [41] | Shoemaker, Robbin. (2003 November). Consumers and the Future of Biotech Foods In the United States. United States Department of Agriculture. Economic Research Service, USDA. DC: Washington. |
| [42] | Bendix, Aria. (2018 December). A new rule requires GMO products to be labeled by 2022, and some food companies are rejoicing. Busines Insider. Online Available: https://www.businessinsider.com/gmo-controversy-beginning-fruit-2017-6. |
| [43] | Biello, David. (2010 August) Genetically Modified Crop on the Loose and Evolving in U.S. Midwest. Scientific American. 1-15. Online Available: https://www.scientificamerican.com/article/genetically-modified-crop/. |
| [44] | Doering, Christopher. (2015 April). Farmers turn to GMO-free crops to boost income. Des Moines Register. Online Available: https://www.desmoinesregister.com/story/money/agriculture/2015/04/18/non-gmo-farming/25951693/. |
| [45] | Swanson. N.L. (2013 April). Genetically Modified Organisms and the deterioration of health in the United States. MIT. Online Available: https://people.csail.mit.edu/seneff/glyphosate/NancySwanson.pdf. |
| [46] | Food and Drug Administration (2016 September). National Strategy for Modernizing the Regulatory System for Biotechnology Products. DC Washington 1-19. |
| [47] | National Conference of State Legislatures NCSL, (2016- June). State Legislation Addressing Genetically Modified Organisms 2016. D.C: Washington. |
| [48] | Merem, E.C. (2020). Analyzing Organic Food Farming Trends in The US Western Region. Public Health Research. 10(2): 41-57. |
| [49] | Merem, E.C. (2020). Exploring Cocoa Farm Landuse Trends in The West African Region. International Journal of Agriculture and Forestry. 10(1): 19-39. |
| [50] | Merem, E.C. (2020). Appraising the Changing Trends In Oil Palm Farming in Nigeria’s Lower South Region. International Journal of Ecosystem. 10(1): 1-22. |
| [51] | United States Census Bureau (2020). US Census Quick Facts. DC: Washington. |
| [52] | Adam, Augustyn, (2020 March). Corn Belt. region, United States. Encyclopedia Britannica, Inc. Chicago, IL. Online Available: https://www.britannica.com/place/Corn-Belt. |
| [53] | Todey, Dennis. (2017 October). Agriculture in the Midwest; the Midwest Climate Hub-. Climate Hubs. United State department of Agriculture DC: Washington. Online Available: https://www.climatehubs.usda.gov/hubs/midwest/topic/agriculture-midwest. |
| [54] | Merem, E.C. (2020 February). Analyzing the Use of Genetic Modified Organisms GMOs in US Agriculture In the Midwest Region. Presented At The 2020 Mississippi Political Science Conference (MPCC), Jackson, MS. |

 Abstract
 Reference
 Full-Text PDF
 Full-text HTML