-
Paper Information
- Paper Submission
-
Journal Information
- About This Journal
- Editorial Board
- Current Issue
- Archive
- Author Guidelines
- Contact Us
Food and Public Health
p-ISSN: 2162-9412 e-ISSN: 2162-8440
2020; 0(2): 48-54
doi:10.5923/j.fph.20201002.02

Examining Founding Dates, Number of Vendors, and Good Type Offerings by Food Desert Status. Analysis of 561 US Farmers’ Markets in Nine US States
Justin Schupp
Sociology Department, Wheaton College MA, Norton, MA, USA
Correspondence to: Justin Schupp , Sociology Department, Wheaton College MA, Norton, MA, USA.
| Email: |  |
Copyright © 2020 The Author(s). Published by Scientific & Academic Publishing.
This work is licensed under the Creative Commons Attribution International License (CC BY).
http://creativecommons.org/licenses/by/4.0/

Farmers' markets have been suggested as a means to improve food access in food deserts. Though shown to occur and celebrated when they do, little is known about how often farmers markets locate in food deserts, what they look like, and how they compare to those in non-food deserts. This study explored the scope and size of markets by examining the number of vendors and types of goods available across 561 farmers' markets within food deserts in nine US States. Results suggest that two trends. First, markets within food deserts are statistically similar to those located in non-food deserts in relation types of goods for sale and the number of vendors. Second, though similar, markets are unequally distributed within food deserts in relation to race/ethnicity and resource distribution. Collectively these results show that farmers' markets are prevalent in food deserts while also highlighting areas for further improvement.
Keywords: Farmers' Markets, Food Deserts, Food Access
Cite this paper: Justin Schupp , Examining Founding Dates, Number of Vendors, and Good Type Offerings by Food Desert Status. Analysis of 561 US Farmers’ Markets in Nine US States, Food and Public Health, Vol. 0 No. 2, 2020, pp. 48-54. doi: 10.5923/j.fph.20201002.02.
Article Outline
1. Introduction
- Residents in food deserts have long been found to have disproportionately lower access to grocery stores and/or foods that are healthy and nutritious [4,22,27]. Additional work has persistently found lower levels of food access in neighborhoods whose residents are made up by high proportions of racial/ethnic minorities--regardless of food desert status [10,13,18,41]. For example, Kolak et al. [18] found that food access for African American neighborhoods in Chicago has been consistently lower compared to others and, in fact, has gotten worse since the 2008 recession. Concurrently, research has also shown that the foods that residents do have access to in food deserts comes from non-grocery store outlets, such as convenience stores, bodegas, and fast food restaurants [5,16,39]. Areas with low supermarket density have been shown to have a lower availability of fresh fruits and veggies, seen as a key part of a healthy and nutritious diet, higher rates of calorically-dense foods, and when fresh foods are present have higher prices when compared to other neighborhood types [17,12,15,22,39]. A large body of work has suggested that this is particularly problematic because diets made up of low fruit and vegetable consumption is considered less healthy and to be associated with an increased risk of many illnesses, including many cardiovascular diseases, diabetes, and multiple forms of cancer [3,28,37]. Collectively, decreased access to healthy foods replaced by calorie-rich nutritionally-poor offerings at non-grocery store outlets has been found to paradoxically contribute to dramatically increasing obesity rates while expanding rates of food insecurity [9,23,33,36].As such, improving access to nutritious and quality foods for those in food deserts has been of significant interest in academia and the general public for many years. Many solutions have been proposed to alleviate these circumstances. One method that has gained significant interest and fanfare has been the creation of direct producer to consumer outlets, such as farmers' markets. Touted to provide economic benefits to producers and nutritional benefits to consumers the number of farmers' markets has grown from 2000 in 1994 to 8600 locations in 2019--a 330% increase in 25 years [38]. Even so, the tract record of improving access to healthier foods in food deserts via farmers' markets has been mixed. Some studies have highlighted beneficial outcomes that have occurred as a farmers' market moves into a food desert [6,30]. For example, Wang et al. [40] found that after entering food deserts in Edmonton, Canada that farmers' markets increased access to fresh foods. Related, Larsen and Gilliland [20] found that over time a farmers' market introduced multiple food items not previously available while also lowering the average cost of a healthy food basket. Other work has critiqued the effectiveness of farmers' markets in food deserts [14,26]. These critiques have suggested that it takes more than just simply locating a farmers' market in a food desert to change patterns of food access and consumption. For example, Lowery et al. [25] found that when looking at low-income and non-majority White neighborhoods that recruiting and retaining vendors hampered the goods markets could offer. Ruelas et al. [31] found some shopper satisfaction of a market in a food desert, but they also noted a significant lack of goods that shoppers were hopeful to purchase. Additionally, Schupp [34] found that while farmers' markets were locating themselves in food deserts that this growth has been dwarfed in comparison to growth in more affluent and whiter areas. Importantly, when a farmers' market does located itself in a food desert it has been hailed and viewed as a victory for improving food access for these communities [20,31,32,40]. However, while cases of farmers' markets moving into food deserts have been documented and accolades have been bestowed, much less in known about the overall prevalence of this occurrence and what these markets look like when compared to those found in other areas. Some of this is likely due to the unit of analysis where a large portion of the past research has occurred, namely at the individual farmers' market or at small group of markets within a city or county level. This research has led to important understandings of the intersections of farmers' markets and food deserts, but there is a relative gap in our understanding when thinking about broader units of analyses, such as at the state, across states, or the national level. This work begins to address these gaps in two ways using data from a survey of 561 markets across nine US States. First, the analysis compares and contrasts the number of vendors and diversity of goods offered at farmers' markets by food desert status. Second, this study examines just food deserts to see what neighborhood characteristics increase or decrease the likelihood of a farmers' market being present.
2. Material and Methods
2.1. Study Design and Sampling Strategy
- To be able to assess the number of good types available and number of vendors present at farmers' markets a survey was constructed that could be sent out to key market agents, such as market managers, and members of the board of directors. Markets in this sample were generated from multiple sources, including from the USDA, State Departments of Agriculture, non-profits supporting local food system development, and internet searches. Given the potential for duplicates market entries across these sources and presence of defunct markets on the list, each market was inspected to see if it was operational at the start of the data collection period. Ultimately, starting in the Summer of 2018, surveys were delivered electronically to key agents of markets in the states of Massachusetts, Rhode Island, Connecticut, New Hampshire, Vermont, Iowa, Kentucky, Colorado, and Oregon (N=1,026). Nonrespondents were sent up to 4 reminder emails, consistent with the Dillman's [12] suggestions for effective survey response rates. Any remaining nonrespondent was sent a paper copy of the survey starting in the early Spring of 2019. Over the course of data collection the list of respondents was inspected for duplicates responses for a market. If a duplicate was found, all but one of the surveys was removed from the sample. The response rate for the survey was 54.7% (n=561). At the end of data collection, several statistical tests were performed to test the generalizability of the sample data to the known population of markets. To do this, several different demographic variables of neighborhoods from the sample were compared to the neighborhoods of the known population, including the variables explored in this article. The results each suggested that the sample data did not significantly differ from the known population by these measurements. Hence, the sample data was considered to be representative of the farmers' markets in these nine states. The survey was constructed in a way to allow for data to be collected on a variety of different themes. These themes surrounded collecting information about the size and scope of the vendor pool at markets, the history of the market, the types of organizational strategies used, the financial health of the market, and size and scope of the types of goods available during market sessions. Given the interest to compare and contrast markets to one another based on the neighborhood they are located in, several variables about neighborhood demographics were accessed from The American Community Survey (ACS) 2014-2018 5-year estimates which was the most current 5-year estimates available at the time of analysis. Additionally, data that measured income inequality from The United States Census Bureau (USCB) and data from The United States Department of Agriculture Economic Research Service (USDA-ERS) that demarcated food deserts was accessed. In the case of the ACS and data from the USCB, the data accessed was at the census tract level. Data from the survey, from the ACS, and from the USCB were joined into one dataset using STATA version 14.2.
2.2. Measures
- To be able to understand the scope of good diversity at farmers' markets, survey respondents were asked 12 questions that each asked about a particular category of goods that has been found to be offered at farmers' markets. Respondents were asked if the following were available for sale at the height of the market season: fruits, vegetables, cheese, meat, eggs, prepared goods, canned goods, mushrooms, flowers, plants, beverages, and other. Each affirmative answer was coded 1 and the 12 questions were summarized (mean 8.06/standard deviation 2.70). To explore the size of a market, respondents were asked how many vendors were present during a market session at the height of the season (mean 17.89/standard deviation 15.17). A total of six responses were removed from the analysis because the number of vendors was found to be more than five standards deviations higher than the mean. Respondents were also asked to report the year in which they came into existence. This was considered to be the founding year of a market. Two variables were created from the ACS. First, a latent variable that measured socio-economic status of the surrounding neighborhood was created using four manifest variables available in the ACS, including median household income, education rates, median house value, and median rent. Cronbach alpha (⍺=.8975) and principal component factor (eigenvalue 3.08) analyses each suggested high interrelationship between the variables. As such, for the purposes of this work, these results considered suitable to combine into one variables for analysis. Four neighborhoods with scores more than three standard deviations above the mean were removed from the analysis. Second, to measure the racial and ethnic composition of a neighborhood the total number of people identifying as white only was divided by the total number of people in the tract. The resulting score identified the proportion of people in the neighborhood who identify as white (mean .84, standard deviation .17), meaning as scores of this variable increases the number of individuals who identify as a racial or ethnic minority decreases. This analysis also included the GINI coefficient (mean .425, standard deviation .061) of the neighborhood available from the USCB. Ranging from 0 to 1, a GINI coefficient is a common measurement in economics used to measure income/wealth distribution of a given geographic area. Lower GINI scores denote greater equality of wealth/income in a space; whereas increasing scores denote greater inequality. Lastly, using the USDA-ERS, a dummy variable was constructed to denote food deserts. Consistent with previous studies, neighborhoods were considered food deserts if they satisfied two conditions: a. that the tract had a poverty rate of 20% or more, or a median family income less than 80% of the State it was in or surrounding metropolitan area; and b. that the tract had 500 or 33% of the population more living more than one mile (urban) or 10 miles (rural) from a supermarket, supercenter, or large grocery store. Of the 7167 tracts in the sampling area, 754 (10.5%) were considered a food desert by this measurement.
3. Results and Discussion
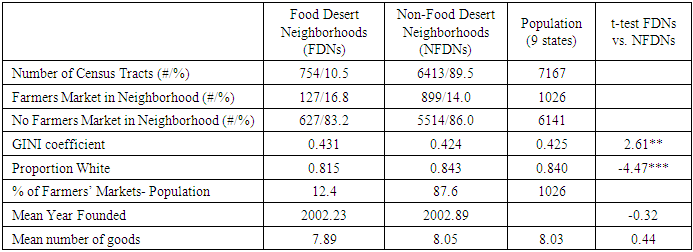
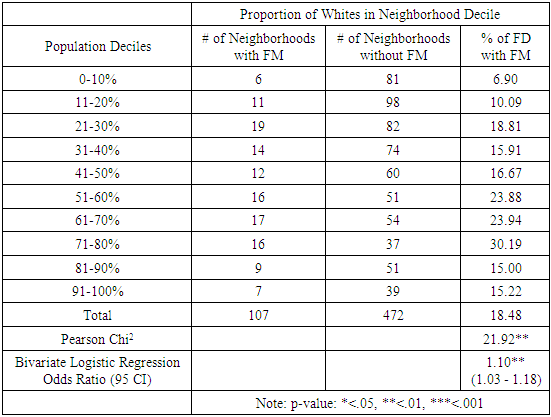
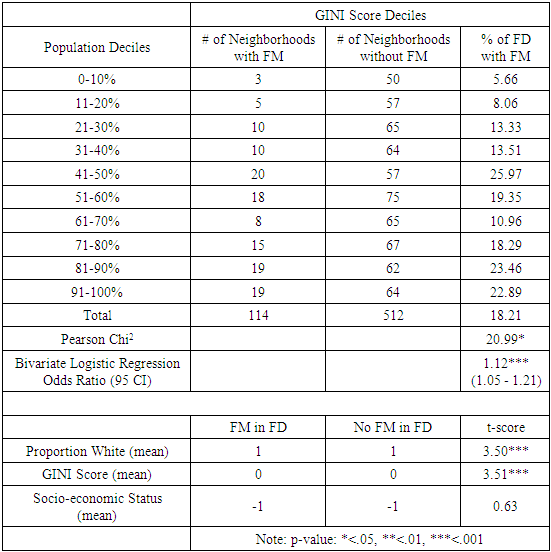
- The results of the univariate and bivariate analyses can be found in Tables 1, 2, and 3. Table 1 compares and contrasts food desert neighborhoods (FDNs) to non-food desert neighborhoods (NFDNs). In the sample, 754 (10.5%) tracts were found to be FDNs and 6413 (89.5%) were found to be NFDNs. As to be expected given how they are conceptualized, FDNs were found to have significantly higher GINI coefficient mean and, consistent with previous work, were also found to have significantly lower mean proportion of whites in the neighborhood. In looking at farmers' markets, 899 (87.6%) of the 1026 total markets across the population of farmers' markets were found to be in NFDNs, meaning that 127 (12.4%) are located in FDNs. Though overwhelming found in NFDNs, when looking at the markets themselves, the analysis shows that they are statistically similar to one another in relation to the average founding date, mean number of goods, and mean number of vendors while occurring within their category at roughly the same proportion (FDNs 16.8%, NFDNs 14%). As the last column of Table 1 shows none of market variables were found to significantly differ from one another when comparing the means to one another via t-tests.
|
|
|
4. Conclusions
- Collectively, the two trends found in this analysis ask one to take a moment to reflect in that they could potentially represent a glass to be half full, a glass half empty, or perhaps both. There is reason for proponents to celebrate in that markets are, in fact, making headways into food deserts and seem to be offering a similar number of goods from a similar number of vendors when compared to other areas. This could demonstrates agents of farmers' markets have heard the critiques leveled on them and they are actively working towards offering more diversified and robust markets. However, the analysis also suggests that the current locating practices of farmers' markets in food deserts may be further perpetuating the same race and class barriers that have been noted over the last 20 years as farmers' markets have exploded in the United States. In particular, that markets are in whiter than average food deserts is worrisome for advocates for food justice, yet remains to be consistently found to be the case by other studies in non-food desert neighborhoods. Ultimately, these dual findings denote that a continued, and perhaps deepened, commitment to social justice via the recognition of white and class privilege would be of a benefit to the farmers' market movement. For example, Alkon [1] and Reynolds and Cohen [29] highlight that efforts rooted in anti-racism, social justice, and community participation that incorporate all voices interested can be successful in improving ills seen not just in the food system, but in inequality overall. Evidence continues to emerge that show these guiding principles can be beneficial and lead to successful outcomes. For example, Lindemann [24] found that planning for green spaces and community gardens that utilized community- and resident-driven development models resulted, "in more holistic community transformation across sectors, with the potential for greater resident participation, sustainability, and equity (p. 867)".
ACKNOWLEDGEMENTS
- The author is greatly appreciate of the contributions of his undergraduate research assistants in the conceptualization and data collection of this project. In no particular order, the author thanks greatly: Eric Pheiffer, Kate Martin, Delia MacLaughlin, Katie Brown, Jessica Chaikof, Mackenzie Geller, Cecilia Depman, Jack Segal, Alwyn Ecker, and Kexin Zhen.
Disclosure
- The author, to the best of their knowledge, have any conflicts of interest of competing interests to declare. This research did not receive any specific grant from funding agencies in the public, commercial, or not-for-profit sectors. The author will happily share the data upon request.
 Abstract
 Reference
 Full-Text PDF
 Full-text HTML

