-
Paper Information
- Paper Submission
-
Journal Information
- About This Journal
- Editorial Board
- Current Issue
- Archive
- Author Guidelines
- Contact Us
Food and Public Health
p-ISSN: 2162-9412 e-ISSN: 2162-8440
2020; 10(1): 19-25
doi:10.5923/j.fph.20201001.03

Hyperspectral Imaging of a Single Bacterial Cell
 Abstract
 Reference
 Full-Text PDF
 Full-text HTML
Rebecca D. Riggs1, 2, I-Hsuan Chen1, Oleg Pustovyy2, Bertram Zinner3, Iryna Sorokulova2, Vitaly Vodyanoy2
1Department of Biological Sciences, Auburn University, Alabama, USA
2Department of Anatomy, Physiology, and Pharmacology, Auburn University, Alabama, USA
3Department of Mathematics and Statistics, Auburn University, Alabama, USA
Correspondence to: Vitaly Vodyanoy, Department of Anatomy, Physiology, and Pharmacology, Auburn University, Alabama, USA.
| Email: |  |
Copyright © 2020 The Author(s). Published by Scientific & Academic Publishing.
This work is licensed under the Creative Commons Attribution International License (CC BY).
http://creativecommons.org/licenses/by/4.0/

Characterization and discrimination of microorganisms by hyperspectral analysis is a promising alternative to conventional techniques in clinical, food, and environmental microbiology to be used as a rapid, non-destructive tool. In this work, we used the CytoViva hyperspectral imaging system to elicit the individual hyperspectral profiles produced by three food-borne pathogens, Salmonella, Escherichia coli, and Listeria at 18, 21, and 24 hours of growth. The distinctive feature of our hyperspectral system is that it employs a super-resolution condenser that allows for the capture of high-resolution spectral data of a single bacterial cell. The microscopic system with hyperspectral capability produces uncomplicated single peak optical spectra of individual cells that can be analyzed by simple computerized methods in contrast to the conventional multi-cell hyperspectral methods that require spectral convolution and principal component analysis. The super-resolution hyperspectral imaging created sharp spectral profiles based upon the unique surface property of each microbial cell. All bacteria were cultured, pelleted, washed, transferred to a poly-l-lysine coated slide, and cover-slipped to obtain the spectral profiles of live, metabolically active bacterial cells. The single-peak bacterial spectra were analyzed by the non-statistical Local Maximum method and by the non-linear fitting of spectra to a particular statistical model. Gaussian, Lorentzian, Logistic, Inverse polynomial, Gumbel, and Gram-Charlier peak functions were applied to bacterial spectra in the range of 400 – 1000 nm. A one-way ANOVA was conducted to compare fitting parameters. With this technique, we were able to characterize and discriminate Salmonella, E. coli, and Listeria with a high level of confidence. This novel application of hyperspectral imaging has the potential to be used as a point-of-care testing and safety scanning at all points of food production, including growing, harvesting, preparation, transportation, distribution, and storage.
Keywords: Super-resolution, Live bacteria, Statistical model, Single microbial cell
Cite this paper: Rebecca D. Riggs, I-Hsuan Chen, Oleg Pustovyy, Bertram Zinner, Iryna Sorokulova, Vitaly Vodyanoy, Hyperspectral Imaging of a Single Bacterial Cell, Food and Public Health, Vol. 10 No. 1, 2020, pp. 19-25. doi: 10.5923/j.fph.20201001.03.
Article Outline
1. Introduction
- Foodborne pathogens are among the most significant problems in maintaining the health of the population. CDC estimates that each year roughly 1 in 6 Americans (or 48 million people) are infected, 128,000 are hospitalized, and 3,000 die of foodborne diseases [1]. Salmonella spp, Shiga toxin-producing Escherichia coli O157 (STEC), and Listeria monocytogenes are among the leading causes of foodborne illnesses in the United States [2]. Traditional microorganism recognition methods, such as culturing and colony-counting techniques [3], polymerase chain reaction methods [4], and immunoassay techniques [5], are capable of detecting initially low numbers of cells and have reduced constraints of specialized equipment [6]. Nevertheless, these methods are typically time-consuming and destructive, and they also require well-trained operators to obtain results. They cannot be employed for real or near-real-time detecting.Consequently, there is an urgent need for new, real-time detection systems for reliable recognition of foodborne pathogens. Of all the available options, the hyperspectral imaging (HSI) method is demonstrated as one of the most promising alternatives, being a non-destructive analysis technology that can easily take part in food safety evaluation [6]. The light diffraction in conventional microscopy limits optical spatial resolution and does not allow imaging of a single microbial cell. The hyper-spectra of several organisms have a complicated multi-peak profile typically [7] and require Principal Component Analysis, or quite complicated deconvolution of spectra [8] to interpret results. The hyperspectral spectroscopy, combined with the enhanced darkfield microscopy demonstrated that spectra of a single nanoparticle are much simpler than spectra for a cluster of particles [9]. The spectrum of a single nanoparticle was normally a single peak curve, while the cluster had a much more complicated profile. In this work, we used the CytoViva Hyperspectral Imaging System [10] supplied with a super-resolution light illumination condenser [11]. This allows taking spectra of a single microbial cell, and using for characterization and discrimination of Salmonella enterica serovar Typhimurium, Escherichia coli O157:H7 and Listeria monocytogenes at 18, 21, and 24 hours of growth in the range of 400 – 1000 nm.
2. Methods
2.1. Bacterial Cultures and Sample Preparation
- Salmonella enterica serovar Typhimurium, Escherichia coli O157:H7, and Listeria monocytogenes (Auburn University culture collection) were cultured in Brain Heart Infusion Broth (Difco Laboratories) at 37°C and imaged at time points of 18, 21 and 24 hours of growth. At each time point, cells were pelleted at 10,000 rpm for 10 minutes and washed in PBS twice before being diluted tenfold for sampling. Cells were immobilized in the pre-coated poly-L-lysine slides and coverslip. The immobilization in the poly-L-lysine slides was shown to localize bacteria to slide without compromising their biological viability [12].
2.2. Hyperspectral Microscope Imaging System
- In this work, a CytoViva Hyper Spectral Imaging System (Auburn, Alabama) was utilized. The system composed of an upright microscope, Olympus BX-51 with 100X oil with iris objective and a spectrophotometer with transmission grating with a spectral range of 400 nm – 1000 nm and spectral resolution of 2.8 nm. An automated stage provides the scan resolution with a 10 nm stem size. The spectrophotometer interfaced with computer Dell Precision Tower 3620 XCTO Base, 8GB RAM. The quartz halogen lamp with an aluminum reflector is used as a light source. An ENVI 4.8 image analysis software allows evaluating hyper-spectra.
2.3. Super-resolution Condenser
- For work with life and unstained single-cell microorganisms, the illumination of the sample is required to provide good optical resolution and contrast to distinguish clearly cells from the background. The samples were viewed using the patented CytoViva darkfield condenser (CytoViva, Inc., Auburn, AL) [11,13,14]. The condenser provides nearly non-diffracting Bessel illumination that allowed optical resolution of λ/5 or better than 90 nm in visible light. The optical system offers the ability to produce optical sectioning. The optical sectioning also permits the discerning of in-focus image from out-of-focus structures [15]. Additionally, it allows seeing not only the cell surface, but also get a glance inside bacteria below the cell wall. The images of bacteria taken by this condenser are clearly discernible and allowable for taking high-quality hyper spectra.
2.4. Hyperspectral Microscope Image Acquisition
- Hyperspectral data were acquired using a visible near-infrared diffraction grating spectrograph that is connected to a camera. An RGB image with both spectral and spatial data is produced using the pushbroom approach in which the sample is moved across the field of view pixel line by pixel line. Lamp subtraction was performed for each image to reveal the spectra produced by the microorganism. Seven - 12 cells were selected from each image and the intensities of the extracted spectral curves were averaged and normalized. Each experiment was repeated 3-4 times.
2.5. Statistical Analysis
- Data averaging, curve fitting, F-test, and graph plotting were conducted using Origin 2019 (Northampton, MA) and 2010 Microsoft Excel. The comparison of means was carried out using one-way ANOVA that was followed by Tukey’s multiple comparison test. The hyperspectral peaks were analyzed by the Local Maximum model (non-statistical model) and Statistical models [16].
2.6. Hyperspectral Microscopy Image Analysis
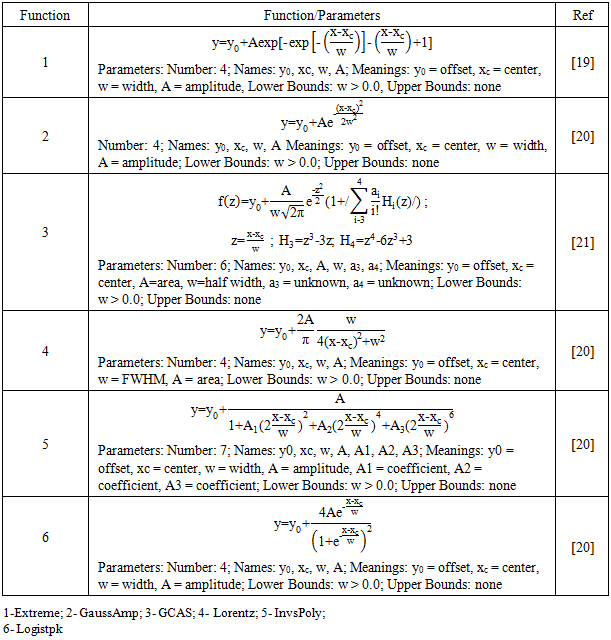
- The aim of this analysis is to answer specific questions: (1) Which fitting model fits best? (2) Does one model fit all bacterial spectra? (3) Are fitting parameters different for different bacteria? We compared spectra of Salmonella enterica Typhimurium, Escherichia coli O157:H7, and Listeria monocytogenes obtained at 18, 21, and 24 hours of growth. We used the following strategy: (1) Calculation of parameters of spectra for each bacterium using the Local Maximum method and compare parameters of the spectra to determine statistically whether the calculated parameters can discriminate the bacteria. (2) Fitting spectral peaks with statistical functions, rank models and find those that better describe the experimental spectra and compare the model parameters to examine if the statistically fitted model can discriminate bacteria by spectra.The Local Maximum does not fit the statistical model [16]. It does not use any underlying function. The Local Maximum method is a maximum searching algorithm, which finds the local maximum in a moving window. A predefined number of local points determines the window size. Initially, an n-point window is placed at the start point of the data stream. The maximum in this window, as well as its index, is recorded. Then the window is moved one step further. If the new maximum is greater than the saved maximum, update both the maximum value and index value and then move forward. By using this method, we can calculate the parameters: center, full width at half maximum (FWHM), the area under peak, and centroid.We use a non-linear fitting of our peak spectral data to a particular statistical model to find which model fits best with experimental data. We can describe the process of nonlinear curve fitting as following: (1) Generate an initial function curve from the initial values. (2) Iterate to adjust parameter values to make data points closer to the curve. (3) Stop when minimum distance reaches the stopping criteria to get the best fit. Origin software [16] provides options of a different algorithm, which have different iterative procedure and statistics to define minimum distance. To describe the hyperspectral peaks, we tried to fit 24 explicit functions. We have chosen six functions that converged with our hyper spectra experimental data. The list of functions that we used in our work is given in Table 1.
|
3. Results
3.1. Local Maximum Model
- Most of the hyper spectra of a single cell of Salmonella, E. coli and Listeria in a range between 400 and 1000 nm constitute broad peaks sharp rise shoulders and gradual decays. The spectra are relatively noisy at the beginning and the end of curves. It is clear from the peak images that positions of the peak maxima (centers) cannot reliably serve to discriminate bacteria. However, areas under peaks and the width of the peaks seem quite different.
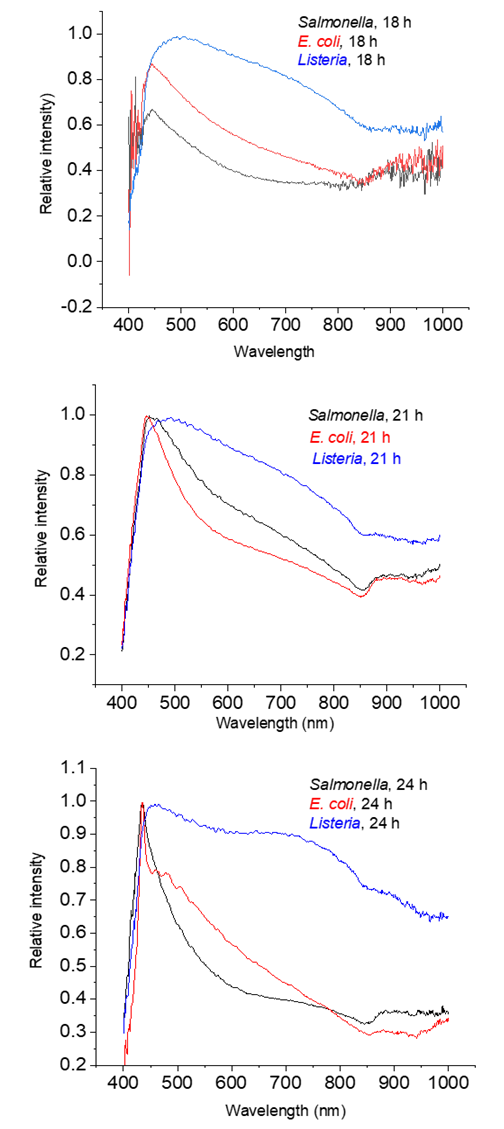 | Figure 1. Averaged spectra for each organism at 18, 21, and 24 hours of growth |
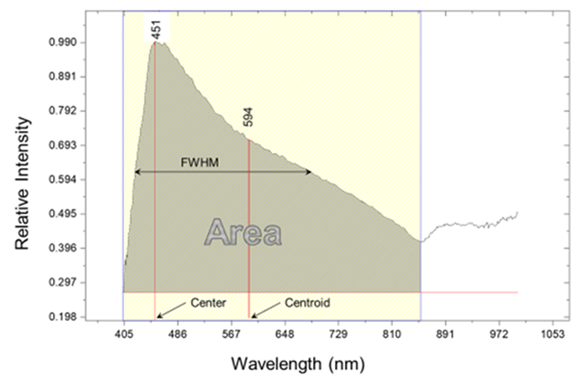 | Figure 2. Area, FWHM, Center, and Centroid of the Salmonella 21 h of the mean of ten cells spectra |
|
3.2. Statistical Model
- Figure 3 shows the fitting of the mean spectrum of Salmonella 24 hours growth with GCAS, Extreme, and Lorentz statistical functions. It is difficult to decide what function provides the best fitting just by looking at the fittings. However, using the ranking module of the Origin software [16], we can assemble a table that ranks fitting of the Salmonella 24 h spectrum with GCAS, Extreme, Lorentz, Logistpk, GaussAmp, and InvsPoly spectral functions (Table 3).
|
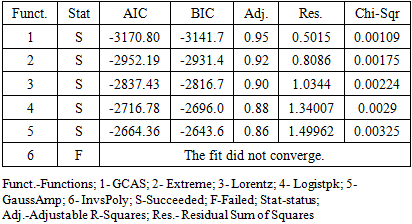
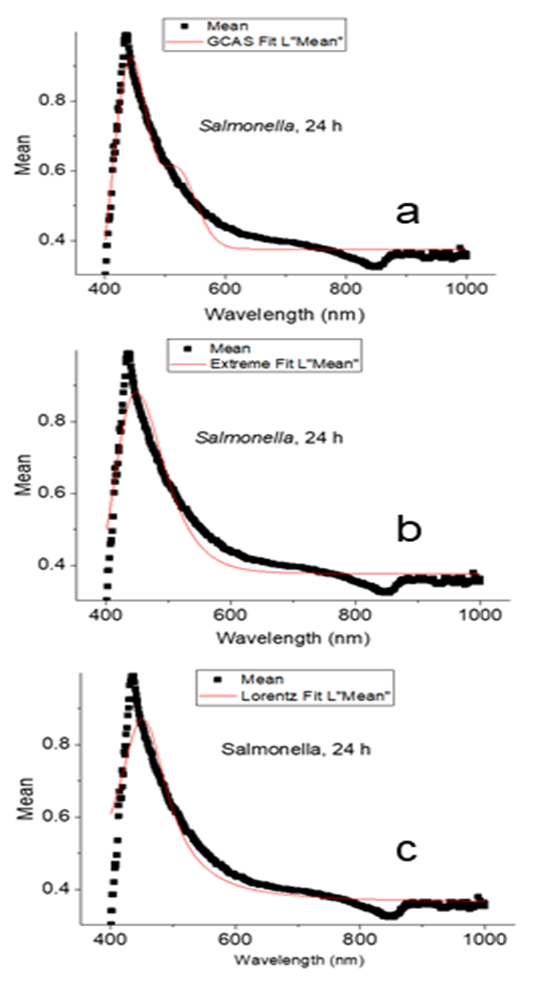 | Figure 3. Fitting of the mean spectrum of Salmonella 24 hour’s growth with GCAS (a), Extreme (b), and Lorentz (c) statistical functions |
|
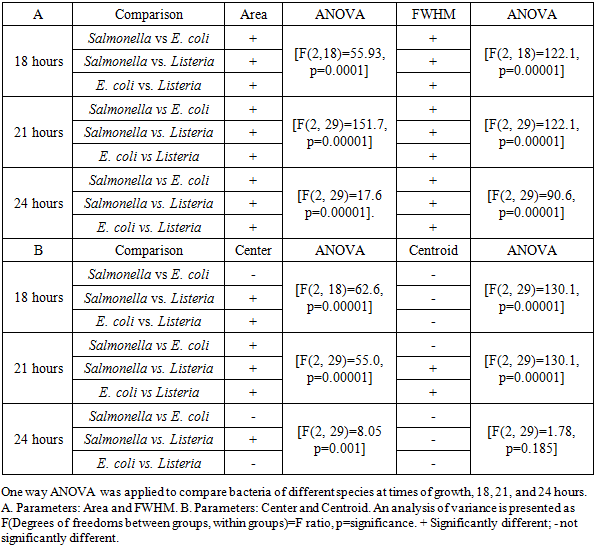
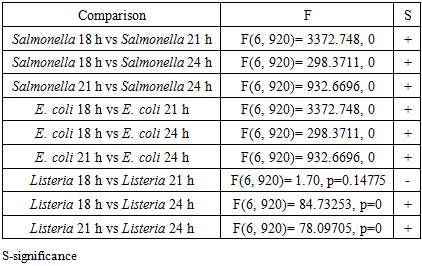
3.3. Bacteria with Different Growth Time
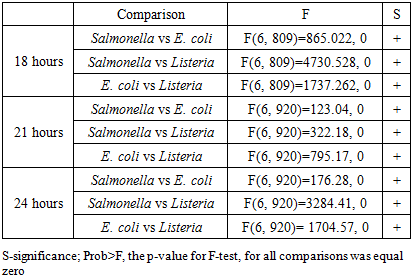
- We found that spectra of the same bacterial strain were different for different times of growth. Figure 4 shows the spectra of Salmonella, E. coli, and Listeria at 18, 21, and 24 hours of growth, respectively. To differentiate spectra of these bacteria, we apply the same strategy that we use for spectra analysis of different bacteria at the same time of growth. We ranked spectra of all bacteria of the same strain at each time point of growth and found the best fitting functions. Fitting parameters of spectra were used for comparison and discrimination of bacteria using the F-test. Discrimination of Salmonella, E. coli and Listeria at 18, 21, and 24 hours growth fitted with GCAS by F-test is shown in Table 5.
|
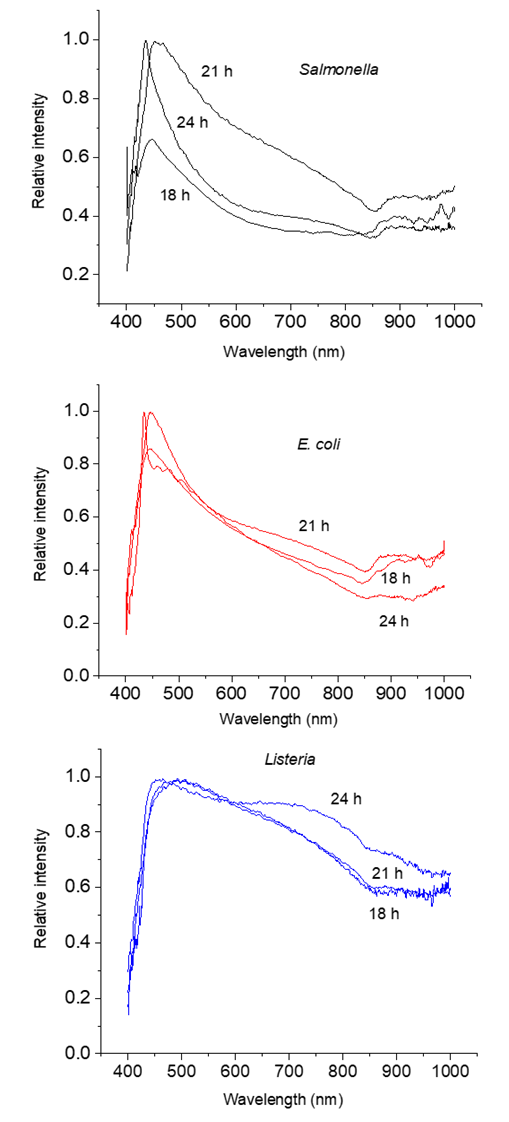 | Figure 4. Spectra of Salmonella, E. coli, and Listeria at 18, 21, and 24 hours of growth, respectively |
4. Discussion
- Hyperspectral microscopy is an innovative imagining technique that merges hyperspectral visualization with light microscopy and computation technology to allow the rapid characterization of microparticles and microorganisms. It has been successfully used for the imaging of nanoscale materials and the rapid identification of microorganisms [22,23]. Because the hyperspectral spectroscopy is a light-based technology, it has limitations that are inherent in light microscopy. Primary, its spatial resolution is not sufficient to differentiate individual cells from their clusters, and thus it is not to be able to differentiate the two microorganisms, which may limit its use for the rapid identification of pathogens. The considerable step forward in solving the spatial resolution limitation was incorporating enhanced darkfield light microscopy into hyperspectral imagery [9,24]. Darkfield microscopy gives a high contrast appropriate for the examination of low-contrast objects, generally not visible by conventional bright-field microscopy. The darkfield condenser projects light onto the sample at oblique angles, preventing the excitation light from directly entering the objective [25]. The CytoViva High Resolution Adapter was adopted from the optical condenser developed for obtaining super-resolution imaging in the conventional light microscope [11,13,14]. Ninety-nm resolution was achieved using an optical illumination system with a high-aperture cardioid annular condenser producing a Bessel illumination [15]. The optical system offers the ability to produce optical sectioning.Meanwhile the optical sectioning also permits the discerning of the in-focus image from out-of-focus structures. Additionally, it allows us to see not only the cell surface but also get a glance at the inside the cell. Fine focusing and placement of focus in any depth of the cell allow the focus to be placed at a desirable increment.
5. Conclusions
- The limited spatial resolution characteristic of conventional illumination was diminished by the use of super-resolution condenser in our work. The super-resolution hyperspectral imaging allowed differentiating three viable microorganisms, Salmonella enterica serovar Typhimurium, Escherichia coli O157:H7, and Listeria monocytogenes at 18, 21, and 24 hours of growth. Present experimental data and spectral analysis can be used for assembly of future libraries that will include these bacteria in various environments and can be used for their identification. We envision that hyperspectral analysis of bacteria will be developed further and techniques will be adapted to clinical isolates. With future development, such a system could be utilized in hospital settings to detect the presence as well as identify the pathogens
ACKNOWLEDGEMENTS
- This work was supported by the Department of Biological Sciences and the Department of Anatomy, Physiology, and Pharmacology. Authors grateful to James Barbaree for his idea of using Hyperspectral Imaging for characterization of bacteria.