-
Paper Information
- Paper Submission
-
Journal Information
- About This Journal
- Editorial Board
- Current Issue
- Archive
- Author Guidelines
- Contact Us
Food and Public Health
p-ISSN: 2162-9412 e-ISSN: 2162-8440
2019; 9(5): 148-157
doi:10.5923/j.fph.20190905.02

Socioeconomic and Demographic Differences in Food Group Intakes of Adolescents in Urban Benin
 Abstract
 Reference
 Full-Text PDF
 Full-text HTML
Eunice Nago, Saturnin Houndji, Sherifath Mama Chabi
School of Nutrition and Food Science and Technologies, Faculty of Agricultural Sciences, University of Abomey-Calavi, Abomey-Calavi, Jericho - Cotonou, Benin
Correspondence to: Eunice Nago, School of Nutrition and Food Science and Technologies, Faculty of Agricultural Sciences, University of Abomey-Calavi, Abomey-Calavi, Jericho - Cotonou, Benin.
| Email: |  |
Copyright © 2019 The Author(s). Published by Scientific & Academic Publishing.
This work is licensed under the Creative Commons Attribution International License (CC BY).
http://creativecommons.org/licenses/by/4.0/

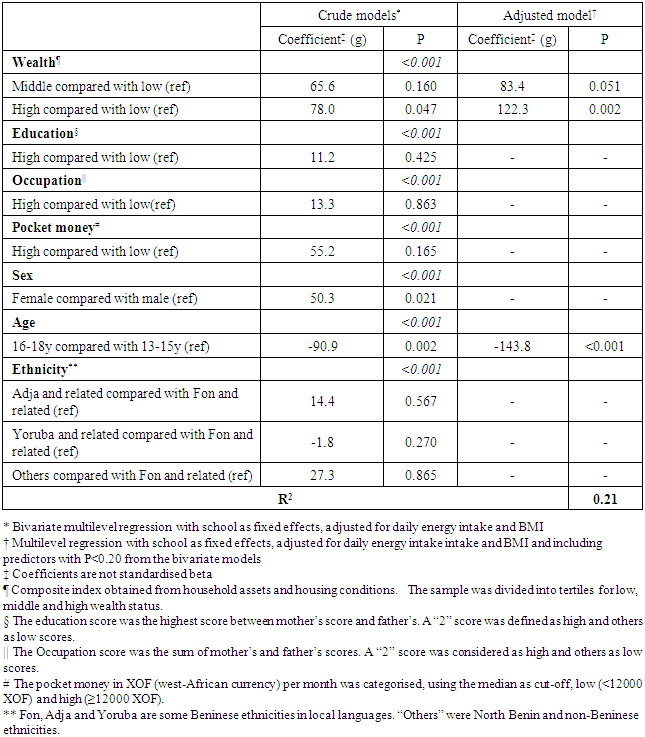
Adolescence constitutes a good period to shape lifelong healthy eating habits to prevent excess weight and related chronic diseases. This study identified socioeconomic and demographic factors associated with the consumption of healthy and potentially harmful food groups among adolescents in urban Benin, as a contribution for the development of diet promotion interventions. Data were collected from 408 participants aged 13 to 19 years in 12 secondary schools in Cotonou, the biggest city in Benin. Food intake was assessed by two 24-hour dietary recalls and demographic and socioeconomic characteristics, using a questionnaire. Predictors of the consumption of healthy and potentially unhealthy food groups were identified using multilevel regression analysis. Adolescents from wealthier households ate 28g more meat and 122g more sweet foods than those from poor households. Females ate 23g more meat than males, and younger adolescents consumed 144g more sweet foods than the older. It was concluded that in urban Benin, the diet of younger female adolescents from wealthier households is more indicative of changes towards a western diet associated with the risk of obesity and related chronic diseases. This subgroup needs be targeted in priority during promotional activities to improve adolescents’ diet.
Keywords: Influencing factors, Diet, Food groups, Nutrition transition
Cite this paper: Eunice Nago, Saturnin Houndji, Sherifath Mama Chabi, Socioeconomic and Demographic Differences in Food Group Intakes of Adolescents in Urban Benin, Food and Public Health, Vol. 9 No. 5, 2019, pp. 148-157. doi: 10.5923/j.fph.20190905.02.
Article Outline
1. Introduction
- In low- and middle- income countries (LMIC), health systems face a great challenge with chronic diseases occurring at a faster rate than in affluent countries [1]. This situation is due to accelerated dietary and lifestyle changes concomitantly with industrialisation, urbanisation, economic development and market globalisation [2]. Observed dietary changes show a transition from traditional plant-based foods towards energy-dense animal-based foods with high contents of saturated fat, added sugars and less complex carbohydrates and fibre [3]. Promoting healthy eating habits is crucial to reverse this trend. As bad eating habits are common among adolescents, they should be prioritized in these interventions. Moreover, their dietary behaviour does not only threaten their current health status but may also impede their well-being in adulthood [4,5] and by consequence, the society as a whole [6]. Adolescents’ nutrition and health have also gained renewed attention at international level [7]. It is evidenced in high-income countries (HIC) that lower socioeconomic groups have poorer quality diet. A review shows adults of higher socioeconomic status are more likely to consume whole grains, lean meats, fish, low-fat dairy products and fresh fruits and vegetables [8]. A socioeconomic gradient is also observed in adolescents’ diet. For instance, a positive association exists between the intake of healthy food groups (like fruits and vegetables) and income [9,10,11,12,13] or parental education level [10,11]. Demographic factors, such as gender and age, also relate to dietary quality in adolescents [10,11,14]. Residence in urban areas is also an important factor [13,15]. Therefore, socioeconomic and demographic factors should be considered in the development of dietary improvement interventions for adolescents, in order to target the most vulnerable.We previously assessed the dietary intakes of adolescents from targeted secondary schools in Cotonou, the biggest city of Benin Republic [16]. The present paper goes beyond this step by assessing socioeconomic and demographic factors associated with the consumption of healthy and potentially harmful food groups in the same sample. No previous study has investigated socioeconomic and demographic factors related to adolescents’ diet in Benin. This paper will contribute to filling this gap and identifying critical factors to consider in the development of nutritional interventions among urban adolescents.
2. Material and Methods
- Data were collected by trained nutritionists using a cross-sectional design. The study language was French. The food intake survey was coupled with anthropometric measurements. Demographic and socioeconomic data were collected from the same participants afterwards. More details regarding sampling and data collection procedures of the anthropometric and food intake survey have been reported elsewhere [16].
2.1. Participants
- The Beninese education system has 4 cycles which are nursery school, primary school, secondary school and university. Secondary school consists of 7 grades and is attended by students aged 11 to 18 years. Participants in the study were selected in fifth grade at secondary school. Students at this level are generally above 13 years of age and we expected they could answer survey questions correctly. We used a maximum age limit of 19 years as additional criterion considering the definition of the World Health Organization (WHO) stating adolescents are between the ages of 10 and 19 years. The minimum sample size required was estimated at 188, using the Schwartz formula: N = dZ2pq / i2 [17]with N: sample size; d: design effect (2); Z: standard deviation (1,96) corresponding to a 5% risk of error; p: contribution of the food groups considered (0.18) to the daily weight of foods consumed by the students, here fruits and vegetables which had the highest contribution [16]; q = 1 - p = 0.82; i: precision (10%).The list of all private (n = 109) and public (n=18) secondary schools that have the fifth grade in Cotonou was provided by the Beninese Ministry of Primary and Secondary Education. Among the schools we could locate in the city (97 private and 18 public schools), we randomly selected 10% of each category, that is ten private and two public schools. Permission was granted by school headmasters for all research activities. Information sessions were held for all fifth graders and parents were also informed of the study objectives by a letter. In total, 553 adolescents (73% of fifth graders aged 13 to 19 years in the selected schools) provided written parental consent and participated in the study. This sample size was far above the minimum sample size required (188). A 13th school was also selected for pretesting. The study was approved by the Direction of Health Research of the Beninese Ministry of Health.
2.2. Data Collection
- Participants’ height and weight were measured twice following standard procedures [18]. The average of both measurements was used to calculate the Body Mass Index (BMI). Sex and age-specific cut-offs of the International Obesity Task Force were used as reference to identify thin, overweight and obese adolescents [19,20].Socioeconomic data. Data collection was done using a self-administered questionnaire. In each classroom, students filled in the questionnaire while being assisted by 2 interviewers who read questions loudly, one by one, and clarified details. In LMIC, socioeconomic status is usually estimated by income, education and occupation [21]. As in previous studies [22,23], we used parents’ data on education, occupation and wealth as indicators of the adolescents’ socioeconomic status. Wealth is commonly substituted to income in LMIC as reliable income data are difficult to collect and household durable assets and housing conditions used as a proxy of wealth [24]. For this, we used here variables from Health and Demographic Surveys and population census of Benin [25,26]. We used television, home phone, fridge, car and gas cooker, with a yes/no option, as household assets. For housing conditions, electricity (yes/no), source of drinking water, toilet facility, materials of walls, roof and floor were utilized. Household assets and electricity were dichotomised (1: yes and 0: no). The remaining five variables referring to housing conditions were coded “0: low condition”, “0.5: middle” and “1: high”. A wealth score was computed by summing the eleven variables and was categorized using tertiles: low (score <9), middle (score ≥9 and <11) and high (score =11) wealth status. For instance, a subject with a “0.5” for source of drinking water and toilet facility respectively, and “1” for the other variables would get a “10” as wealth score and would be classified in the “middle” category. Cronbach's alpha (α=0.74) for the wealth score was satisfactory. This method was also used in other studies [27,28].Participants were questioned about the level of education of their mother and father separately. This was coded: “0: no schooling or primary school”, “1: secondary school” and “2: higher”. The parental education score was defined as the highest between mother’s score and father’s score as done elsewhere [22]. For instance, a subject with a “1” as mother’s score and a “2” as father’s score would get a “2” for the parental education score. We defined adolescents with a “2” score as having a high education score and others as having a low score.Participants were also asked whether their parents worked. This was coded 0/1 for no/yes and separately for mothers and fathers. Retirement was considered as “yes” since the retired still get a pension which we considered as an income for the household. We summed up the two parents’ scores to get a unique occupation score with values: 0, 1 and 2. Participants with a “2” score got the high and others the low occupation score. We added a question about pocket money defined for the purpose of this study as “the amount of money the adolescents received from their parents for their own expenses”. Pocket money was considered important as it refers directly to the adolescents’ purchasing power. The sample was subdivided in two categories (low and high) using the median of 12000 XOF (west-African currency ≈ 18 euro) per month as cut-off.Demographic data. Participants were asked about their ethnicity. We used the classification of the Beninese National Institute of Statistics [25,26] and grouped answers into four categories: Fon and related, Adja and related, Yoruba and related and “Others” which grouped the least represented ethnicities of the sample (North-Beninese and non-Beninese ethnicities). Other demographics considered were sex and age which was determined from participants’ date of birth in school registers. Two age categories were created, 13-15 and 16-19 years old, to separate young and older adolescents since previous studies suggest a worsening of dietary habits during late adolescence [11,29,30]. Food intake data. Participants’ food intake was assessed using two 24-hour dietary recalls on two non-consecutive school days in a single week. The procedure for the dietary recalls was based on Gibson and Ferguson’s manual for developing countries [31]. Face-to-face interviews were used to record information on standardised recall forms. More details on the dietary assessment were reported previously [16]. The average intake of each food group (in grams) for the two survey days was used as its daily intake. Although 24-hour dietary recalls do not assess habitual intake, they are appropriate for the estimation of mean food group intakes of a sample. Moreover, dietary recall data collected on at least 2 days are sufficient to analyze the association between dietary and non-dietary variables measured on the same participants [31,32,33].Twelve food groups were defined based on the classification of the West African Food Composition Table [34]. The original food groups “vegetables and their products” and “fruits and their products” were merged to estimate the overall fruit and vegetable intake. “Eggs and their products” and “milk and their products” were also merged into a unique group as we knew their intake was low in the sample [16]. Sweet beverages were not put in the “beverages” food group but in a new group, “sweet foods”, which also comprised candies, chocolate and lollipops. This was meant to estimate overall intake of this potentially harmful food group. Finally, food groups were the following: (1) cereals and their products; (2) starchy roots, tubers and their products; (3) legumes and their products; (4) nuts, seeds and their products; (5) fruits, vegetables and vegetable products; (6) meat, poultry and their products; (7) fish and their products; (8) eggs, milk and milk products; (9) fat and oils; (10) sweet foods; (11) other (unsweetened) beverages and (12) miscellaneous, like condiments and coffee. Bananas and potatoes were put in the food group “starchy roots, tubers and their products”, and not in the “fruits, vegetables and vegetable products” group, as they are starchy and energy-dense.
2.3. Statistical Analysis
- Stata software (Intercooled Stata version 10, College Station, Texas, USA) was used for statistical analyses. A Box-Cox transformation was applied to highly skewed variables before analysis. To determine correlates of the daily intakes of the food groups, we ran a multilevel regression analysis, xtreg command [35], using school as fixed effects. Fruits, vegetables and vegetable products were regarded as healthy food groups [36,37,38], and so were protein sources: legumes and their products; nuts, seeds and their products; fish and their products; eggs, milk and milk products. Meat, poultry and their products, fat and oils, and sweet foods were considered potentially harmful food groups [2,39]. The multilevel regression included 2 levels: students as the first level and schools as the second level. We first used bivariate multilevel regression to test crude associations of socioeconomic and demographic factors with the dependent variables. Factors with P <0.20 were then introduced in a multivariate model. In a previous study in Vietnam, another LMIC, pocket money was shown to influence food group consumption in rural and urban adolescents [23]. Hence, the interaction terms of pocket money/sex and pocket money/age were inserted in the models. Collinearity was tested using the “colldiag” command. Interaction terms were considered significant at P<0.05. The regression analyses were adjusted for total daily energy intake and for BMI by including these two variables in the models. All tests were two-sided and a significance level of 0.05 was used, except for the bivariate regression models. R-squared values are reported in the results to explain how much of the variance in the dependent variable was explained by the multivariate model.
3. Results
3.1. Description of the Sample
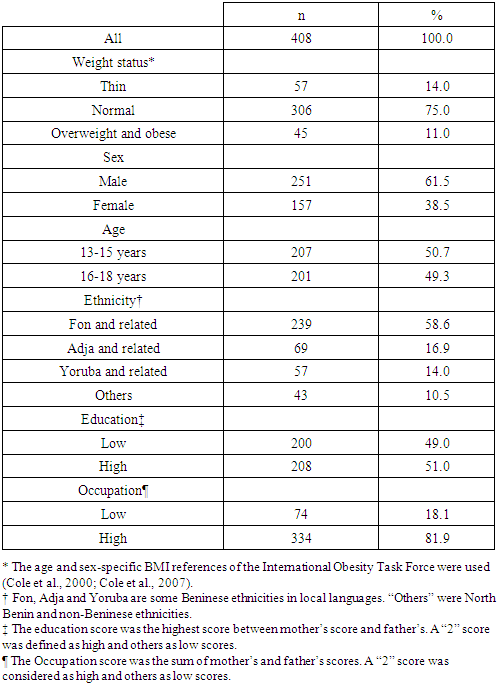
- In total, 408 students (74% of the sample) had full demographic, socioeconomic, anthropometric and food intake data on the 2 recall days. Compared to the other students, the final 408 participants were not different for daily energy intake (P=0.493) and daily intakes of fruits, vegetables and vegetable products (P=0.929), cereals and cereal products (P=0.355), meat, poultry and their products (P=0.282), fish and their products (P=0.919) and sweet foods (P=0.728). Participants’ mean age was 16.2±1.3 years and the mean BMI was 20.6±3.5 kg/m2. Mean prevalence of overweight and obesity was 11.0% and for thinness, it was 14.0%. The following demographic and socioeconomic categories were more frequent: males (61.5%), Fon and related and adolescents with a high parental occupation level (Table 1).
|
3.2. Socioeconomic and Demographic Predictors of Food Group Intakes
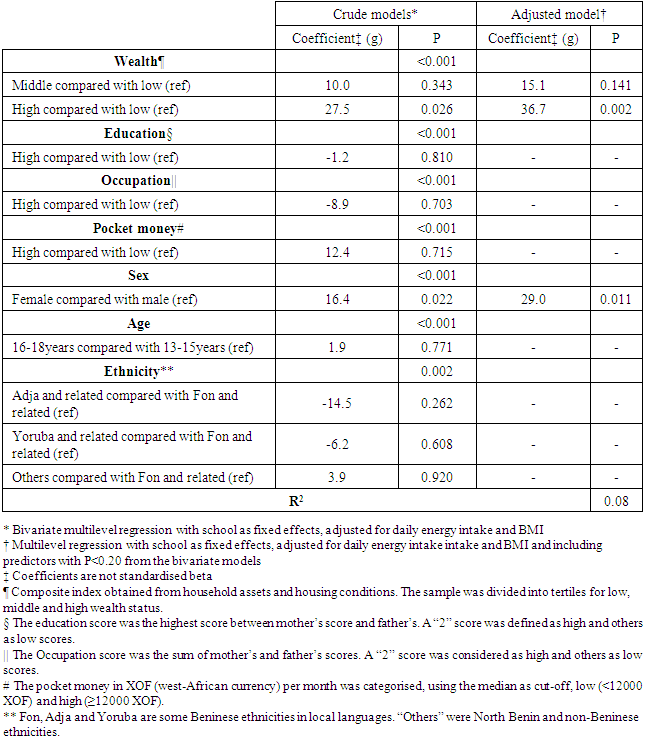
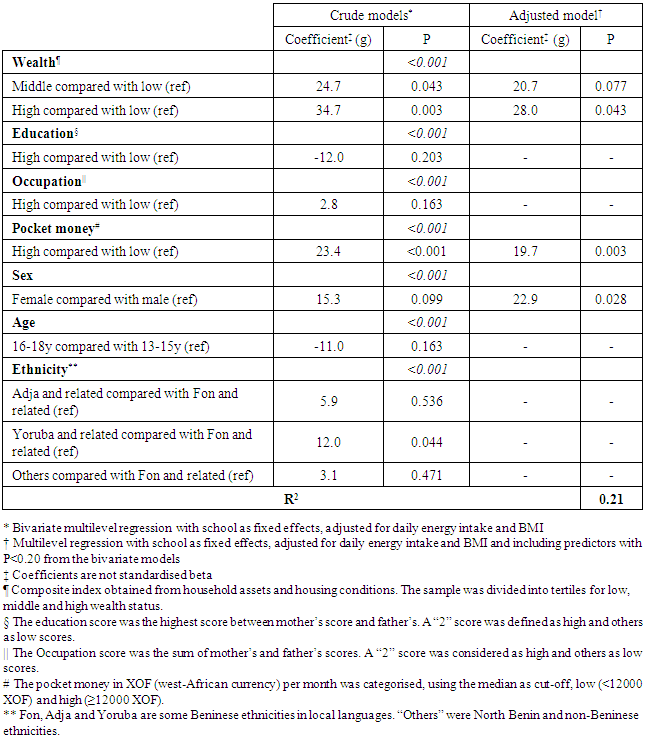
- Healthy food groups. Wealth status and sex were positively associated with the daily fruit and vegetable intake, independent of age, ethnicity, parental education, parental occupation and pocket money of the adolescents (Table 2). In particular, the highest wealth group was likely to consume 37g more fruits and vegetables compared to the lowest category and females, 29g more compared to males. Interactions terms, pocket money/sex (P=0.397) and pocket money/age (P=0.959), were not significant. The model explained 8% of the variance in fruit and vegetable intake.
|
|
|
|
4. Discussion
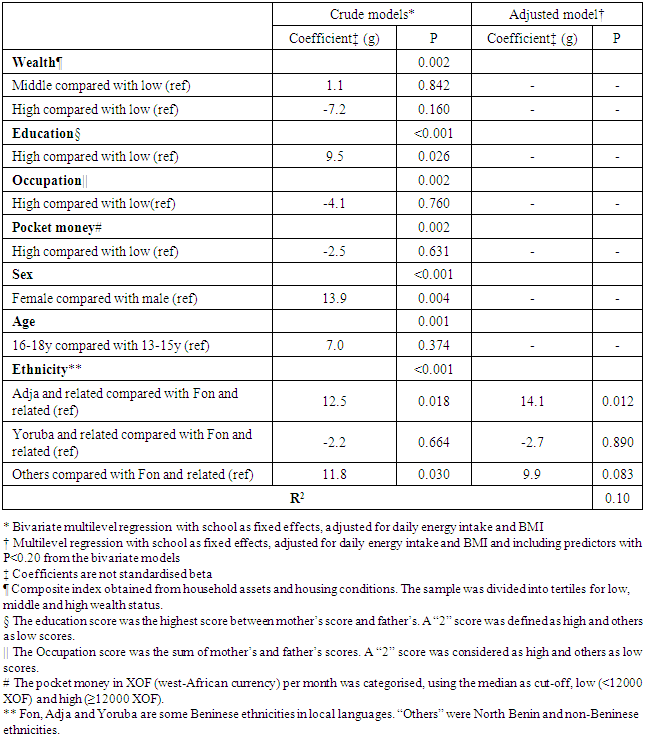
- In the present paper, we aimed at identifying socioeconomic and demographic correlates of healthy and potentially harmful food groups consumed by adolescents in urban Benin, a low-income west-African country. Contrary to what we hypothesised based on what is observed in HIC, we did not find a clear socioeconomic gradient in the adolescents’ food intake. In HIC, adolescents of low socioeconomic position have a lower consumption of healthy foods than those with a high socioeconomic status [9,12,13,14,40]. In general, the mean fruit and vegetable intake in our whole sample was very low (97g per day) and the average intake of sweet foods was high (304 g per day). However, adolescents from the higher wealth category consumed more fruits, vegetables and vegetable products which are generally considered as healthy foods [36,37,38]. At the same time, they ate more sweet foods and more meat, poultry and their products, both perceived as potentially undesirable food groups [2,39]. Our findings show that adolescents from wealthier households ate more meat, poultry and their products, and more sweet foods, but also more fruits, vegetables and vegetable products than their counterparts. Differences in food group intakes between wealth categories may be explained by differences in the cost of food products. Meat, poultry and their products included items like mutton, beef, pork, poultry and imported industrial products like corned beef, ham and sausages, which are generally expensive. This probably explains why the higher wealth category consumed more meat, poultry and their products than the lower class. This also held true for sweet foods, as well as fruits, vegetables and vegetable products. Among adolescents in Cotonou, fruit and vegetable consumption was previously shown to be limited by its cost. Adolescents from poorer households were likely to have lower fruit and vegetable availability and accessibility and to consume less fruits and vegetables than those from wealthier families [40]. Mostly consumed fruits were local items like tomatoes, pineapples, papayas, mangoes, oranges but also exotic fruits like apples. Mostly consumed vegetables were carrots, cabbage and, mainly, green leafy vegetables consumed in traditional sauces. Sweet foods consisted mostly of imported products including candies, chocolate, sweet beverages and lollipops but also some locally-made beverages and lollipops. In a study in Mexico, adolescents of higher socioeconomic position also consumed more vegetables and meat. However, contrary to what we observed, they had a lower intake of sweet drinks [27]. On the contrary, in Chinese adolescents, the consumption of soft drinks was also lower in the low socioeconomic group [42] as was the consumption of sweet foods in our study, and so was their fruit intake. The main difference between these two studies and ours is that the authors used food frequency to assess food group consumption and not food weight as we did. In the present study, demographic factors were also associated with the adolescents’ dietary patterns. Females ate more meat, poultry and their products, but also more fruits, vegetables and vegetable products than males. Younger adolescents were likely to consume more sweet foods. Other studies reported that demographic factors, like age and sex, influence adolescent food intake in HIC [10,11,14]. Information about LMIC indicate there was no sex or age difference in the consumption of meat, fruits, vegetables, soft drinks and sweets by Mexican adolescents [27] and no difference between adolescent girls and boys for fruit and vegetable intake in Costa Rica [43]. On the contrary, Chinese adolescent girls consumed more fruits and vegetables than boys [42]. Higher consumption of fruits, vegetables and vegetable products by adolescent girls in urban Benin may be because females are generally considered more health-conscious than males [44,45], what was also shown in adolescents [46]. The effect of ethnicity was not pronounced and this factor only affected the consumption of fish and their products. This may be explained by the fact that “Pla” and “Pedah”, which are part of the Adja and related group, are main ethnicities of Beninese fishermen.The diet of the high wealth category in our study reflects to some extent the nutrition transition characterised by higher intakes of sugary foods and animal products [3]. In the high wealth category of our sample, a fruit and vegetable intake higher than in the low wealth category was also observed, indicating that some features of the traditional Beninese diet remains in place. The duality in the adolescents’ diet was also present in girls and younger participants. Adolescents receiving more pocket money also had a higher intake of meat, poultry and their products. The amount of pocket money is likely to reflect household wealth to some extent and this might explain why pocket money was associated with the intakes of meat, poultry and their products in the same way as household wealth. Students who got more pocket money could probably afford more meat, poultry and their products than their counterparts since these products are relatively expensive. In a recent study in Vietnamese adolescents, the amount of pocket money was associated with the consumption of meat, poultry or offal [23].The models in our study only predict the variability in different food group intakes to a certain level, varying from 8% for fruits, vegetables and vegetable products to 21% for sweet foods and meat, poultry and their products. Other studies reported comparable variability values (R²), for instance for vegetable intake [47,48]. Reinaerts et al. showed how adding more factors in fruit and vegetable intake models increased the R² up to 0.50 [48]. Additional predictors of food group consumption by adolescents should be investigated. For instance, home availability and accessibility of fruits and vegetables were reported for industrialised countries [11,48,49] and is a plausible determinant in urban Benin too [41]. Estimates of food intake from 24-hour recalls are subject to lapse of memory and this could have affected our estimation of food group intakes. However, effort was made during the 24-hour recalls to reduce memory bias, for instance by making a final check with the participants to recall eventually forgotten foods and by presenting common household utensils to them as physical aids to estimate portion sizes. The fact that some participants were lost between the dietary assessment and the collection of socioeconomic and demographic data could not affect our findings and conclusions since these participants were not different from those who remained in the study for daily intakes of energy and food groups. Moreover, we assumed that the adolescents’ socioeconomic status did not change since parental education and occupation, as well as housing conditions and the household assets that we used, are all durable and would not have changed between the food intake survey and the demographic and socioeconomic assessment. The categorisation of socioeconomic and demographic characteristics is somewhat subjective but we used standard variables used by the Beninese National Institute of Statistics during nationwide population census and demographic and health surveys.
5. Conclusions
- The present study is the first that attempted to understand socioeconomic and demographic factors associated with food group consumption among adolescents in urban Benin. Our results show that socioeconomic status and demographic factors, in particular household wealth, age and sex, do influence dietary patterns of urban Beninese adolescents. The higher intakes of meat and sugary foods in adolescents from wealthier households, and female or younger adolescents exemplify dietary changes occurring in LMIC towards a western diet which may be detrimental. Our findings indicate a school-based nutrition intervention to improve adolescents’ eating habits in urban Benin may target in priority younger females from wealthier households.
ACKNOWLEDGEMENTS
- EN designed the study, collected the data and drafted the manuscript. SH and SMC contributed to data analysis and to the finalization of the manuscript. None of the authors declares a conflict of interest. This study was funded by Nutrition Third Word, a Belgian non-profit Organisation.