-
Paper Information
- Paper Submission
-
Journal Information
- About This Journal
- Editorial Board
- Current Issue
- Archive
- Author Guidelines
- Contact Us
Food and Public Health
p-ISSN: 2162-9412 e-ISSN: 2162-8440
2018; 8(5): 107-113
doi:10.5923/j.fph.20180805.02

Effects of Different Cooking Methods on Chemical Composition and Quality Indices of Beef Steaks
 Abstract
 Reference
 Full-Text PDF
 Full-text HTML
Jegede O. B.1, Ogunwole O. A.2, Omojola A. B.1, M. D. Olumide3, A. O. Mosuro2
1Animal Products and Processing Unit, Department of Animal Science, University of Ibadan, Ibadan, Nigeria
2Agricultural Biochemistry and Nutrition, Department of Animal Science, University of Ibadan, Ibadan, Nigeria
3Department of Animal Science, School of Agriculture and Industrial Technology, Babcock University, Ilishan Remo, Ogun State, Nigeria
Correspondence to: Ogunwole O. A., Agricultural Biochemistry and Nutrition, Department of Animal Science, University of Ibadan, Ibadan, Nigeria.
| Email: |  |
Copyright © 2018 The Author(s). Published by Scientific & Academic Publishing.
This work is licensed under the Creative Commons Attribution International License (CC BY).
http://creativecommons.org/licenses/by/4.0/

Processing methods are aimed at enhancing the quality of meat products. However, safety of heat-processed meat is an important global issue as cooking may leads to formation of toxic substances like heteroyclic aromatic amines (HAA) and polycyclic aromatic hydrocarbons (PAH). There is dearth of information on effects of different cooking methods on quality attributes of beef steaks. Thus, quality attributes of beef steaks using different cooking methods were assessed in this study. Beef steaks (n=224) of uniform size and shape were selected and assigned randomly to different cooking methods: Deep frying at 180°C (DFBS); Smoking 300°C (SBS); Microwaving 600 watt (MBS) and Roasting 200°C (RBS) to attain inner temperature of 75°C. The concentrations of benzo (a) anthracene (ɥg/kg) 1.85 (DFBS), 1.75 (SBS), 1.67 (MBS) and 0.83 (RBS) differed highly significantly (p<0.0001). 2-Amino-3-methyl-3H-imidazo (4, 5-F) quinoline (IQ ng/g) of 4.05 (DFBS) was significantly (p<0.0001) higher than 3.97 (SBS), 3.61 (MBS) and 2.25 (RBS). However, product yield (%) 47.81 (MBS), 46.13 (DFBS), 42.43 (RBS) and 40.13 (SBS) were significantly (p<0.0001) different. Also, the crude protein (%) of RBS (66.73) was significantly (p<0.0001) higher than DFBS (57.18), SBS (52.11) and MBS (47.75). The arachidonic acid (mg/L) 0.018 (DFBS), 0.012 (SBS), 0.012 (RBS) and 0.008 differed significantly (p<0.0001). Linoleic and oleic acids of DFBS (0.017), SBS (0.012), RBS (0.011) and 0.008 (MBS) were similar however, fatty acids of the four products were significantly different (p<0.0001). Cholesterol content (mg/100g) 959.11 (DFBS) was significantly higher (p<0.0001) than 666.23 (MBS), 505.23 (SBS) and 366.43 (RBS). Study showed that deep frying increased PAH, HAA and cholesterol content of beef steak while roasting reduced their formation.
Keywords: Polycyclic aromatic amines, Heterocyclic aromatic amines, Products yield, Crude protein, Essential fatty acids, Cholesterol
Cite this paper: Jegede O. B., Ogunwole O. A., Omojola A. B., M. D. Olumide, A. O. Mosuro, Effects of Different Cooking Methods on Chemical Composition and Quality Indices of Beef Steaks, Food and Public Health, Vol. 8 No. 5, 2018, pp. 107-113. doi: 10.5923/j.fph.20180805.02.
1. Introduction
- Cooking of meat products at high temperatures has been reported to lead to generation of mutagens or carcinogens [1]. [2] It posited that a variety of heterocyclic amines and polycyclic aromatic hydrocarbons in heat-treated meat products were formed with different cooking methods. The HAA and PAHs concentrations in meat increase with longer cooking time and higher temperature as well as the fat content [3]. [4] It showed that PAHs and HAAs that are known mutagens and carcinogens are transferred into a range of meats which therefore may make the product unsafe for consumption. These substances have been related with cardiovascular diseases, colorectal and breast cancers [5]. Studies have demonstrated that carcinogenic PAHs are present in food, being formed through the grilling, roasting, barbecuing and smoking of foods [6-8]. [9] It labelled several heterocyclic amines as likely carcinogens. The PAH and HAA formation during cooking have been noted to depend on type of meat, cooking temperature, degree of browning and the cooking time. More of these chemicals are formed when pan surface temperatures are higher than 220°C (428 °F) such as with most frying or grilling [9]. [10] It reported that the range of HAAs (IQ, IQx, MeIQx, DiMeIQx, and PhIP) found in the ready to eat meats (beef, pork and turkey hotdogs) was 0.05-13.07ng/g. The total HAAs in fried pork (13.91 ng/g, PhIP accounting for 9.20 ng/g) were significantly higher than those in fried beef (8.92 ng/g, PhIP accounting for 6.60 ng/g) and fried chicken (7.06 ng/g, PhIP accounting for 6.06 ng/g) at 204°C temperature [11]. [12], in charcoal grilled (well done) chicken breast found PhIP (31.1 ng/g), 4,8-DiMeIQx (4 ng/g), and MeIQx (1.2 ng/g). The lower content of total HAAs in fried chicken (1.01 ng/g), fried pork (0.5 ng/g), and fried beef (0.1 ng/g) when cooked to well-done (internal temperature 75°C for chicken, 88°C for pork, and 78°C for beef) was reported [13]. [14] It reported that Danish smoked meat contained a maximum of total PAH (n = 27) prepared by direct smoking to be 1387 mg/kg. Levels as high as 200 mg/kg in food have been found for some individual PAHs in smoked meat products [6] [15]. [16] It showed that sum of PAH was highest in barbecued beef (average 17.3 μg/kg) compared with pork (average 2.6 μg/kg) and chicken (average 1.1 μg/kg). BaP levels in beef steaks were found to be 4.9 μg/kg [17] and barbecued pork 1.8 μg/kg [18].Cholesterol is an essential structural component of all animal cell membranes that is required to maintain both membrane structural integrity and fluidity. Too much cholesterol, high levels of Low density lipoprotein in particular, may cause atherosclerosis, a condition in which plaque is deposited in artery walls, blocking the blood flow to vital organs, which can result in high blood pressure or stroke [19]. Since cooking has been associated with production of toxic substances, there is therefore, the need to assess the safety of different cooking methods and their influence on beef steak quality and chemical composition.
2. Materials and Methods
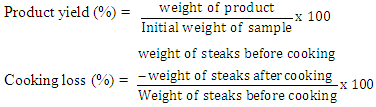
- Beef loin was purchased within one hour post mortem and transported in an ice pack container to the laboratory. The meat samples were trimmed off of all visible fat, ligament and bones. Each chunk was cut into steaks of about 40g each. A total of 224 steaks of uniform size and shape were selected and assigned randomly to each cooking method (deep frying at 180°C, smoking at 300°C (traditional kiln smoking using hard fire wood flame from burning Tectona grandis), microwaving at 600 watt and roasting at 200°C) and were replicated four times in a completely randomised design. The cooking was done until a core temperature of 75°C was attained with certified meat probe thermometer.Each of the differently cooked steak was oven dried at 60°C and then ground into powder. Precisely, 100g of each ground samples was immersed into 500 mL distilled N-hexane and was left for 72 hours with intermittent stirring after which, the samples were drained of distilled methanol 500 mL into each samples and kept for another 72 hours with intermittent stirring. The methanol extracts from the mixture were decanted and then concentrated; thereafter the concentrated methanol extracts were subjected to gas chromatography mass spectrophotometry (GCMS).The GCMS analysis was performed using an Agilent GC 6890 (Santa Clara, CA, USA) with automatic sample injection by a heated transfer line (300°C) interfaced to an Agilent MS 5973 (Palo Alto, CA, USA) in electron ionisation mode with an electron impact of 70 eV. The analysis was carried out according to [13] using a DB-5MS capillary column from J and W Scientific (50 m×0.25 mm i.d. × 0.25 μm film thickness). The PAHs and HAAs were identified by comparing responses with those of standard mixtures. The criteria for identification was the same retention time as the standard within ±2%, and corrected relative abundance of two characteristic ions within ±15% as described [13]. External standards of all PAHs and HAAs in toluene were used for calculating the calibration curves, using ready-to-use solutions with concentrations of 0, 1, 2, 10, 30, 100 and 250 ng/mL toluene. All standard curves had correlation coefficients of >0.97. Determination of cholesterol composition of MSB, DFBS, RBS and SBS were carried out by adding 5 mL of chloroform into a conical flask containing 5 g of the sample and ground. Additional 5 mL of chloroform and 10 mL of distil water were added and mixed thoroughly. The mixture was poured into a separating flask and the lower layer was released into a test tube. Accurately 1 mL each of acetic anhydride and concentrated sulphuric acid were added into the separated solution. Green colour was observed at the interface. Absorbance wavelength of the solution was measured in spectrophotometer at 640 nm. Cooking loss and the product yields were determined as follows:
 Statistical Analysis: Data were subjected to descriptive statistics and analysis of variance [20], while means were separated using Duncan’s multiple range test of the same software at α0.005.
3. Results
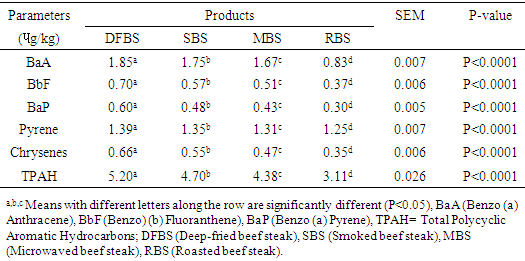
- The PAH concentration of differently cooked beef steaks is shown in Table 1. Benzo[a]Anthracene (BaA ɥg/kg) of DFBS (1.85) was significantly (p<0.0001) higher than SBS (1.75), MBS (1.67) and RBS (0.83). The trend of Benzo [b] Fluoranthene (BbF) for the beef steak was similar to that of BaA except that they were lower. The concentration of Benzo [a] Pyrene (BaP) were significantly (p<0.0001) different across the beef steaks. The DFBS had the highest value (0.60
 ), followed by SBS (0.48
  ), MBS (0.43
  ) and (0.30
  ). The pyrene level (
 ) 1.39 (DFBS) differed significantly ((p<0.0001) from 1.35 (SBS), 1.31 (MBS) and 1.25 (RBS). Chrysenes were also highly significantly (p<0.0001) different and this followed the same trend across the products.
|
|
|
|
|
|
4. Discussion
- In Table 1, the BaA of DFBS (1.84
 ) was significantly higher (p<0.0001) than in the other three beef steaks and RBS (0.83
  ) was least. [21] It reported 0.3
  BaA in smoked beef which was lower than 1.75
  obtained for SBS. The trend of BbF in the beef steak was similar to that of BaA except that they were lower. The BaP were significantly different (p<0.0001) across the beef steaks. The DFBS contained the highest value of 0.60
  , followed by SBS which had 0.48
  , MBS 0.43
  and RBS 0.30
  . There is dearth of information on why DFBS had the highest BaP since it was reported that only charcoal or wood with other precursors like creatine, creatinine and amino acids which influence the deposition of PAH in foods. However, the 0.48 ɥg/kg BaP in SBS was higher than 0.01-0-1
  reported [21]. The pyrene were 1.39
  in DFBS, 1.34
  in SBS, 1.31
  in MBS and 1.25
  in RBS. [21] It did not find any BaP in smoked beef. The chrysene of the differently cooked beef steaks also followed the same pattern with the others but were not found in smoked beef as reported by [21]. The PAHs of 0.30-1.85 ugkg obtained from this study were within the range (1.00-230.04 ugkg-1) reported by [22] for smoked fish. However, PAHs obtained in this study were lower than the maximum acceptable level of 5
  recommended by the [23]. This shows that the differently processed beef steaks were safe for consumption. But it must be noted that DFBS significantly contained the highest PAHs followed by SBS, MBS and RBS. This is an indication that deep frying and smoking were relatively unsafe modes of cooking. The IQ level in DFBS 4.046 ng/g was significantly higher (p<0.0001) than in the other three beef steaks (Table 2). Smoked beef steak which contained 3.970 ng/g was next to DFBS in HAA content followed by microwaved beef steak with 3.606 ng/g and the least content 2.250 ng/g was in roasted beef steak. The higher HAA in DFBS could be attributed to the oil used (1.00-230.04 ugkg-1) in frying and also the presence of other precursors such as creatine and amino acid. The high IQ in SBS also showed that smoking induced IQ formation. Also, 3.606 IQ in MBS could be as a result of meat intramuscular fat since fat has affinity for HAA and other precursors. The RBS was least in HAA which was an indication that roasting was the safest means of cooking. Furthermore, the MeIQx of DFBS (4.326 ng/g) was significantly higher than in SBS (3.613 ng/g), MBS (3.476 ng/g) and RBS (3.396 nglg). The 5.316 ng/g PhIP of DFBS was also significantly higher than 4.280 ng/g SBS, 3.876 ng/g MBS and the least 3.436 ng/g RBS. The PhIP was highest across the differently processed beef steak. These observations were contrary to the report of [11] that no IQx, IQ and MeIQx were in microwaved-cooked pepperoni but 0.01±0.01 ng/g PhIP was found.[24] It reported that a roasted beef contained 23.44±0.77 nglg MeIQ and 26.93±0.29 nglg PhIP, mutton contained 21.01±0.01 nglg MeIQ and 40.21±0.65 nglg PhIP. These values were higher than those obtained in this study. [12] It also showed that HAA present in deep fried and charcoal grilled breast were 0.68ng/g MeIQ, 1.76 ng/g 4,8-DimeIQx, 1.47 ng/g PhIP and 2.74 ng/g IQ, 2.4MeIQx, 11.80 ng/g PhIP. However, but none was found in roasted duck breast. The HAAs of DFBS were higher than the deep fried chicken breast reported by [12]. The SBS was similar with charcoal grilled in the composition of IQ (2.74 ng/g) and MeIQx (2.40 ng/g). The HAA reported by [25] was higher than the values obtained in this study; charcoal grilled beef contained 29.68 ng/g IQ, 15.60 ng/g MeIQ and PhIP was not found, while microwaved pre-heated deep fried beef did not contain any HAA. The MeIQx of beef steak (4.4±0.06 ng/g) reported by [26] was similar to MeIQx in DFBS (4.3 ng/g) obtained in this study. [11] It reported that fried beef contained 3.33±0.38 ng/g MeIQ and 5.27±0.81 ng/g PhIP, similar to the result obtained in this study. A significant increase of 59.29% was observed in the cooking loss of SBS and in 57.83% RBS compared with other steaks as shown in Table 3. This could be related to the open cooking of the two steaks. The beef were directly under open heat source which could cause increased cooking loss as well as melted fat loss. Generally, cooking loss obtained in this study was higher than 28.62-33.5% and 25.4-28.9% reported by [27] and [28], respectively. It has been established that the properties of a final product is usually a reflection of the properties of the meat that was used. The product yield of MBS was highly significantly higher (p<0.0001) than the other steaks. This could be that microwave reduced the rate of moisture loss. However, it was noticed that there was an inverse relationship between cooking loss and the product yield. The MBS with the least cooking loss of 52.44% had the highest product yield of 47.80%. [28] It showed a range of 70.10-73.40% which was higher than results in this study.The cholesterol content of beef steaks differently cooked were significantly (p<0.0001) different. The cholesterol of deep fried beef steak (959.11 mg/100g) was significantly higher than in the other three beef steaks. This could be attributed to the vegetable oil used in frying. The MBS was next in cholesterol content (666.23 mg/100g), this value could be that the beef used was higher in fat content. Steak provides nearly three grams of fat per ounce, which means a three-ounce of steak cut contains about 9 grams of fat. Eating a 3-ounce beef steak for dinner provides approximately 180 calories [29]. The SBS had 505.23 mg/100g cholesterol which showed that smoking reduced fat and cholesterol but not as much as roasting as the value in roasted beef steak was 366.43 mg/100g. This shows that of the four cooking methods, roasting was the best and the safest method of cooking as it reduces the cholesterol content of the beef.The range of recommended cholesterol intake for an adult was between 200 mg/dL and 240 mg/dL as cholesterol boarder line [19]. Therefore, the cholesterol of the beef steaks in this study was higher than the recommended level though, roasted beef steak seems to be close to the cholesterol boarder line (240 mg/dL).As shown in Table 4, moisture in SBS (28.41%) was significantly higher than in MBS (26.45%), RBS (26.38%), while DFBS (18.30%) had the lowest value for moisture. This could be linked with the fact that there was osmosis, which was a movement of water from meat into the medium (oil) used for frying. [12] It found that the moisture contents in deep fried and roasted chicken breasts were 53.77% and 65.81% which were higher than the moisture contents in DFBS (18.30%) and RBS (26.38%) obtained in this study. It however, followed the same trend in that, the moisture content of roasted meat (chicken breast and beef steak) were higher than that of the deep fried meat.The CP was highest in RBS (66.73%) followed by DFBS (57.18%), SBS (52.11%) and MBS (47.75%). This is an indication that roasting as a means of cooking preserved protein in meat. The CP of 66.73% in RBS was similar to a range of 58.5-61.9% reported by [30] for a roasted lamb loin but was higher than 31.41% and 33.97% reported by [12] for roasted chicken and duck breasts, respectively. [12] It reported crude protein of deep fried chicken and duck breasts as 43.69% and 43.79%. While the crude protein of DFBS (57.18%) was similar to the charcoal grilled lamb loin (58.5 %) reported by [30]. Ether extract (15.15 %) was highest in DFBS, followed by MBS (6.46%), SBS (5.97%) and RBS (3.15%). The high EE of DFBS could be attributed to the oil used during frying, while the relatively high value in MBS (6.46) could be attributed to the intramuscular fat content of the meat. But the lowest value in RBS was an indication that there was a reduction in fat content when the meat was subjected to roasting. [12] It showed 4.62% and 1.65% for deep fried and roasted chicken breasts which were very low compared to the values recorded in this study. The ash contents in RBS (3.21%) and MBS (3.21%) were significantly higher (p<0.0001) than in SBS (3.06%) and DFBS (2.36%). The high ash in RBS and MBS was an indication that their mineral contents were higher. Fatty acids content in DFBS was significantly higher than the other beef steaks and this could be attributed to the frying vegetable oil which was unsaturated fatty acids (Table 5). The low values of RBS and MBS for all the fatty acids was an indication that these two cooking methods were the best. It was observed that the ratio of unsaturated fatty acids (Arachidonic, linoleic and oleic acids was higher than the saturated fatty acids (Lauric, stearic and palmitic), which could be of health benefit to consumers. The observations in this study conforms with the report [31] that high stearic acid concentration does not increase cholesterol level but palmitic does. Perhaps, palmitic acid was responsible for the high cholesterol in DFBS. The fatty acids of RBS and MBS were low compared with DFBS which showed that the beef steaks cooked by roasting and microwaving were safe for consumption. The fatty acids of a goat meat products (4-50%) reported by [31] were higher than those obtained in this study.As indicated in Table 6, RBS had the highest minerals contents (Ca-0.958 mg/L, Mg-15.803 mg/L, Na-56.106 mg/L, P-5.005%) except for potassium. This observation was in agreement with those of [32] on mineral concentration in roasted samples and increased mineral content as the thermal temperature increases. It was expected that Ca and Na in DFBS would be higher than in MBS. However, there is a dearth of information on this. It was also noted that K and Na in SBS were lower than in MBS. [33] It reported that the value of K and Na in beef steaks were 279 mg and 58 mg, respectively. The content of Na reported for beef steak was similar with those in RBS (56.106 mg/L) while K composition reported (279 mg/L) was lower than in RBS (437.005 mg/L), MBS (430.503 mg/L) and DFBS (444.503 mg/L) but greater than in SBS (188.505 mg/L).
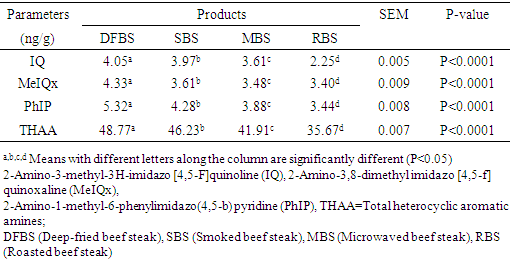
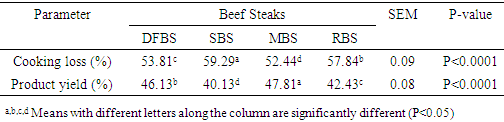
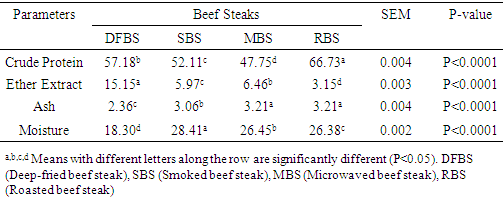
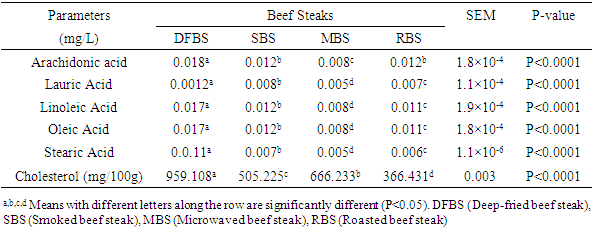
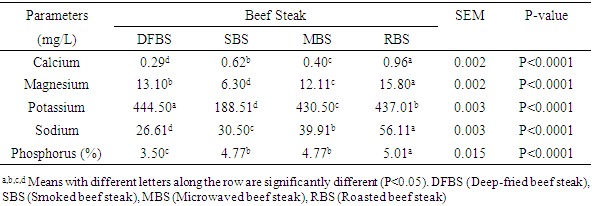
5. Conclusions
- Among the cooking methods used deep frying increased the concentration of PAHs, HAAs, cholesterol and the essential fatty acids of beef steaks. Roasting lowered the formation of the chemicals with improved crude protein and minerals composition of the tested samples of beef steak.