-
Paper Information
- Paper Submission
-
Journal Information
- About This Journal
- Editorial Board
- Current Issue
- Archive
- Author Guidelines
- Contact Us
Food and Public Health
p-ISSN: 2162-9412 e-ISSN: 2162-8440
2017; 7(4): 81-90
doi:10.5923/j.fph.20170704.02

Level of Saturation and Anti-Oxidant Value of Heat and Spice Treated Animal Butter
 Abstract
 Reference
 Full-Text PDF
 Full-text HTML
Natnael Tadesse1, Nigusse Reta2, Netsanet Beyero3
1Department of Food Science and Nutrition, Jigjiga University, Jigjiga, Ethiopia
2Department of Food Science and Nutrition, Addis Ababa University, Addis Ababa, Ethiopia
3Department of Animal Science and Range Land, Wolaita Soddo University, Wolaita Soddo, Ethiopia
Correspondence to: Natnael Tadesse, Department of Food Science and Nutrition, Jigjiga University, Jigjiga, Ethiopia.
| Email: |  |
Copyright © 2017 Scientific & Academic Publishing. All Rights Reserved.
This work is licensed under the Creative Commons Attribution International License (CC BY).
http://creativecommons.org/licenses/by/4.0/

This study aimed to determine the effect of heat and spice treatment on the level of saturation and oxidative stability of both fresh and rancid animal butter. The spices used were ginger, garlic, and Korarima. Two different ratios, 80% animal butter: 20% spices and 90% animal butter: 10% spices were prepared from each butter treatment and various spices. The treatments were packaged in a transparent plastic jar. One group of the treatments stored at 25°C and the other group stored at 65°C to accelerate the oxidation for 3 days while samples were taken for analysis at 0, 36 and 72 hours of storage. Samples were examined for bromine value, peroxide value (PV), p-anisidine value, and free fatty acid (FFA) value. At 65°C free fatty acid value ranged from 1.22mg KOH/g to 3.44mg KOH/g and 1.72 mgKOH/g to 5.71mg KOH/g for fresh and rancid butter after 72 hours of storage, respectively while after 72 hours at 25°C it ranges from 0.44 mgKOH/g to 0.94 mgKOH/g and 1.44 mgKOH/g to 4.61 mgKOH/g for fresh and rancid butter, respectively. At 65°C spice treated butter exhibited lower values of FFA and PV when compared to untreated (UCB) samples for both fresh and rancid butter, but it showed higher bromine and p-anisidine value. It was observed that bromine value of both fresh and rancid butter decreased during storage days at 65°C, whereas the change for all values at 25°C slowed during storage time except for samples of Unclarified fresh butter (UCFB). Higher FFA, PV, p- anisidine and totox values indicated the poor quality contributed by the type of butter and storage deterioration.
Keywords: Anti-oxidant, Spices, P-Anisidine Value, Totox Value, Peroxide Value, Bromine Value, Saturation, Oxidation
Cite this paper: Natnael Tadesse, Nigusse Reta, Netsanet Beyero, Level of Saturation and Anti-Oxidant Value of Heat and Spice Treated Animal Butter, Food and Public Health, Vol. 7 No. 4, 2017, pp. 81-90. doi: 10.5923/j.fph.20170704.02.
Article Outline
1. Introduction
1.1. Background of the Study
- During the past twenty years, the relationship between diet and health has been widely studied and increasing numbers of consumers have been encouraged to improve their eating habits. Moreover, fat consumption, particularly which of saturated fat, is still considered to be excessive. According to the American Heart Association (2004), the daily ingestion of lipids for individuals with normal blood cholesterol levels, should be no more than 30% of the total calorie intake, that of saturated fat no more than 10% of the total calorie intake and cholesterol intake below 300 mg/day.The butter deteriorates by auto-oxidation of fat, what leads to flavor defects after 1 month to 2 years under the cold storage conditions, depending on the temperature of storage, quality of original milk and the proceeding of processes involved in butter manufacturing. Generation of off flavors is accompanied with the formation of hydroperoxides which are harmful to human health. The process of fat oxidation can be prevented by adding natural or synthetic antioxidant substances. However, it was found that the artificial antioxidants, like BHT (butylated hydroxytoluene) or BHA (butylated hydroxyanisole) are not safe for human consumption (are suspected to have carcinogenic activity) [1]. On the other hand, increasing sensitivity of consumers to synthetic ingredients as well as their increasing awareness about the effect of diet on their health contributed to the increasing trend to use natural additives for the stabilization of fat-containing foodstuffs. A safe guarding fat against oxidation is normally done by restricting the access of oxygen or adding antioxidants. Therefore, attention is focused on natural antioxidants [1]. Spices and herbs are known to possess a great potential as the natural antioxidants in food. These antioxidants are polyphenol compounds [2], which are found in all plants and in all parts of the plants (tree bark, stalks, leaves, fruits, roots, flowers, pods and seeds) [1].Ginger and garlic are common spices in Ethiopia. They are a group of esoteric food adjuncts that have been in use for many years to enhance the sensory quality of foods. These spice ingredients impart characteristic flavor, aroma, or piquancy and color to foods. Several researches have documented the use of plant extracts or their essential oils as additives in food which demonstrated antioxidant properties [3].
1.2. Statement of the Problem
- Butter is the major food item used in every part of Ethiopia. It contains important nutrients such as fat, vitamin, cholesterol, and carotene. Animal butter is highly appreciated by the people of Ethiopia. However, in general, it has cholesterol, total lipid and saturated fatty acid. Lipids play an important role in food product quality, making them more desirable by improving the organoleptic properties of flavor, color and texture. On the other hand, the lipid components are susceptible to attack by molecular oxygen, resulting in lipid oxidation which in turn results in fat deterioration.Heat is the major factor that accelerates oxidation of fat. The fats of foods can be deteriorated by oxidation, especially affecting foods containing unsaturated fatty acids [3]. Anti ‐oxidants are huge weapons in fighting on ickiness! Free radicals are constantly running around in the fat (butter), seeking out electrons to fill its valence shell. When we add an anti--‐oxidant, we provide that free radical with those electrons. The radical is content with electron shell and bothers us no more! [4].Antioxidants can act as primary chain breaking oxidants, or as secondary preventative antioxidants. They act as chain breakers by donating hydrogen atoms [5]. Secondary antioxidants reduce the rate of chain initiation by various mechanisms such as scavenging oxygen, decompose hydroperoxides to non-radical species, binding to metal ions, absorb UV radiation or deactivate single oxygen [5].Gingers’ roots and the obtained extracts contain polyphenol compounds (6-gingerol and its derivatives), which have a high antioxidant activity [2].Garlic is rich in selenium and organosulphur compounds, which have pronounced antioxidant activity [6].Korarima (Aframomum corrorima) seeds, pods, leaves, rhizomes and flowers are used in traditional medicine and as spices in southern Ethiopia. The extracts and essential oils of korarima are potentially used as good sources of antioxidants. [7]. Thus the natural anti oxidants such as garlic, ginger and korarima can improve the oxidative stability of fats [4, 5]. In Ethiopia most rural and urban people treat butter commonly by heat and spice for a long shelf life and good flavor. Thus this study aimed to determine the effect of heat and spice treatment on the level of saturation (alteration in the level of multiple bonds) and oxidative stability of both clarified and unclarified animal butter.
1.3. Objective of the Study
1.3.1. General Objective
- The main objective of this study was to determine the effect of heat and spice treatment on the level of saturation and the oxidative stability of animal butter.
1.3.2. Specific Objectives of the Study
- ü To identify the level of saturation and oxidative stability of fresh and rancid butterü To determine level of saturation of both heat and spice treated animal butter.ü To determine oxidative stability of heat and spice treated animal butter.ü To determine oxidative stability of heat and spice treated clarified and unclarified animal butter.
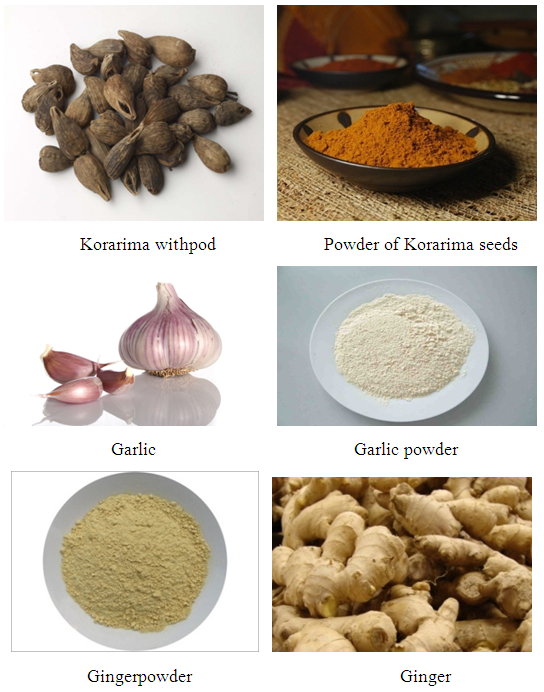 | Figure 1. The spices and their powders used for butter treatment |
2. Materials and methods
2.1. Sample Collection
- The representative butter samples (3Kg of fresh butter and 3Kg of rancid butter) were randomly purchased from local farmers, in Wolaita zone Humbo woreda (Ethiopia) and similarly the spices (ginger, korarima and garlic) were purchased from the local market in Wolaita zone Humbo woreda. The reason for the selection of Wolaita zone for sample collection was that to eliminate the contamination of butter with other foreign matters. All butter samples were then stored in the refrigerator until they were needed for analysis.
2.2. Preparation of Spices
- Ginger and garlic were washed with water. The raw ginger and garlic and the seeds of korarima were placed in the air oven at a temperature about 50°C for two hours to dry. Then ginger and garlic were chopped and returned to the oven for further drying. After drying, the spices (the peeled garlic, unpeeled ginger and the seeds of korarima) were powdered.
2.3. Preparation of Clarified Butter (CB)
- 400g of fresh and 400g of rancid and unsalted butter was slowly heated to 100°C and then boiled until the water vaporized. Once the bubbling was stopped, three layers were remained: whey protein, liquid fat, and casein particles. After the skin of whey protein removed, the fat was poured off, which is the clarified butter. The purpose of clarifying butter was to see the oxidative stability difference between CB and UCB.
2.4. Preparation of Spice Treated Butter
2.4.1. For Fresh Butter
- 1) 400g of unclarified fresh butter (UCFB)2) 400g of clarified fresh butter (CFB)3) 400g of 10% Ginger treated fresh butter (10%GTFB)4) 400g of 20% Ginger treated fresh butter (20%GTFB)5) 400g of 10% Garlic treated fresh butter (10%GrTFB)6) 400g of 20% Garlic treated fresh butter (10%GrTFB)7) 400g of 10% korarima treated fresh butter (10%KTFB)8) 400g of 20% korarima treated fresh butter (20%KTFB)
2.4.2. For Rancid Butter
- The peroxide value and free fatty acid value of the butter were determined before the preparation of spice treated and clarified butter. The rancid butter was the one with off-flavor, peroxide value greater than 1.8meqO2/Kg fat and FFA value greater than or equal to 3.3 mg KOH/g fat. [8]. The samples were prepared as follows:1) 400g of unclarified rancid butter (UCRB)2) 400g of clarified rancid butter (CRB)3) 400g of 10% Ginger treated rancid butter (10%GTRB)4) 400g of 20% Ginger treated rancid butter (20%GTRB)5) 400g of 10% Garlic treated rancid butter (10%GrTRB)6) 400g of 20% Garlic treated rancid butter (10%GrTRB)7) 400g of 10% korarima treated rancid butter (10%KTRB)8) 400g of 20% korarima treated rancid butter (20%KTRB)All the above mixture were then heated until it boils for about 30 min and a clear butter liquid was obtained as final products. The temperature did not exceed 115°C and at which the bulgur starts to gather and precipitate at the bottom of the container. Anhydrous butter fat was decanted and filtered through a piece of cheesecloth, filled in plastic jars and left to solidify. Then from each of the above mixture 90g sample was stored at 25°C and 90g sample stored at 65°C.
2.5. Chemicals and Reagents
- All the chemicals and the reagents were obtained from Food science and Nutrition Centre, Addis Ababa, Ethiopia. The experiment was conducted in the laboratories of Food Science and Nutrition center.Chemicals (All chemicals are obtained from Sigma Aldrich, Germany)-p-anisidine, potassium hydroxide, sodiumthiosulphate, bromine water, starch, phenolphthalein indicator, distill water, ethanol, chloroform, isooctane, glacial acetic acid, potassium iodide, sodium hydroxide, ammonium hydroxide solution, ethyl alcohol, ethyl ether: petroleum ether solution.
2.6. Laboratory Analysis
- Each laboratory determination was carried out on thirteen separate samples (in triplicate).
2.6.1. Determination of Fat Content in Butter
- Before analysis both fresh and rancid butter were clarified and heated to constant weight. Five gram of butter samples was taken and ammonium hydroxide solution was added in to the butter sample and mixed thoroughly. After that ethyl alcohol was added and the mixture was shaken for 1 minute. The fat was extracted from the butter sample three times using the mixture of ethyl ether: petroleum ether. After the extraction period the solvent were evaporated [9]. Then the fat content of butter was calculated as
 Where:M1= weight of the containerM2= weight of the container plus crude fatM3= weight of the sample plus weight of the container
2.6.2. Determination of Moisture Content
- Five grams of butter sample for both fresh and rancid butter were heated to constant weight in a vacuum oven at 102°C, for three hours. Then they were cooled in efficient desiccators, for 30 minute and weighed. Constant weight was attained when successive 1 hour draying periods showed additional loss, 0.05%. [9]. The moisture content was determined using:

2.6.3. Determination of pH Value
- 50g of butter sample was accurately measured and transferred to the test tube. Then the sample was warmed in order to liquefy. The MP511 lab pH meter was calibrated with two standard buffer solutions having pH of 4.00 and 7.00. Then the electrode of the pH meter was inserted into the warmed solution. Between each test, the electrodes rinsed with warm distill water.
2.6.4. Determination of Bromine Value
- 0.5 g of butter was weighed accurately in the conical flask and warmed gently to facilitate dissolution. Then 25 ml of water added into the mixture whilst shaking the flask to disperse the butter and finally the mixture was titrated against 0.0625M bromine water until the bromine water retains its brown color [10].
2.6.5. Peroxide Value Determination
- 5 g of butter was dissolved in 10 ml chloroform in the Erlenmeyer flask and mixed with 15 ml glacial acetic acid and 1 ml saturated KI. Then the mixtures were left in the dark at room temperature for 5 minutes. Then 75 ml of distilled water was added and the mixture was shaken vigorously. Finally 1 ml of 1% starch solution was added and the resulting solution was titrated with 0.002N sodiumthiosulphate until the color become clear. The same procedures were applied to a blank solution (without butter sample) [11]. Then peroxide value was calculated as
 Where: V1 is the amount of Na2S2O3 used for titration (ml), V0 is the amount of Na2S2O3 used for the blank (ml) N is the normality of Na2S2O3 and M is the amount of sample (g).
2.6.6. P-Anisidine Value and Totox Value Determination
- 1 g sample of butter was dissolved in 25 ml of isooctane, (test solution (a)). Then 5 ml of test solution (a) was mixed with 1 ml p-anisidine (0.25% in glacial acetic acid), (test solution (b)). To prepare the reference solution, 1.0 ml of a 2.5 g/l solution of p-anisidine in glacial acetic acid was added to 5.0 ml of isooctane, and the solution was then shaken [10]. Then the absorbance of both test solutions and reference solution were measured at 350 nm. The p-anisidine value was calculated as
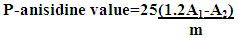 Calculate the anisidine value from the expression:A1 = absorbance of test solution (b) at 350 nm,A2 = absorbance of test solution (a) at 350 nm,m = mass of the substance to be examined in test solution (a), in grams.Finally the totox value was calculated and which was equal to the sum of the p-anisidine value plus twice the peroxide value.
2.6.7. Determination of Free Fatty Acid Value
- 5 g of butter and 30 ml of ethanol were mixed in Erlenmeyer flask. Then few drops of phenolphthalein indicator were added and the mixture was warmed to promote dissolution. The solution was titrated with 0.1N KOH until the pink color was stable at least for 15 seconds [12].
2.7. Statistical Analysis
- Each determination was carried out in triplicate and results were reproduced as an average value (mean ±standard deviations). Data was analyzed by using one-way Analysis of Variance (ANOVA) and SPSS version 15.0 model. Differences between treatments were determined by using Duncan’s multiple comparison tests. Statistical significance was set at P<0.05.
3. Results and Discussions
- The rancid butter is the one with off-flavor, peroxide value greater than 1.8 meqO2/Kg fat and FFA value greater than or equal to 3.3 mg KOH/g fat [13]. The values of each parameter for fresh animal butter were highly less than that of rancid butter except AnV, pH and moisture value.
3.1. Moisture Content
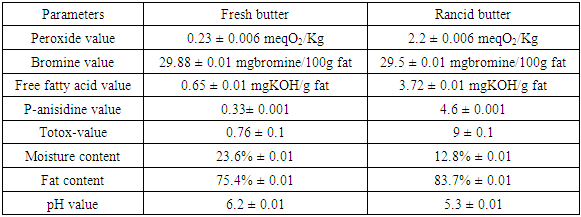
- High moisture content in fats and oils usually leads to increase in microbial load as well as lipid oxidation resulting in rancidity. Moisture contents of animal butter in this study were 23.6% and 12.8% in fresh and rancid butters respectively (Table 1).
|
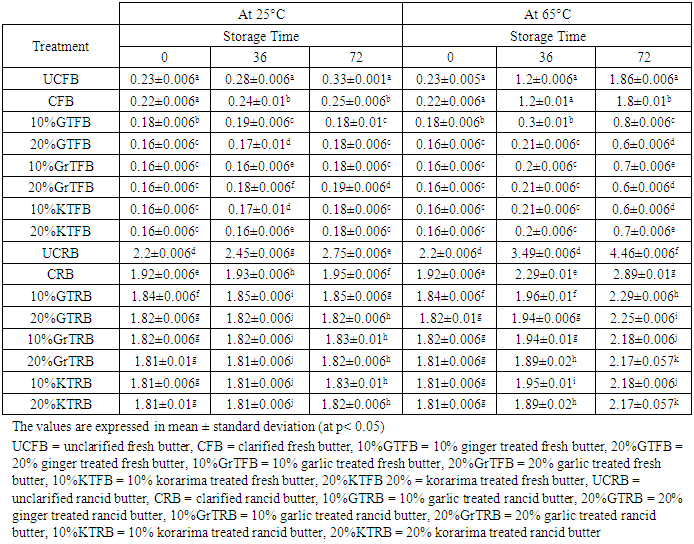
3.2. Free Fatty Acid, pH and Peroxide Value of Butter
- In determining the storage stability and quality of butter, the peroxide value reflecting the oxidation of fatty acids, the amount of free fatty acids and the degree of lipolysis are taken into consideration. When the amount reaches 1.8 mgKOH/g fat, there is a perceptible off flavor in butter. Sample with FFA value exceeding 3.3 mg KOH/g fat were recognized as rancid by 59% of the panelists [8]. An of flavor is also perceived in butter when peroxide value reaches 2 meqO2/Kg fats [13]. The peroxide values were 0.23 meqO2/Kg and 2.2 meqO2/Kg for the fresh and rancid butter, respectively. The FFA values of fresh and rancid butter were 0.65 mg KOH/g and 3.72 mg KOH/g, respectively.
 | Table 2. The average value of the analysis showing the oxidation took place after 72 hours |
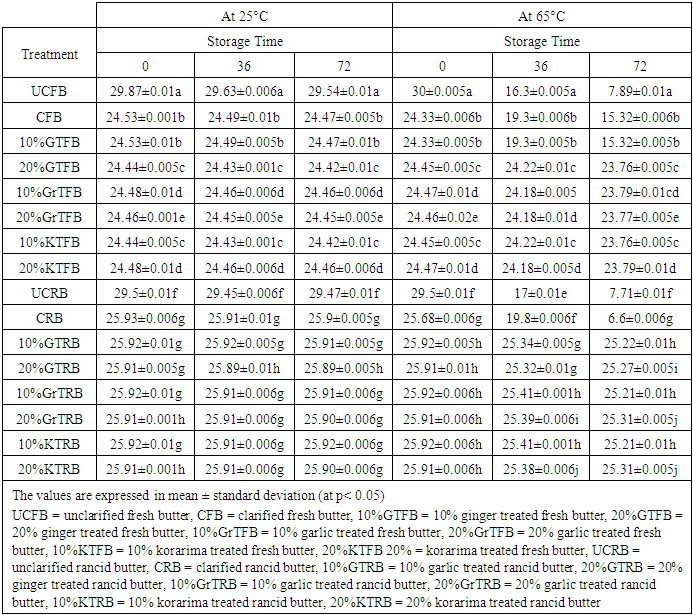
3.3. Bromine Value
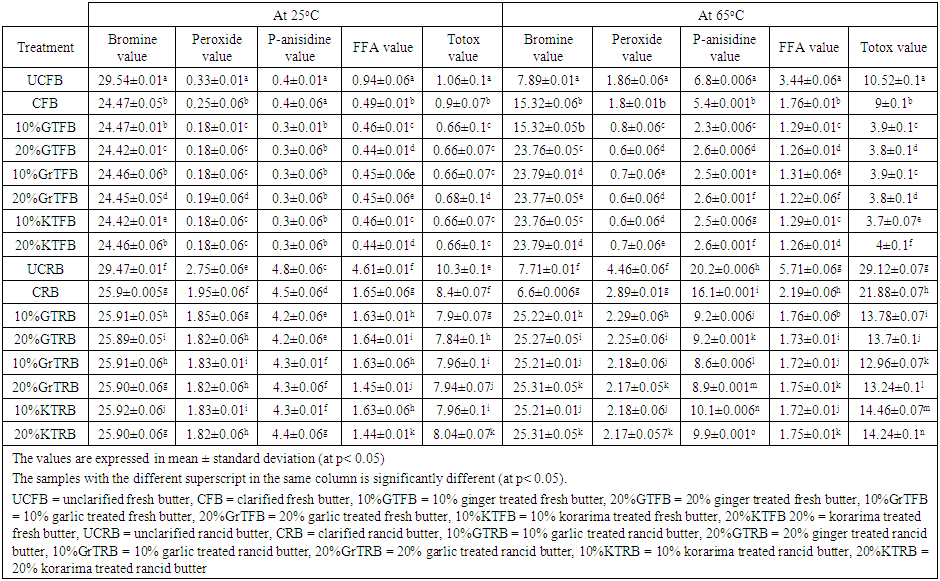
- It was observed that bromine value of all the heat and spice treated butter and untreated butter decreased very slowly as storage days increased for the samples stored at 25°C. But for samples stored at 65°C the bromine values were decreased amazingly. This was probably due to a higher oxidation that took place at 65°C temperature. The treatment had effect on the amounts of bromine value. Reduction of bromine value might be an important measure of the decrease in unsaturated fats and thus resulted in rancidity of butter. Reduction of bromine value was due to oxidation of unsaturated fats and may get promoted by acceleration oxidation of fat with heat [14]. Bromine value went on decreasing with the increase in storage period for all the samples, but no regular pattern of decrease could be observed (Table 3). Unclarified butter (UCB) exhibited the highest bromine value, UCFB =29.54 and UCRB =29.5 at 25°C after 72 hours storage time, while 20% GTFB and 10% KTFB were exhibited the least at 25°C. After 72 hours storage time at 65°C, UCFB= 7.89 and CRB= 6.6 observed to have the least bromine value. The decreases were 3.8 fold for UCFB and 3.89 for CRB. This might be due to the higher amount of moisture content of UCFB butter and the higher content of hydroperoxides in CRB which may resulted in prooxidant effect and so that the butter was significantly oxidized. Garlic treated and Korarima treated butter samples were showed comparable bromine values in reverse proportions for fresh samples and in direct proportions for rancid butter. The increase in bromine value of all samples at 25°C was slow for both types of butter, but it is significantly increased for all samples at 65°C. Spice treated samples showed interesting resistance to the decrease in bromine value than untreated one after 2-3 days of storage at 65°C. The higher bromine value of butter means it was less exposed to the phenomenon of rancidification. Generally, 10% GrTFB and 20% KTFB for fresh butter samples and 20% GrTRB and 20%KTRB for rancid samples were showed the highest oxidative stability and so that had highest unsaturated fats.
|
3.4. Peroxide Value
- According to the data (Table 4), peroxide values continuously increase during the storage period in all of the butter samples. The highest values were produced by UCRB in the samples, 4.46 meq O2/Kg fat at 65°C. This may be due to the higher initial peroxide value of this sample rather than indicating its oxidative stability. The same was true for the samples stored at 25°C. Christensen and Holmer reported similar results in their study in which they stated that the PV value of butter increases as storage time increase. The data reported in Table 4 shows the progress of butter oxidation during storage at 65°C. As in the case of fresh butter, peroxide values were very small at the onset of storage period, ranging from 0.16 to 0.23, which may indicate the good quality of the products. But the case was not true for rancid butter which ranges from 1.81 to 2.2. Furthermore, the heat treatment used during the preparation of clarified butter (CB) had little or no influence on PV. It was evident that the addition of the spices exhibited significant effect in depressing the progress of butter oxidation throughout storage period. Significant differences between the untreated butter and the other treatment in their PV were observed after 1 day of storage time. Peroxide value was in the range 0.6–0.8 meq/kg for spice treated fresh samples after storage up to 3 days at 65°C, while maximum values of PV for UCFB and CFB sample was1.86meq/kg and 1.8 meq/kg respectively.
|
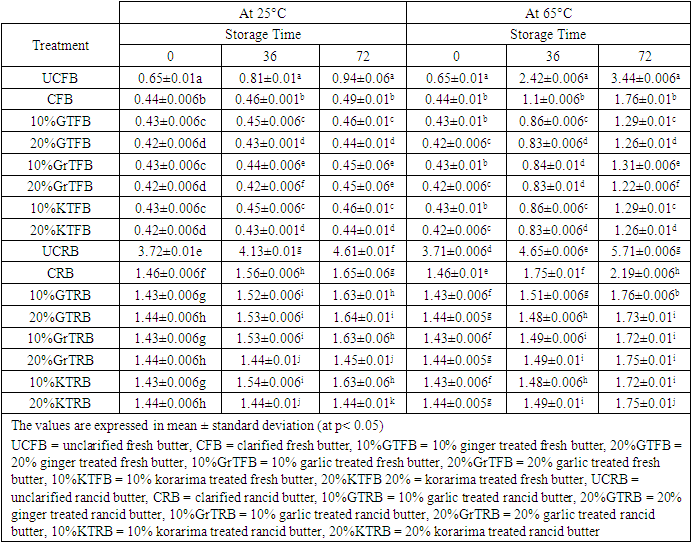
3.5. Free Fatty Acid Value
- The amounts of FFAs determined in butter samples during a storage period of 3 days are presented in Table 5. During storage time, the levels of FFAs in samples kept at 65°C temperatures were higher than in those stored at 25°C temperatures.
|
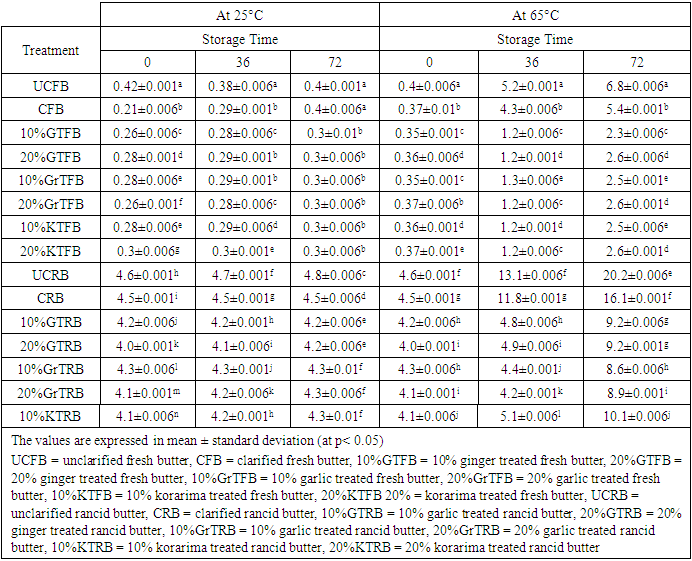
3.6. P-anisidine Value
- The amount of secondary oxidation products is expressed in the pAV. For a good quality fat/oil the pAV should be lower than 10 [19]. It is clear that all the fats had a pAV lower than 10 except the p-anisidine value of UCRB, 14.1 and CRB, 12.2 after 72 hours at 65°C. But at 25°C, all samples had p-anisidine value highly less than 10. From the data, p-anisidine values were increased during the storage period in all of the butter samples at 65°C. The highest values were produced by UCRB followed by CRB and UCFB which are 14.1±0.7, 12.2±0.7 and 5.8±0.7 respectively, which means that oxidative stability was lowest in this type of butter. But for the samples stored at 25°C room temperature it was very low and goes in the same way as the one stored at 65°C. The effects of butter type, storage temperature and storage times were found to be significant (at P < 0.05). Christensen and Holmer, 1996 reported similar results in their study which indicated the increase of p-anisidine value as a function of storage temperature and time. The results of the study showed progress of butter oxidation during storage at 65°C. As in the case of fresh butter, p-anisidine values were very small at the beginning of the experiment. This may indicate the quality of the butter samples. Furthermore, the heat treatment used during the preparation of clarified butter (CB) had little or no influence on it. It was evident that the addition of the spices exhibited significant effect in depressing the progress of butter oxidation throughout storage period. Significant differences between the butter samples in their p-anisidine value were observed after 72 hours of storage. P-anisidine value was in the range 1.3–5.8 for spice treated fresh samples after storage up to 72 hours at 65°C. But the p-anisidine value was in the range 4.6-14.1 for spice treated rancid butter samples after storage up to 3 days at 65°C, while maximum value of p-anisidine value for UCRB sample was 14.1. At all stages, highest p-anisidine value was observed for UCRB sample followed by CRB, UCFB, 10%GTRB, 20%GTRB, CFB, 10%GrTRB, etc respectively. Spice treated butter at both the concentrations for fresh and rancid sample stored at 65°C, controlled p-anisidine value appreciably when compared to un treated butter; revealing good oxidative stability of butter. But in both concentrations garlic is more effective than ginger for rancid butter stored at 65°C. A regular increase in p-anisidine value as a function of storage time was observed for all the samples at all intervals. Initially, the difference in p-anisidine value of unclarified butter (UCB) and spice treated butter samples was not noticeable; it became significant (p > 0.05) just after heating up to one day. After the 72 hours, there was a radical rise in p-anisidine value of UCRB and CRB samples. But having the higher p-anisidine value of UCRB and CRB could not indicate the better oxidative stability of that butter rather than it may be due to the higher initial value and more saturation of the butter. Some authors have indicated that anisidine values are comparable only within each oil type because the initial value varies among oil sources [16]. P-anisidine value for all the spice treated samples also increased but this increase was gradual. The low p-anisidine value could be an indication of the effectiveness of spices in retarding the secondary product formation or that the fats or oils would not easily go rancid and also its good quality.
3.7. Totox Value
- As p-anisidine values (Table 4), totox values were also high for UCRB (10.3 at 25°C and 29.12 at 65°C) and CRB (8.4 at 25°C and 21.88 at 65°C). At 65°C, 10%GTFB and 10%GrTFB, 20%GTFB and 20%GrTFB were not significantly different, but all the rests are significantly different (at p<0.05). But at 25°C, the difference between 10%GTFB, 20%GTFB, 10%GrTFB, 10%KTFB and 20%KTFB was not significant (at p <0.05) after 3 days. So generally totox value was a good indicator of oxidative stability of butter samples.Table 1 and 2 shows that the totox value of UCFB increased by 13.84 fold after 3 days at 65°C, which is extremely greater than that of UCRB which increased by 3.23 fold. Similarly, CFB increased by 11.11 fold while CRB increased by 2.62 fold (Table 2, 4 and 6). The low totox value could be an indication that the butter would not easily go rancid when properly stored in a container free from atmospheric oxygen and other contaminants. Generally, fresh butter samples were more susceptible to oxidation than rancid butter. This might be due to the more saturation of rancid butter than that of fresh butter samples. Because saturated fat has better resistance toward oxidation. Table 2 showed that 10%KTFB and 10%GrTRB were the first two oxidation stable samples for fresh and rancid butter respectively.
|
4. Conclusions and Recommendations
4.1. Conclusions
- This study showed variation in the quality characteristics of animal butter samples. Some samples (UCFB and CFB from fresh butter and UCRB and CRB from rancid butter) showed very high levels of rancidity during storage time at 65°C, while 10%KTFB and 10%GrTRB, for fresh and rancid butter respectively showed the lowest levels of deterioration (Table 2). These results suggest that korarima treated and garlic treated butter has better oxidation resistance in the specified proportion so that decreased deterioration. Whereas untreated raw butter was extremely susceptible to oxidation. Relatively low relationship between moisture, free fatty acid, and peroxide value were found, which implies all the parameters should be considered collectively in quality control of animal butter. × While it was observed, the addition of natural antioxidants can delay the oxidation of animal butter and thus extend its shelf life.× The heat treatment used during the preparation of clarified butter (CB) had little or no influence on PV.× The clarified butter is more resistant to oxidation than that of raw butter.× In the future the research should focus on how to treat butter for oxidative stability without the involvement of heat treatment for better oxidative stability.
4.2. Recommendations
- × Butter should be clarified and treated with spices or natural anti oxidants particularly with korarima and garlic in order to have better oxidative stability and so that longer shelf-life. Since heat treatment results in oxidation of butter fat, it is better to clarify butter within a few minutes and the temperature should be controlled. × The level of heat used for treatment should be strongly controlled because it may result in formation of compounds which may harm our health, such as aldehyde compounds.