-
Paper Information
- Previous Paper
- Paper Submission
-
Journal Information
- About This Journal
- Editorial Board
- Current Issue
- Archive
- Author Guidelines
- Contact Us
Food and Public Health
p-ISSN: 2162-9412 e-ISSN: 2162-8440
2017; 7(2): 35-39
doi:10.5923/j.fph.20170702.02

Proximate and Mineral Composition of Suya Spices Sold in Port Harcourt, Nigeria
 Abstract
 Reference
 Full-Text PDF
 Full-text HTML
Ngozi Nma Odu, Akwasiam Best, Iheanyi Omezuruike Okonko
Department of Microbiology, University of Port Harcourt, Port Harcourt, Nigeria
Correspondence to: Akwasiam Best, Iheanyi Omezuruike Okonko, Department of Microbiology, University of Port Harcourt, Port Harcourt, Nigeria.
| Email: |  |
Copyright © 2017 Scientific & Academic Publishing. All Rights Reserved.
This work is licensed under the Creative Commons Attribution International License (CC BY).
http://creativecommons.org/licenses/by/4.0/

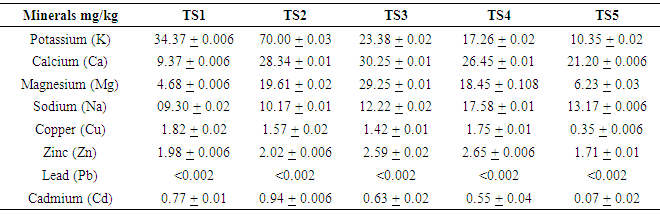
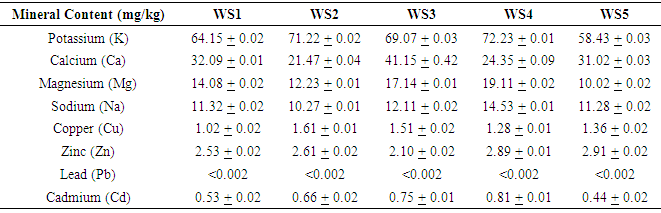
The essence of this study was to assess the proximate and mineral composition of suya spices sold at different suya spice depot in Port-Harcourt, Rivers State, Nigeria. One hundred and fifty (150) samples of suya spice were collected from three suya spice depot located at Rumuokoro, Woji, and Trans – Amadi, all in Port-Harcourt, Rivers State, Nigeria. Standard and established methods was used for both proximate and mineral composition. The moisture content ranged from 6.41 ± 0.02% to 10.30 ± 0.02% (Trans - Amadi), 5.55 0.05% to 6.18 0.02%, (Rumuokoro) and 6.20 0.02 to 10.19 0.01(Woji). The mineral composition of suya spice collected from Rumuokoro, Trans-Amadi and Woji areas of Port Harcourt, Nigeria showed that all the samples have the same proportion of Lead content (<0.002). RS1 had the highest Potassium content (74.65 0.02mg/kg) and Calcium content (34.28 0.02mg/kg). RS2 had the highest Magnesium content (17.71 0.02mg/kg), Sodium content (12.17 0.01mg/kg), Zinc content (3.03 0.01mg/kg) and Cadmium content (0.87 ± 0.01mg/kg). RS4 had highest Copper content (1.67 ± 0.01mg/kg). From the samples from Trans-Amadi area, TS2 had the highest Potassium content (70.00 ± 0.03mg/kg) and Cadmium content (0.94 ± 0.006mg/kg). TS3 had the highest Calcium content (30.25 ± 0.01mg/kg). TS2 had the highest Magnesium content (29.25 ± 0.01mg/kg). TS4 had highest Sodium content (17.58 ± 0.01mg/kg), Copper content (1.75 ± 0.01mg/kg) and Zinc content (2.65 ± 0.006mg/kg). From the samples from Woji area, WS4 had the highest Potassium content (72.23 ± 0.01mg/kg), Magnesium content (19.11 ± 0.02mg/kg), Sodium content (14.53 ± 0.01mg/kg), Copper content (1.28 0.01mg/kg) and Cadmium content (0.81 ± 0.01mg/kg). WS3 had the highest Calcium content (41.15 ± 0.42). Proximate and mineral contents of suya spice collected from three areas within Port Harcourt metropolis demonstrates slight disparity in ash, crude protein, carbohydrate, crude fat and moisture content as well as in the minerals content. The need to provide control mechanisms and establish best practice to improve the quality and safety of spices, means more studies are needed.
Keywords: Suya, Spice, Mineral, Proximate composition
Cite this paper: Ngozi Nma Odu, Akwasiam Best, Iheanyi Omezuruike Okonko, Proximate and Mineral Composition of Suya Spices Sold in Port Harcourt, Nigeria, Food and Public Health, Vol. 7 No. 2, 2017, pp. 35-39. doi: 10.5923/j.fph.20170702.02.
Article Outline
1. Introduction
- Suya is a spiced, barbecued, smoked or roasted meat product, prepared basically from meat of animals. In developing countries like Nigeria, protein intake has been a cause of concern and suya has become a major source of protein in Nigeria. Suya spices grow mainly in mangrove and high forest areas of South-South region and South Eastern region of Nigeria, as climbers, perennial creepers, or slim shrubs and trees and are available all seasons [1]. Suya spices are Nigerian native spices usually used on roasted meat (barbecued meat) to provide it with a distinctive wanted taste and flavor. It has its origin from the Hausas in the Northern Nigeria [2]. It is the special blend of peppers and spices that is used to make Nigerian suya [2]. Spices could be defined as vegetable products or mixtures thereof, without any extraneous matter that is used for flavouring, seasoning and imparting aroma to foods. The spice consists of grinded pepper (Capsicum sp.), Xylopia aethiopica, Piper guineense and Monodora myristica [2, 3]. These spices aid in giving palatable flavor and aroma to suya. Though suya has its origin in the Northern Nigeria but, its consumption go beyond the boundaries of ethnicity, particularly amongst the influential Nigerians during their recreation and relaxation period [2].Proximate and mineral analysis of plants, edible fruits and vegetables plays an important role in evaluating their nutritional significance [4]. As numerous medicinal plant species are also consumed as food along with their medicinal benefits, evaluating their nutritional significance can help to understand the worth of these plant species [4]. Thus, the essence of this study was to assess the proximate and mineral composition of suya spices sold at different suya spice depot in Port-Harcourt, Rivers State, Nigeria.
2. Material and Methods
2.1. Source of Sample
- Samples of suya spice mixture were obtained from three locations, all situated in Rivers State. The mixture is composed of ginger, garlic, West African black pepper, hot pepper and groundnut. A total of one hundred and fifty (150) samples were collected with each location having 50 samples. Samples were taken to the laboratory immediately and analysed within two hours.
2.2. Chemical Analysis
- All the chemicals employed in this study were of analytical grade. The proximate configuration (ash, crude protein, moisture, crude fiber and crude fat) of suya spices were determined as described by AOAC methods [5]. Carbohydrates were determined by the percentage difference in sum of other proximate parameters (ash, crude protein, moisture, crude fiber and crude fat from 100) as described by Dagem et al. [6] and Jonathan et al. [2]. The mineral components were determined with Atomic Absorption Spectrophotometer according to AOAC methods [5]. The concentration in mg/kg dried wt. of Lead (Pb), Cadmium (Cd), Potassium (K), Magnesium (Mg), Sodium (Na), Copper (Cu) and Zinc (Zn) in the suya spices were determined (after nitric acid digestion) by means of an Atomic Absorption Spectrophotometer. The concentrated and digested samples were then aspirated and their actual concentrations obtained by referring to the calibration graph and necessary calculations.
2.3. Statistical Analysis
- Data obtained from the proximate analysis and mineral composition were analyzed using the single factor analysis of variance (ANOVA). Correlation between each of the parameter from each study sites were evaluated. Also correlations between same parameters from the three study site were equally compared.
3. Results
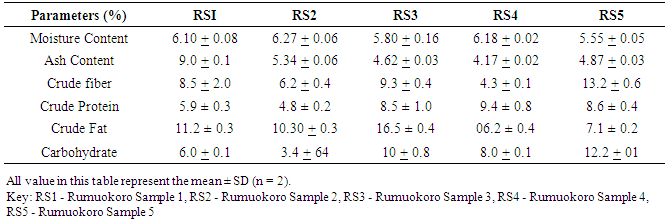
- Suya spice samples collected from Rumuokoro, Woji and Trans-Amadi areas of Port Harcourt, Nigeria, were carefully analyzed for their proximate and mineral compositions. Table 1-3 show the proximate composition of suya spice collected from Rumuokoro, Trans-Amadi and Woji areas of Port Harcourt, Nigeria. The samples from Rumuokoro (Table 1), RS2 had the highest moisture content (6.27 ± 0.06%). RS1 had the highest ash content (9.0 ± 0.1%). RS5 had the highest crude fibre (13.2 ± 0.6%). RS4 had the highest crude protein content (9.4 ± 0.8%) while RS3 had the highest content of crude fat (16.5 ± 0.4%) and RS5 had the highest content of carbohydrate (12.2 ± 01%) as shown in Table 1.
|
|
|
|
|
|
4. Discussion
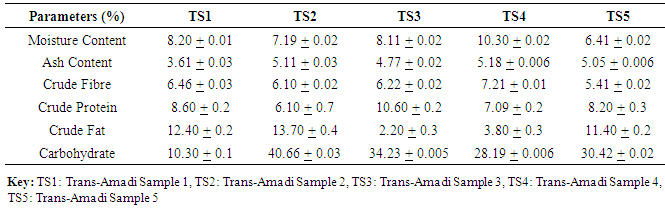
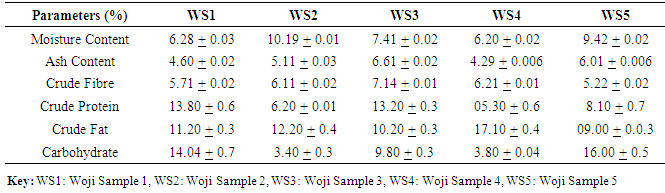
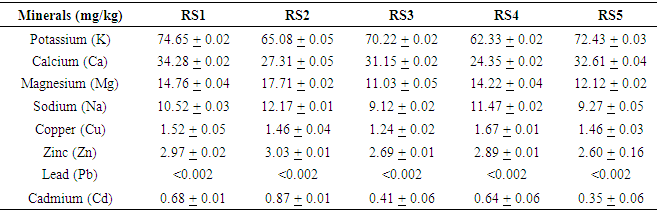
- Suya is extensively used in Nigeria cooking, babecue etc, either in the prepared meal or ready to eat meal. Suya spice is very good seasoning due flavor and aroma it add to the meal, from the study it is good especially in minerals. It was equally observed from this study that some organisms have multiple resistance to antibiotics, this is of public health importance. The wholesomeness and safety of the consumer must therefore be given high priority. Proximate arrangement of suya spice collected from three areas within Port Harcourt metropolis shows disparity in ash, crude protein, carbohydrate, crude fat and moisture content. The moisture contents of the suya spice samples from the three study areas, Rumuokoro, Trans – Amadi and Woji had moisture content ranging from 5.55 ± 0.05% to 6.18 ± 0.02%, 6.41 ± 0.02% to 10.30 ± 0.02% and 6.20 ± 0.02 to 10.19 ± 0.01 respectively. Rumuokoro recorded the lowest of 5.55 ± 0.05% to 6.18 ± 0.02%, while Trans-Amadi recorded the highest moisture content of 6.41 ± 0.02% to 10.30 ± 0.02%. Moisture contents reported in this study is lower than the 35.00-39.09% reported by Ogbonna et al. [7] and lower than 40.17 and 57.17% obtained by Edema et al. [8]. It is also lower than 23.29% reported in some markets by Fakolade and Omojola [9]. The low moisture compositions of suya spices indicate that it is sufficiently dried to minimize microbial growth. Egbunike and Okubanjo [10] reported that intermediate moisture meats are low in moisture and are shelf-stable under tropical climates without refrigeration. Moisture composition gives meaningfully to the presence of microbes in foods [11]. Consequently, the possible reasons for high level of microbiological growth. The low moisture content makes it possible to be stored for a long period without deterioration in organoleptic quality microbial spoilage because of water activity this is in line with the work of Armand et al. [12]. Suya spices collected from Rumuokoro area equally recorded the lowest Crude protein of 4.8 ± 0.2% to 9.4 ± 0.8% while Trans- Amadi has 6.1 ± 0.7 to 10.6 ± 0.2. This correlates with the work of Shumaila and Mahpara [13]. This is also lower than the 35.10% crude protein reported by Ogbonna et al. [7] in suya spice samples from Kano road market and the 28.30% reported by Ogbonna et al. [7] from Baga road samples. The low protein content found in the suya spice is in disagreement with Egbunike and Okubanjo [10] who reported that intermediate moisture meats are low in moisture composition, which makes them to be less bulky. The protein content found in the suya spice in this study is far lower that the reported range of 69.8% to 72.1% by Soniran and Okubanjo [14]. In this study, the fat content was observed to be lowest at Trans - Amadi (2.20 ± 0.3 to 13.70 ± 0.4) while Woji recorded the highest of 9.0 ± 0.3 to 17.1 ± 0.1, this colaborated with the work of Armand et al. [12] and Nwinuka et al. [15]. Fat content recorded in this study is lower than the 28.26% reported by Ogbonna et al. [7] and higher 2.86% ash content reported by Ogbonna et al. [7]. The % protein content of the samples disagreed with 31.8% reported by Abdulahi et al. [16]. Also the values obtained in this study for fat and ash level disagreed with that obtained in some of the markets by Abdulahi et al. [16] and Ogbonna et al. [7]. Fat content in our study were observed to fall with the range of 10.9 -29.6% reported by Venia et al. [17]. Increase in fat contents may be due to the effect of nutrient concentration due to moisture loss [9].The low ash levels obtained from the suya spice samples disagrees with the findings of most authors [18, 19] and may not be due to the condiments used during the boiling of the meat for the suya production as claimed. Torres et al. [18] also reported that ash content at the end of storage differs significantly to that at the onset. Previous authors (18, 19) observed that heat application increases the ash contents of meat.The mineral composition of suya spice collected from Rumuokoro, Trans-Amadi and Woji areas of Port Harcourt, Nigeria showed that all the samples have the same proportion of Lead content (<0.002). RS1 had the highest Potassium content (74.65 ± 0.02mg/kg) and Calcium content (34.28 ± 0.02mg/kg). RS2 had the highest Magnesium content (17.71 ± 0.02mg/kg), Sodium content (12.17 ± 0.01mg/kg), Zinc content (3.03 ± 0.01mg/kg) and Cadmium content (0.87 ± 0.01mg/kg). RS4 had highest Copper content (1.67 ± 0.01mg/kg). The suya spices collected from Trans-Amadi area showed that TS2 had the highest Potassium content (70.00 ± 0.03mg/kg) and Cadmium content (0.94 ± 0.006mg/kg). TS3 had the highest Calcium content (30.25 ± 0.01mg/kg). TS2 had the highest Magnesium content (29.25 ± 0.01mg/kg). TS4 had highest Sodium content (17.58 ± 0.01mg/kg), Copper content (1.75 ± 0.01mg/kg) and Zinc content (2.65 ± 0.006mg/kg). The suya spices collected from Woji area showed WS4 had the highest Potassium content (72.23 ± 0.01mg/kg), Magnesium content (19.11 ± 0.02mg/kg), Sodium content (14.53 ± 0.01mg/kg), and Cadmium content (0.81 ± 0.01mg/kg). WS2 had the highest Copper content (1.61 ± 0.01mg/kg). WS3 had the highest Calcium content (41.15 ± 0.42). The changes in proximate and mineral contents of suya could occur as a result of the condition of the meat employed in suya production or the handling technology. Animal status also controls its proximate contents. A diseased animal or animal which suffered severe malnutrition would not produce meat having the same nutrient as animals in good shape.The statistical analysis result using ANOVA of single factor, showed that there was no significant different in the proximate parameters of the sample at each study area, and there was equally no significant difference on the same parameters from the three study areas, as all the p – value were found to be greater than 0.005. This can be attributed to the producers as of about 95% of them are from the same ethnic group (Hausa of Northern Nigeria), and as such will have some similarity on the choice and little difference in the quantity of the various ingredient added.
5. Conclusions
- Proximate and mineral contents of suya spice collected from three areas within Port Harcourt metropolis shows slight disparity in their proximate and minerals contents. The need to provide control mechanisms and establish best practice to improve the quality and safety of spices, means more studies are needed.