E. C. Merem1, Y. Twumasi1, J. Wesley1, P. Isokpehi1, M. Shenge1, S. Fageir1, M. Crisler1, C. Romorno1, A. Hines2, G. Hirse2, S. Ochai3, S. Leggett3, E. Nwagboso4
1Department of Urban and Regional Planning, Jackson State University, Jackson MS, USA
2Department of Public Policy and administration, Jackson State University, Jackson, MS, USA
3Department of Health Policy and Management, Jackson State University, Jackson, MS, USA
4Department of Political Science, Jackson State University, Jackson, MS, USA
Correspondence to: E. C. Merem, Department of Urban and Regional Planning, Jackson State University, Jackson MS, USA.
| Email: |  |
Copyright © 2017 Scientific & Academic Publishing. All Rights Reserved.
This work is licensed under the Creative Commons Attribution International License (CC BY).
http://creativecommons.org/licenses/by/4.0/

Abstract
Nigeria’s vast areas of land under rice cultivation did not augment self-sufficiency and that prompted a policy shift towards increased local production with some effects. From that, Niger state emerged and remains a major contributor to agricultural productivity in the country. Despite being a major hub with vast acreages and the third largest rice producing state of the nation, it is faced with several sectoral challenges impeding rice farming. Yet very little has been done over the years to assess the trends in local rice production to gauge yield potentials and develop new models for improved decision making capability. Accordingly, this paper adopted a mix-scale technique of descriptive statistics and GIS to analyse changing trends in rice production in Niger state. There is a focus on the issues, temporal profile of agricultural trends especially rice production and other crops, the factors and mapping of selected indices. The result shows that despite notable drops in the 1990s, production and land under rice for Niger state surpassed most of its neighbors in every category from 2006 through 2010. During these periods, Niger state’s land under rice cultivation increased notably as well. The GIS mapping of the trends points to dispersions and changes in land under rice cultivation and production as well as indicators located within the larger agricultural structure coupled with widespread diffusion of fertilizer use in the state. With the changes attributed to post-harvest losses and the lack of storage devices and socio-economic and miscellaneous elements from climate change to others. The paper recommended several remedies including the need for storage and bulk handling devices to open up rice markets, the design of geospatial and land information management systems and constant monitoring of ecosystems adjacent to rice farms.
Keywords:
Agriculture, Rice Production, Changes, Nigeria, GIS, Ecosystem, Fertilizer Use
Cite this paper: E. C. Merem, Y. Twumasi, J. Wesley, P. Isokpehi, M. Shenge, S. Fageir, M. Crisler, C. Romorno, A. Hines, G. Hirse, S. Ochai, S. Leggett, E. Nwagboso, Analyzing Rice Production Issues in the Niger State Area of Nigeria’s Middle Belt, Food and Public Health, Vol. 7 No. 1, 2017, pp. 7-22. doi: 10.5923/j.fph.20170701.02.
1. Introduction
Rice is a staple food in several African nations and constitutes a bigger portion of the diet on a regular basis. In the last thirty years, rice showed constant increases in sales and its rising significance reflects the strategic food security initiatives adopted in many nations. Aside from a handful of nations that enjoy self-sufficiency in rice cultivation, rice consumption surpasses production and substantial amount of the crop are imported to sustain local demand at the expense of hard earned foreign currency reserves [1]. Throughout the closing decades of the 20th century, Nigeria’s rice output reached overwhelmingly high levels. From the rapid rise in farmland area devoted to rice during that era in Nigeria, the production and consumption increased enormously. However, the growing output has not been adequate enough to meet the rising demand. To bridge such a deficit in the face of policy flaws, Nigeria resorted to the massive importation of rice at an unprecedented rate. Given the rising profile of rice as an essential element of Nigeria’s food menu and the fact that imported rice accounts for a major portion of the nation’s food imports, there is a growing desire among policy makers to boost rice production locally. Despite the huge priority accorded to the crop in the policy discourse of the country over the years, previous plans overlooked unhindered access to a portion of the domestic market for indigenous rice farmers like in other countries. Under such an anomaly, very little has been done to assess the trends in local rice production to gage yield potentials and develop new models for improved decision making capability. This is now far more critical than ever given the latest interest to grow the rice sector of the Nigerian economy where Niger state has emerged as a major player [2, 3]. At a period in which self-sufficiency in food production is the responsibility of any government at the national and state level [4]. Niger state has over the years, remained a leading contributor to agricultural productivity in the country at the regional, and state levels [5]. Just as in the 1950s and 1960s when farming was a major revenue source in the defunct Northern region, today agricultural activities continue to assume a top most priority. Since 2001-2011, per hectare yield levels in a variety of major crops in the state have not only increased, but exceeded expectations [6]. In the process, Niger state has outpaced many states in several statistical categories used to gage the production of major crops. Another dimension to the potentials of Niger state as major agricultural state stems from its geographic position which comes with the added physiographic and bio-geo-climatic advantages it enjoys in terms of weather and soil capabilities which others lack [7]. Being a major hub with vast production acreage and the third among rice producing states of the nation, the state is still dominated by subsistence farming. The absence of a strong private sector in that setting to harness the immense potentials of the agro industry coupled with low levels of investment makes the state one of the least developed in the country. Notwithstanding the development goals of the Niger state government predicated on partnership with the private sector, there are several sectoral challenges impeding agricultural activities. The challenges include inadequate and high costs of basic farm inputs such as improved seeds/planting materials, organic and inorganic fertilizers and agro-chemicals; insufficient and high costs of agricultural equipment and machineries. In the area, only 5% of farm activities are mechanized while 10% use animal traction; coupled with inadequate quality trained extension workers and demonstration plots [7]. There is also the issue of poor storage facilities causing high post-harvest losses of farm produce and inefficient marketing system [1, 8]. Similarly, rice producing households store rice 5-7 months in some form for various purposes such as seed retention from the previous harvest and for consumption and sales under difficult conditions [2]. This is compounded by a lack of small scale processing plants for excess perishable farm produce and the absence of all year round farming due to non-operational irrigation facilities. While only 25% of the potential irrigated area fully developed, the state experiences severe deforestation caused by unsustainable farming practices, timber and fuel wood collection and overgrazing [7]. Furthermore, one of the most serious long-term challenges to achieving sustainable rice yield in the state is climate change. Previous studies have shown that humidity and minimum temperature are the climatic factors that affect rice production in the area, such that 1% increase in humidity resulted in a 17% reduction in rice production in Niger state [9]. The gravity of the issues herein analysed reinforces the need for a mix-scale analysis anchored in descriptive statistics and Geographic Information Systems (GIS) mapping of rice yield trends essential in the design of a crop index. This will help track output with a path towards the eradication of postharvest losses in the state. Over the years, GIS analysis in agricultural land use as an investigative tool has found widespread applications in many studies [10-14]. In related enquiries, Merem in 2004 used the model along with principal component analysis to track changes in farm land use, the ecosystem and various factors in Ottawa, Ontario [15]. Other studies under the same theme that are germane to the experience of Niger state involve GIS mapping of fluctuations in land use, the agricultural structures and the environment in the states of Mississippi, Louisiana, South Carolina and Georgia [16-20]. With very little work over the years specifically directed at Niger state of Nigeria, this research will fill that void in the literature by assessing the changing trends and rice production with focus on the issues, trends and factors and future lines of action. For the purposes of analysis, the first objective of the paper is to assess trends in the agricultural sector. The second aim is to identify the factors of change in farm activities of the state. The third objective focuses on the development of a decision support tool for policy makers while the fourth aim delves on the development of an index for agriculture and rice production. The paper is divided into five parts. The first section presents the introduction while part two highlights materials and methods. Part three describes the results and the fourth section contains the discussion. Part five follows with the conclusions and findings of the research.
2. Methods and Materials
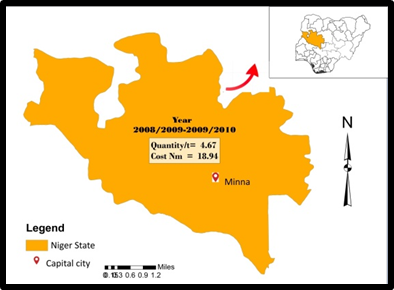
The study area of Niger state with a population of 3.9 million people [21], is located in the North central zone along the Middle Belt region of Nigeria (Figure 1). It is classified as one of the largest states in the country spanning over 86,000 km2 in land area with 80% of the land mass conducive for agriculture [22]. With 9.30% of the total land area of the country, Niger state is not only divided into three agricultural zones under climatic features containing nearly all classes of soils of the savannah regions of West Africa [22]. But the soil types range from the shallow soils around the rocky landscapes to deep soils of the valleys. The deeper soils, representing the alluvial type even though complex in appearance has exceptional potential for rain fed and irrigated farming. In addition to that, the state experiences dry and wet seasons with yearly rainfall variation of 1,600 mm in the south to 1,100 mm in the north with a duration of 7 to 8 and 5 to 6 months in the south and northern zones respectively. With such a favorable climate, the major crops grown in the state consists of rice, sorghum, maize, millet, groundnuts, cowpeas, soybeans, cotton, yam, cassava, vegetables and others [7].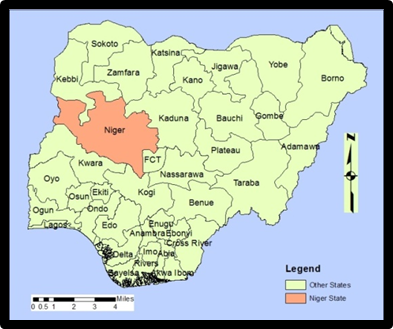 | Figure 1. The Study Area of Niger State |
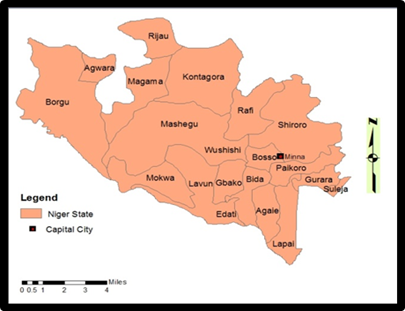 | Figure 1.1. The Study Area of Niger State with the LGAs |
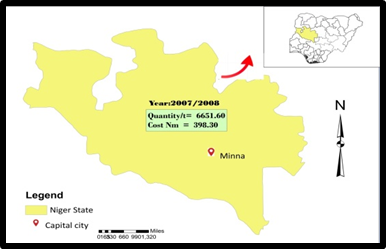
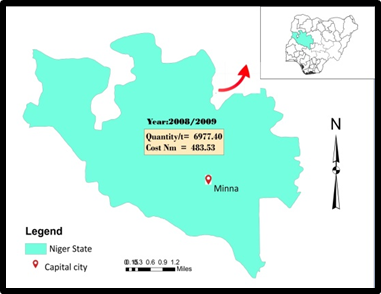
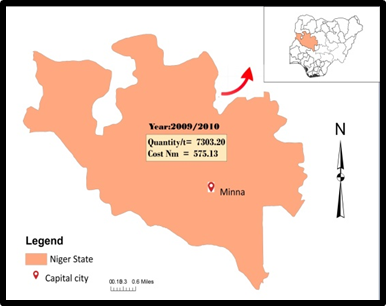
The vast natural features of the area are evident with the flood plains adjacent to the southern border of the state, the presence of huge water bodies (Rivers Niger, Kaduna, Gbakogi, Gurara, Chanchaga) and dams. Such a unique ecosystem with 6 months of dry weather provides ample probability for dry season farming of mostly rice, sugarcane, maize, and various vegetables. While the annual production of these major crops including rice over the years is estimated to be over 200,000 metric tons [7]. Rice production fluctuated at an all-time high in 1997, followed by significant drops and slight rebounds. Between 2006 through 2010, the state experienced some gains in rice yield [23]. Because of the production levels over the years, Niger state saw its quantity of fertilizer treatment of farm land go from 6325.80-6651.60 tons and 6977.40 to 7303.20 tons from 2006-2008. The applications of fertilizer continued at a similar pace during 2008-2010 (Figure 2).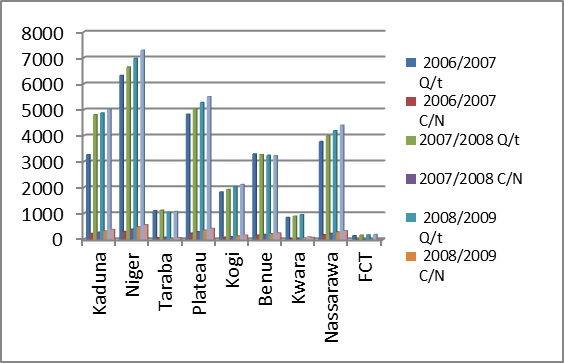 | Figure 2. Fertilizer Quantity and Cost. Source: National Bureau of Statistics, 2010 |
All through the same period, the monetary costs of fertilizer applications rose accordingly [23], (Figure 2). Aside from the benefits that come with increased fertilizer, and the rising percentages in usage (Figure 3), their role in soil and environmental degradation should not be overlooked. If the trends under current practices continue unchecked with no recourse to organic manures, fertilizer runoffs may constitute a serious threat to the fresh water bodies surrounding cultivated areas [6]. Addressing agricultural productivity and food security in Niger state in the face of these issues requires the use of a mix scale approach of GIS mapping and descriptive statistics. This will help generate agricultural crop index to improve decision making.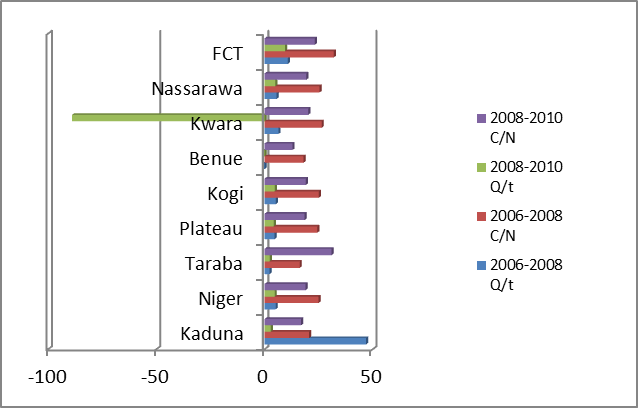 | Figure 3. Percentage Change for Fertilizer Use. Source: National Bureau of Statistics, 2010 |
2.1. Methods Used
The paper uses a mix-scale, spatially oriented methodology. This method stresses the use of GIS and the integration of secondary data provided through government sources and data bases from other organizations. The raw spatial data, involving paper and electronic and GIS maps used in the study was procured through the US Geological Survey (USGS) and government agencies in Nigeria and the private sector. The model which involves temporal-spatial data revolves around the procurement of agricultural census information and related data based on descriptive statistics and GIS to display the trends spatially. While part of the spatial information for the research was obtained from the Nigerian Online data system. This was made possible by the retrieval of spatial data sets of shape and grid files from the University of Maryland Online data and other sources. The statistical output of the variables from the spatial units was mapped and compared across time from 2001 to 2010-2011 using Arc GIS 10.4 and SPSS 20.0 Just as the Federal Ministry of Agriculture, Federal Bureau of Statistics and Niger State Bureau of Agricultural Statistics and other agencies offered farm data for the periods of 2001-2011, the federal geographic identifier codes for the states were used to geo-code the information contained in the data sets. This information was analysed with basic descriptive statistics, and GIS with particular attention to the temporal-spatial trends at the state level. The relevant procedures consist of two stages.
2.2. Stage 1: Identification of Variables, Data Gathering
The first step involves the identification of the variables needed to assess agricultural productivity based on the trends, the profile in farm areas, land use change and improved yield at the state level. The variables consist of the land use elements of cultivated (rice) crop land, rice production, farm gate prices and percentages of change. Others are physical and ecological elements of the quantity of fertilizer applied daily to cropland, yield per hectare for rice. There is also the monetary price of fertilizer in naira, price of rice seedlings as well as other socio-economic variables located within the larger agricultural structure. Additionally, access to databases and abstracts that are presently available within the federal and state archives in Niger state, the Federal Ministry of Agriculture and Rural Development, the Niger State Government, the University of Maryland free Online Data Services and host of other organizations helped quicken the search process. The process continued with the design of data matrices for socio-economic and land use variables covering the periods from 2001, 2006, 2007, 2008, 2009, 2010 to 2011. The design of spatial data for the GIS analysis required the delineation of state boundary lines. With boundary lines unchanged, a common geographic identifier code was assigned to each of the units to ensure analytical coherency.
2.3. Stage 2: Step 2: Data Analysis and GIS Mapping
In the second stage, descriptive statistics and spatial analysis were employed to transform the original socio-economic and land-use data into relative measures (percentages/ratios). This process generated the parameters for establishing the predictors of change on the landscape and the agricultural structure including areas planted with rice and those exposed to gains and declines. This was facilitated by measurements and comparisons of the trends over time and space. While this approach allows for change detection regarding yield, the tables highlight indicators of gains and declines, land use patterns and extensive use of various agricultural resources. Additionally, some of the local information in Niger state and Nigeria came from existing studies, government plans, the private sector, and specialty studies, such as the compilation of development planning information, hydrologic studies and GPS verified maps. The spatial units of analysis consist of the state. Outputs for the state from local governments were tallied, mapped and compared across time. This process helps show the extent and nature of temporal-spatial profile of changes in selected farm variables within the state. With socio-economic census data becoming available in electronic format and with GIS software now being easily accessible, the ability of researchers to conduct advanced spatial analysis in agricultural development planning has been enhanced. For instance, maps are useful in communicating to the reader which area units are experiencing conditions associated with factors of low agricultural yield, economic and environmental declines or gains that should be targeted for response. The remaining procedure involves spatial analysis and output (maps-tables-text) covering the study period, using ArcGIS 10.4 [24]. With the main spatial units of analysis made up of Niger State. Other components of the geographic data for the study area also covered ecological data of land cover files, paper and digital maps from 2001-2011 as well as 2012. This would help generate a multi-media blue print of maps and graphics available in GIS that will serve as a viable policy support guide for decision makers.
3. Results
This section of the paper presents the results of the data analysis of rice production activities in Niger state. The initial focus delved on a temporal profile of land under rice farming, the percentages of change and production trends in other years. This is followed by an appraisal of the state of storage facilities and post-harvest handling, spatial analysis of GIS and the factors limiting rice output in the study area.
3.1. Analysis of Rice Farm Land Use
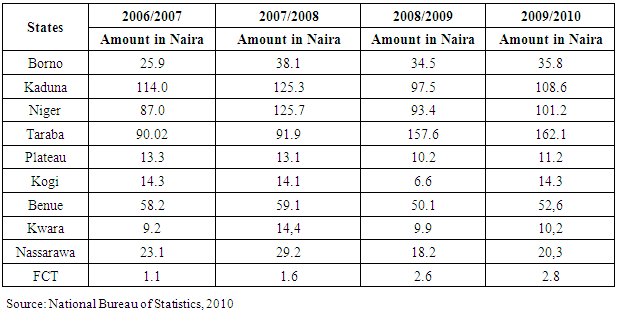
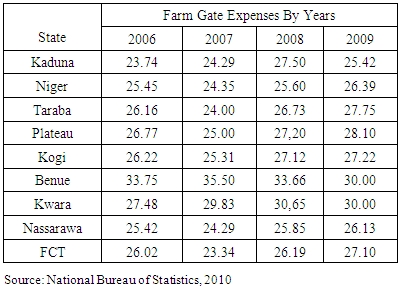
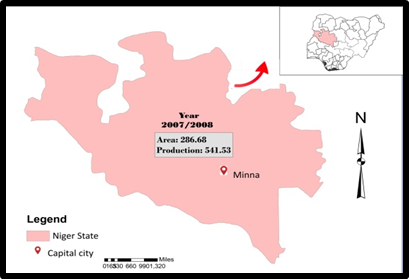
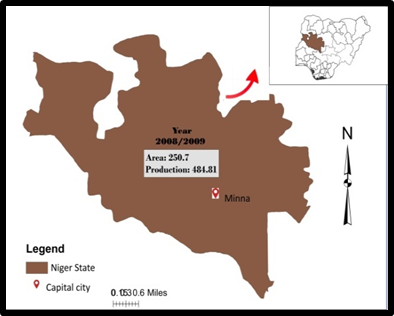
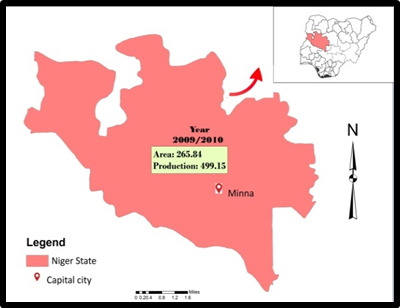
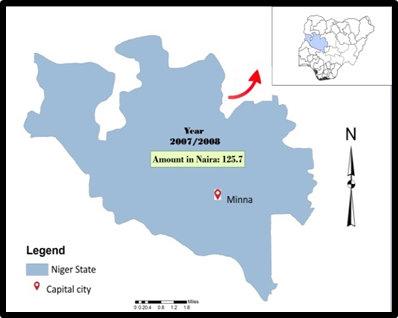
Looking at the area of land under rice and production in the North and the Middle belt region, aside from the state of Kaduna, Niger state outpaced most of its neighbors in every category between the periods of 2006-2010. In the area of land devoted to rice, during these years, note that Niger state saw its land under rice cultivation rise from 203.4 thousand hectares to 286.68 between 2006/2007 through 2007/2008. The trend continued in the following periods (2008/2009-2009-2010), when cultivated area went from 250.70 to 265.84 thousand hectares. Niger state also had outright increments in cultivated areas compared to some of the Middle Belt states such as Kogi, Plateau, Kwara, Benue and Nassarawa during the same periods of 2006-2010. In a similar vein, production levels during the same periods opened at 481.45 thousand metric tons to 541.53 while the other two periods stood at 484.81-499.15 TMT respectively (Figure 4). The monetary costs of rice seeds as a factor in the planting season also increased from the 2006/2007 levels of N87 million to N125.3 million and N93 million to N101.2 million. This seems commensurate with the amount of money devoted to seedlings in the production of rice in the two other Middle Belt states of Kaduna and Taraba (Table 1). From the profile, farm gate prices for rice dropped from N25.45-N24.35 but only to rally slightly by N25.60 to N26.39 at an average of N24.94 in the entire period (Table 2).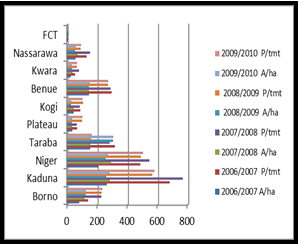 | Figure 4. Rice Areas and Production. Source: National Bureau of Statistics, 2010 |
Table 1. Costs of Seed/Seedlings of Rice (Million Naira) by State 2006-2010
 |
| |
|
Table 2. Farm Gate Price by Crop and State in Naira for Rice, 2006-2009
 |
| |
|
3.2. Percentages of Change in Land Use Elements
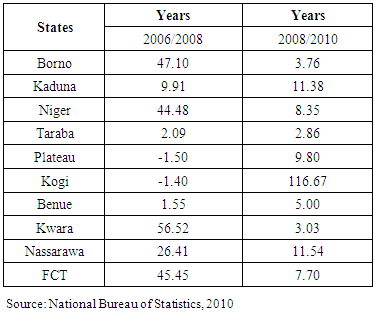
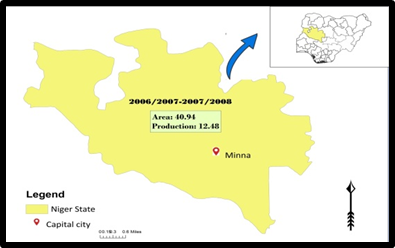
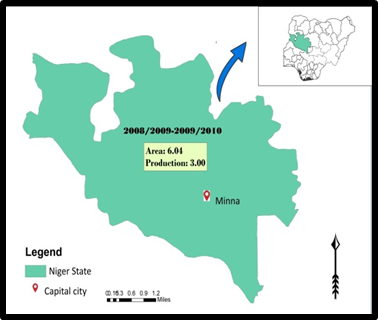
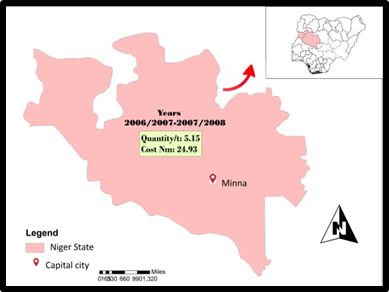
In terms of percentage changes, while the cultivated land area for rice production and quantity produced for Niger state showed instant gains much of the time, some of her Middle Belt neighbors saw a mix of gains and declines during the years [24].Going by the graph, it is clear that the growth rates for cultivated area and rice production for Niger state between 2006 through 2010 were quite encouraging and in the range of 40.94-6.04% and 12.48-3.00% (Figure 5). The same can also be said of the monetary costs of rice seedlings which posted gains of 44.48-8.35 percentage points (Table 3). 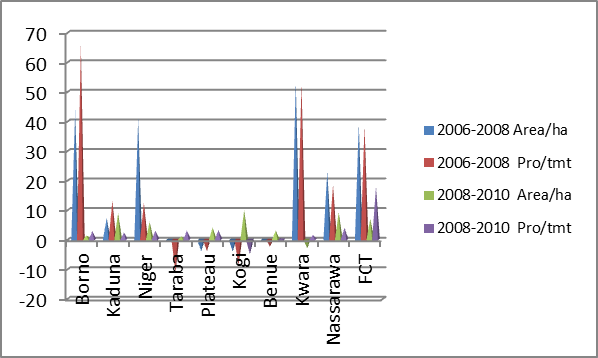 | Figure 5. The Percentages of Change for Rice Production, 2006-2010 |
Table 3. The Percentages of Change for Costs of Rice Seed 2006-2010
 |
| |
|
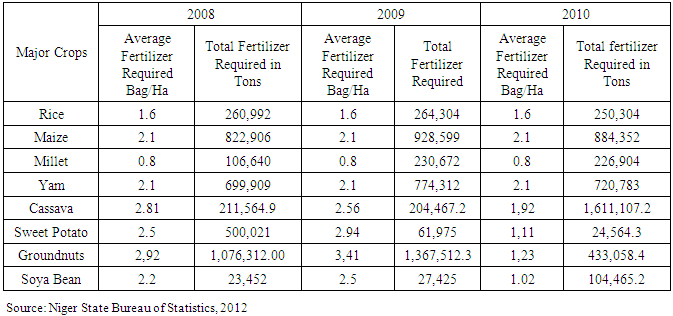
With the increases in fertilizer treatment of land evident in Niger state, during 2006-2010, among the crops [24], the average quantity of fertilizer needed for rice farming stayed stable at 1.6 bags between 2008 through 2010. During that period, the total amount of fertilizer required for farmland cultivated with rice not only rose from an opening value of 260,920 to 264,304 tons in 2008 and 2009, by 2010 the overall fertilizer required for areas cultivated with rice dropped slightly to 250,304 tons (Table 4). Table 4. Fertilizer Applications for Different Crops 2008-2010 in Niger State
 |
| |
|
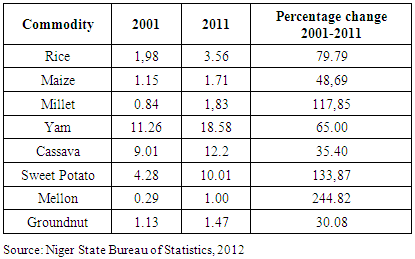
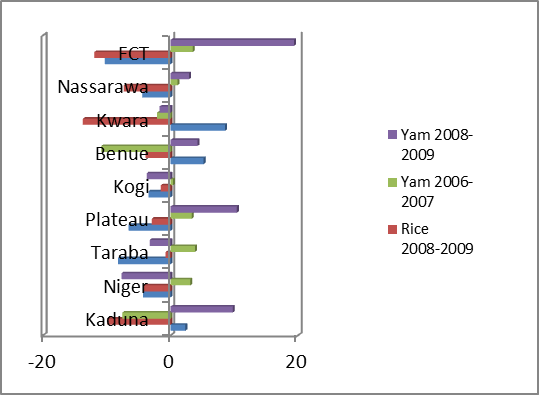
To further buttress the great potentials of agricultural productivity in the state, the yield per hectares for rice rose by 1.98 -3.56 at a rate of 79.79% between 2001 through 2011 [6] (Table 5). At the same, Niger state is also not an exception when it comes to the falling pace in farm gate prices by crop as manifested in the other Northern states. With identical rates of declines (of -4.32 and -4.30%) for rice, between 2006-2007 and 2008-2009 in the state, the prices for yam rose (by 3.09%) in 2006-2007 but only to drop at a rate of -7.71% in 2008-2009 [Figure 5.1]. See Appendix 1-2 for a brief synopsis on the other crops in the agricultural structure of Niger state and comparisons with neighboring countries.Table 5. Yield per Hectares for Major Crops
 |
| |
|
 | Figure 5.1. The Percentages of Change in Farm Gate Price by Crop |
3.3. Rice Productions over the Years: The 1990s
In terms of rice production profile particularly, so far Niger state stands as a major contributor to rice farming in Nigeria. In the preceding years of 1991-1998, the state saw an increase in production probably connected to the policy introduced in 1985, after the military administration banned rice and maize importation into Nigeria. By 1995, the government of Nigeria imposed a 100% tariff on rice; this impacted the overall volume of production in Niger state’s output. Such a scenario seemed to have induced rice farmers in the state to produce more to augment the nation’s overall rice yield. During that period, the highest level of rice production in Niger state in 1998 which stood at 600,960 tons grew at 11.52% percentage points. This could be associated also with the introduction of better technology and good weather. Furthermore, rice yield fell in the next year to 532,870 tons by 11.3%; this decline in production persisted till 2002 at 315,190 tons. This represents a severe drop in Niger state’s rice yield. Following that, the rice yield once again moved up slowly by 407,200 tons, while the slow surge held steady till 2009 at 532,010 tons on a low pace, it still could not crack the 1997 high production levels [9]. The drop-off in production in the other years did not operate in a vacuum. It might be attributed to a host factors such as rice importation, the absence of lines of credit to farmers in the state and post-harvest handling as well as human and natural factors of climatic variability and others. See section 3.6 on limiting factors for more.
3.4. Assessment of Storage Facilities and Post-Harvest Handling
So far, one major thing often over looked in the food security debate in Niger state involves the incidence of post-harvest losses (PHL). They are a common occurrence within the food chain and can diminish real income for every buyer. This particularly touches those living below poverty level; as a result, a greater proportion of their earnings are spent on essential food items. The importance of the need to reduce PHL dates back to the 1970s. In the aftermath of the food crisis during that period, PHL attracted large development ventures aimed at addressing the decrease in staple crops. Today, everyone appears to be overlooking the significance of post-harvest food losses in the Nigerian farm sector, and the very entities that canvased to contain PHL have fizzled out of the lime light. The meager proliferation rate in the adoption of PHL technologies in the country is associated with the falling investment in this sector. At the same time, during the post-harvest phase, farmers face losses of both cereal quantity and quality [8]. This comes at a time where dozens of Nigeria’s farm export products have been placed on the list of banned food items by the European Union market for not meeting the required quality standards which may be attributed to many elements including poor storage. In Niger state where the period of rice storage for seed selection and consumption stretches through 7 months under 28 weeks of dry season without adequate safety nets for farmers [4]. In those circumstances, Niger state cannot afford to preside over an agricultural sector where significant portion of her farm produce are left to perish in the absence of better storage while there is a growing demand for them in a state that saw increases in yield per hectare in major crops between 2001 through 2011. In that light, storage facilities are crucial to the continued preservation of high yield levels in rice for Niger state.
3.5. GIS Mapping and Spatial Analysis
This part of the paper presents the geographic dimensions of rice production trends and the potential sources of environmental risks from farming activities in the study area. The multi-color map legends represent various indicators in a GIS map. For effective management and periodic tracking of rice cultivation, and sustainable land use, designing agricultural crop index for Niger state geospatially through this profile serves an essential need in local planning. This entails the geographic visualization of rice farm activities under several variables that are unknown before in the state. The mapping which began on various distribution scales germane to cultivated land and rice production trend, points to a correlation between the size of cultivated area and yield in the state. In that order, the GIS maps unveiled a vast concentration in space highlighting the harvest of high yield volumes of rice. This occurred under relatively smaller farm land areas in the early years compared to the later periods when production volumes gradually subsided on areas classified as much larger tracts of cultivated agricultural land acreages (from 2008-2010) (Figure 6-6.3). With that came visible fluctuations in ratio evident in the percent of change for production and the size of area under rice cultivation in the different periods (of 2006-2010) (Figure 7-7.1). 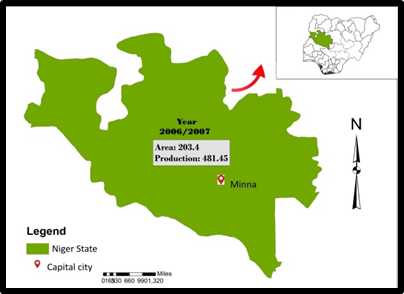 | Figure 6. Rice Planted and production, 2006-2007 |
 | Figure 6.1. Rice Planted and production, 2007-2008 |
 | Figure 6.2. Rice Planted and Production, 2008-2009 |
 | Figure 6.3. Rice Planted and Production, 2009-2010 |
 | Figure 7. The Percentage of Change for Rice 2006-2008 |
 | Figure 7.1. The Percentage of Change for Rice, 2008-2010 |
On the economic side, the monetary costs of rice seedlings once gain displays same patterns in space (between 2006/2008 through 2006 to 2010) as indicated from the variations in areas under production. Further along these lines, among the other farm indicators, the price of rice seedlings not only fluctuated in space in the first years from a lower value of N78 naira (in the fiscal years of 2006/2007) but it jumped to N101.2 in 2009/2010(Figure 8-8.3). From there, farm gate price stability gradually, showed a robust presence in space from 2006 to 2009 for rice (Figure 9). Of the other variables, the GIS mapping also offered a glimpse of the attributes of agricultural inputs in rice cultivation activities over time. The maps highlight a spatial dispersal of quantity, costs, average price, and fertilizer use over the years between 2006/2007-2009/2010 in the study area of Niger state. As the quantity of fertilizer used rose, so did the volatility of fertilizer procurement costs in the state. This was based on an opening cost of N398.3-507.13 naira during the years under analysis. With time, the percentage of change in quantity and costs of fertilizer sparked similar geographic patterns in the same periods as well (Figure 10-10.5). 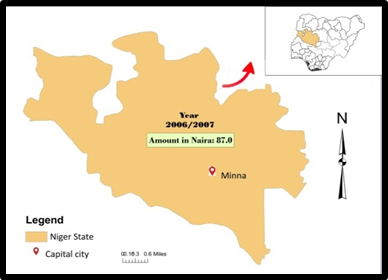 | Figure 8. Cost of Seeds/ Seedlings of Rice (million), 2006-2007 |
 | Figure 8.1. Cost of Seeds/ Seedlings of Rice (million), 2007-2008 |
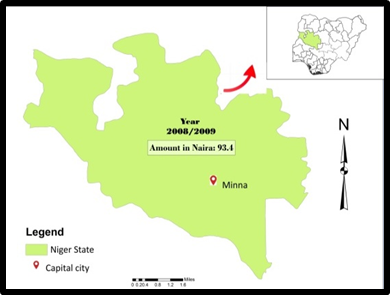 | Figure 8.2. Cost of Seeds/ Seedlings of Rice (million), 2008-2009 |
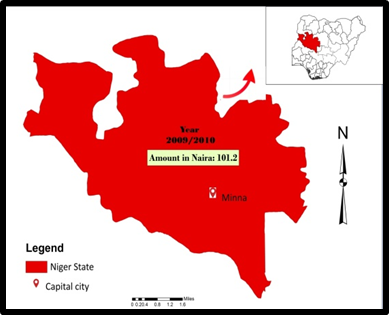 | Figure 8.3. Cost of Seeds/ Seedlings of Rice (million), 2009-2010 |
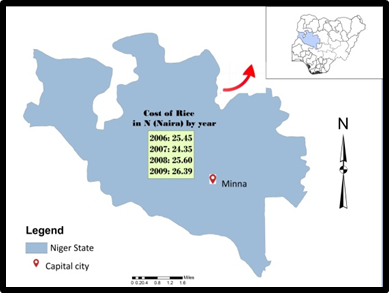 | Figure 9. Farm Gate Price by Crop in Naira for Rice, 2006-2009 |
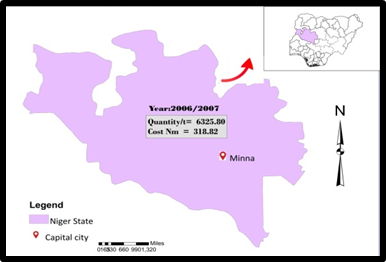 | Figure 10. Quantity and Cost of Fertilizer, 2006-2007 |
 | Figure 10.1. Quantity and Cost of Fertilizer, 2007-2008 |
 | Figure 10.2. Quantity and Cost of Fertilizer, 2008-2009 |
 | Figure 10.3. Quantity and Cost of Fertilizer, 2009-2010 |
 | Figure 10.4. Percentages of Change of Quantity and Cost of Fertilizer |
 | Figure 10.5. Percentages of change of quantity and Cost of Fertilizer |
While the maps reiterated the spatial presence of rice farm elements as traded in Niger state’s agricultural market place, the process generated a multi-media blue print (of user friendly maps and graphics available in GIS, that will serve as a viable policy guide for decision makers. Considering the level of underdevelopment and the subsistence nature of farming and the threats of PHL, these maps would complement the ability of managers to track rice yield levels, fluctuations in cultivated land area, various economic transactions and the rates of nutrient applications so as to have a firm grip on the fiscal and ecological challenges of rice farming in Niger state.
3.6. Factors Influencing Rice Production in the State
The factors shaping rice farm activities and changes in Niger state do not exist in isolation; they consist of recurrent issues and the inability to handle PHL. The others include a handful of socio-economic, natural and biophysical elements such as pests, diseases, poor line of credits and climate change stressors. Each of these factors is described below briefly under the following two headings: cyclical problems and the little success in reducing post-harvest losses and miscellaneous elements.
3.6.1. Cyclical Problems and the Little Success in Reducing Post-Harvest Losses
Niger state is one of the most underdeveloped states in the country that is vulnerable to Post-Harvest Losses. Given the cyclical problems in the agricultural sector based on volatility in the international market place coupled with the current commitment to diversify the economy and the projected role of Niger state in food production. The state has faced fluctuations in the price of rice seedlings and farm gate prices that are sometimes associated with uncertainty from lack of access to efficient storage and the limited capability in the handling of harvested farm produce. Being a place known for the prevalence of subsistence farming where rice farmers store seedlings for marketing, consumption and planting for subsequent seasons under harsh conditions. The absence of a strong private sector to harness the vast agricultural potentials in the face of low levels of investment and efficient storage facilities for harvested rice are so crucial that any iota of drought, diseases, or invasion from rodents in those circumstances spells disaster for those involved. Without mechanized silos as storage devices, there is always the risk of minute sands being meshed with the rice grains, and that in turn dips its salability. This makes post-harvest losses quite a common occurrence to the detriment of rice farmers who are unable to store excess farm produce efficiently under extreme weather conditions. Because of that, the importance of PHL as a major constraint in the agricultural policy framework of Niger state can no longer be underestimated. The continued occurrence constitutes a serious challenge to food security and the fulfillment of policy objectives. While current lines of actions are encouraging and range from result oriented initiative to the provision of the commercial sector with technical support in grain handling and storage capacity. The dwindling success in reducing PHL in the state and the meager technical capacity to address the issues posed indicate that the changes in rice production in the state over the years are partly attributed to PHL [8].
3.6.2. Miscellaneous Elements
Part of the factors hindering rice production in Niger state stems from the threats posed by pests, diseases and certain economic and natural elements that are often beyond the control of farmers themselves. The growing dangers posed by the incidence of pest and diseases are significant natural elements limiting the production of rice and, under grave conditions, they trigger about 100 percent of crop losses and drop in yield. Even though, the situation in Niger state is compounded by underdevelopment and un-mechanized nature of farming in the area. Limited credit access for rice farmers remains a barrier. While credit lines whether for the short term or long term possibly can assist in minimizing monetary constrictions that hamper production. Agricultural production for years has also been impacted by the ineffective utilization of loans obtained for specific aims and by the endemic frequency of loan defaults prevalent among Nigerian farmers. Added to that are the high costs of basic agricultural inputs such as improved seeds/planting materials, organic and inorganic fertilizers and agro-chemicals; insufficient and high costs of agricultural equipment and machineries and limited access to qualified extension workers. The challenges from human activities, global climatic variability and natural forces also impede efficient and sustainable increases in rice output. As a result, climactic stressors like water strain and flooding already are responsible for extensive rice yield losses across the world and the anticipated rise in these elements due to climate change would further accelerate rice production losses in the years ahead. Being in the arid Northern region, Niger state has had its full share of climate change impacts on rice production. Previous research showed that humidity and minimum temperature are the climatic factors that affect the rice production in the area in which 1% increase in humidity resulted in 17% declines in rice production in the state.
4. Discussion
This paper adopted a GIS based method and secondary data to analyse changing trends in agricultural land use and rice production in Niger state of Nigeria. The emphasis delved on the issues, temporal profile of agricultural trends especially rice production and other crops, factors and mapping of selected indices. Over the years, across Nigeria the profile of rice as a staple food in the country has risen with the demand outpacing production capacity in different periods. Considering the heavy demand for rice as a daily staple in Nigeria, government interventions in the past through policy changes has resulted in increases in local rice production as manifested in Niger State along the Middle Belt region. With its unique climate and ecosystem, Niger state has great potentials in agriculture, especially rice production where the cultivated land area and yield have been on the rise over the years with the growing pace of fertilizer applications. As a result, Niger state has seen its quantity of fertilizer treatment of farm land jump from 6325.80-6651.60 tons and 6977.40 to 7303.20 tons between 2006 /2007 and 2007/2008 with growing threats to its aquatic systems and public health. From the scale of agricultural operations over time, the profile of the area of land under rice, and production using descriptive statistics showed that Niger state surpassed some of its neighbors in every category between the periods of 2006-2010. In the area of land devoted to rice, during these periods, Niger state’s land under rice cultivation increased from 203.4 thousand hectares to 286.68 from 2006/2007 through 2007/2008 and the trend went on in the subsequent year, when rice cultivated area increased from 250.70 to 265.84 thousand hectares. While the state also posted straight gains in cultivated areas compared to some of the states in the Middle belt region. The production levels during the same years which stood at 481.45 thousand metric tons to 541.53 reached 484.81-499.15 TMT respectively. With time, financial expenditures of rice seeds as an element in the farming period also rose from the 2006/2007 levels. This appears somewhat proportionate with the expenses earmarked for seedlings in rice production in the two other states of Kaduna and Taraba. Additionally, farm gate prices for rice dropped from N25.45-N24.35, but only to rebound marginally by N25.60 to N26.39 at an average of N24.94 in the entire period (Table 5). Such volatility in prices does impact the earnings among farmers and the ability to hold on to cultivated rice land.The extent of changes indicate that as the size of land devoted to rice and quantity produced for Niger state showed regular increases, the nearby states in the Middle Belt again experienced a mix of gains and declines. From the profile of the trends, the growth levels for cultivated area and rice production for Niger state during the periods of 2006 to 2010 were quite in the range of 40.94-6.04% and 12.48-3.00%. The same can also be said of the monetary costs of rice seedlings which saw gains of 44.48-8.35%. The critical inference worthy of attention is that despite the gains in area under cultivated rice and production, one should not ignore the fact that much of the double digit gains occurred in the opening periods of 2006-2008, but only to slide to low single digits levels in 2008-2010. While such widening deficits as cautionary signs for planners, calls for periodic tracking in the state. It offers opportunities to gage the suitability of big and small farms operations in terms of productivity levels and the reasons behind the deficits for future planning. With the widespread applications of farm nutrients on cultivated land in Niger state all through 2006 to 2010, the amount of fertilizer required for rice farming held firm between 2008 through 2010. Considering Niger state’s enviable profile in agriculture, the state was also quite active in rice farming in Nigeria during the 1990s based on an initial growth and a gradual slide. In the fiscal years of 1991-1998, the state saw an initial increase in production following the imposition of heavy tariffs and the ban on rice importation into Nigeria under a government policy in 1985. With such measure in place, rice yield among farmers in the state not only rose, but it eventually resulted in an increase in the Nation’s production levels. Despite the rosy picture being painted above, Niger State remains saddled with post-harvest losses (PHL) known to diminish rice production earnings. The spatial analysis of the trends using GIS analysis points to gradual dispersions and changes in cultivated rice land, production and other indicators located within the larger agricultural structure coupled with widespread diffusion of fertilizer use in the state. With such increases (5.15-4.67 to 1.26% and 24.93-18.94) in fertilizer use and in the expenditures, water bodies in the area are vulnerable to heavy traces of nutrient loads, and sediments from rice farm activities with risks to the surrounding ecology. Surely, the Niger State ecosystem remains prone to the ecological impacts of farming. Being a major agricultural state, land use elements of rice yield per hectare saw visible changes in the form of gains. This involved a change from 1.98-3.56 in rice yield per hectares at a rate of 79.79% between 2001 through 2011. In light of that, the results did show a widespread fluctuation or volatility in farm gate prices and growing risks for fresh water bodies and resources especially from the heavy use of fertilizers, changes in cultivated land areas and land use elements coupled with the geographic manifestation of the trends. While the changes emanate from various socio economic and miscellaneous elements of lack of credit access, natural factors and PHL, the paper offered several suggestions including the need for the use of storage and bulk handling devices to open up rice markets, the design of geospatial and land information management systems and constant monitoring of ecosystems adjacent to rice farming. See Appendix 3 for a summary of the recommendations.
5. Conclusions
The paper offered some valuable insights with outcomes vital to rice production in Niger state of Nigeria. The significance of the study is characterized by its novelty as a pathway to efficient management based on the following findings: (a) improved decision support tools for managers with GIS; (b) information upgrade on the changing trends in the farm sector (using mix-scale model); (c) the emergence of novel index for crop management; (d) identification of limiting factors influencing agricultural activities; (e) new knowledge about risks in the farm sector. These are expected to result in increased benefits through best management practices in decision making. The details of these findings are described in the following paragraphs.Considering its relevance, GIS was quite instrumental in visualizing the nature of changing trends in rice farming. Without such a temporal-spatial framework, decision makers run the risk of prescribing policy change using faulty blueprints at the expense of effective land management, farm retention and productivity in the state. Seeing the analytical use of GIS in tracking change patterns on particular elements in a landscape, scrutinizing the dispersion of land use elements coupled with pollutants such as fertilizers and the socio-economic factors of change is vital in managing farm landscape which is a major economic and ecological asset for citizens of Niger state. With the extent of change in the agricultural structure in the area, the timely applications of GIS in that setting is not only indispensable in pinpointing areas impacted by changes in farm landscape, but it provides beneficial uses pertinent to managers in weighing the indices. Accordingly, GIS technique as used here provides a decision support mechanism for planners in analyzing the indices and stressors from agricultural landscape change in the area. In doing so, this capability outlined the changes experienced in the agricultural variables of the study area. The display of spatial information, including dimensions associated with land use groups, environmental and economic factors, in visual form is especially vital due to its potential as a means of communication. For instance, GIS maps are valuable in showing to land managers which areas or farm variables are under performing due to volatilities or pressures associated with declines and low yield. Being an underdeveloped state saddled with PHL and un-mechanized farming, the GIS maps ushered a novel pathway for planners to randomly appraise spatial fluctuations in yield levels, fiscal stability, and potential ecological risks to rice farming.The effective use of appropriate techniques including GIS and descriptive statistics within a mix scale orientation in this study shows that the paper provided a valuable methodology for the assessment of farm activities, potentials and changes. Through the vigorous application of the mix scale approach, the study results clearly indicate that change in the form of gains in cultivated land areas in rice production had occurred. The development and application of these techniques in the project did showcase the feasibility of the methodology at the state level. The exploitation of these techniques in the research along with findings emanating from it, therefore, makes a contribution to our understanding of farm land assessment and potentials of the sector. These techniques are not only fundamental in the design of mitigating strategies essential in dealing with issues emerging from changing agricultural structure. But they serve as a conduit for future applications in Niger state. While the paper unveiled the role of mix scale approach as effective model for examining changes in a landscape, the descriptive statistics component of the model using census data was pivotal in highlighting the snapshots of change (gains or declines) and the potentials of the agricultural sector of Niger state in rice production.Designing an index for crop management through the measurement of change and spatial display of the trends at a mix scale based on a snapshot of various levels is an improvement to previous efforts. Considering the dynamic nature of the farm landscape of the state from the changes that occurred in the form of gains or disparity in percentage increments or drops in the 1990s, it is obvious that there are a growing number of variations in the land index that development planners are unaware of. If the planners had monitoring mechanisms in place during periods of change, they would have been able to keep the dwindling land base or deficits in production from double to single digits in some years. This is attributable to the absence of an index for gaging stability and threats to land. By identifying such trends for the purpose of monitoring and directing development away to suitable areas, the study filled a void in a relevant area. This will allow for a quick appraisal in the display of percentage deficits involving (declines and gains) in cultivated farmland areas and production. In critical situations, such an approach provides land managers a framework for promoting conservation activities. This in turn encourages the preservation of crop land base through Best Management Practices (BMPs). Being the pathway for measuring change, the findings outlined herein serves the needs of planners in weighing the significance of emerging patterns and their impacts on the local community. Keeping decision makers abreast of change patterns in this manner enhances their ability to track competing uses and to conduct appraisals as to whether current land use practices are suitable and in conformity with restrictions limiting use around farm operations for the benefit of cropland management.Just as presented in the results, efforts were being made to determine the factors responsible for changes in the agricultural structure. In locating climate change dangers and the growing use of fertilizer on the landscape in an area rich in biodiversity and abundance of freshwater, the findings not only stand as a timely piece of work but a major step in indicating the dangers of pollution threats in rice producing areas adjacent to the head waters of the state. Knowing the risks of spatial dispersal of such stressors benefits regulators in the crafting and monitoring of quality standards for the head waters. In the absence of such benefits, regulators will face uphill battles in mitigating ecosystem strain across the farm landscape. Considering that various factors associated with the use of farmland and the issue of post-harvest losses in the study area were not estimated previously, the role of these factors in impeding agro-business potentials through the deficits in cultivated area as well as gains and losses in quality and quantity through Post-Harvest Losses merits prompt attention from government entities charged with the task of safeguarding open spaces and land assets. There is now a great opportunity to increase the procurement of storage devices such as silos using the index developed herein. In light of this, this study not only finds a practical use, but the measurement of various dimensions of change in the farm structure that had not been detected before in the area could emerge as a priority for managers. The ability of this project to unveil elements behind declines or gains in agricultural activities in Niger State shows local assessment can serve as a viable tool for promoting sustainable land management indispensible in implementing the state’s development policy. The analysis of links between changes in the landscape and factors known to fuel degradation is evidence of the study’s promise in helping identify predictors of change.In identifying the factors likely to limit agricultural productivity and the quality of the surrounding ecology in the study area, the research, thus creates a road map for tracking these elements through improved response mechanisms. To a great extent, managers will have enormous chance to appraise the characteristics of those risks across time by assessing their impacts with regular preparedness. Being a step toward mitigation and protection, the documentation of these factors, improves the capability of policy makers in tracking the state of and the role of limiting elements in impeding rice yield in the event of inclement weather. This would allow the state and communities design the right measures for minimizing the effects of any risks from humidity, temperature, flooding, pest and diseases. In that way, the study injects an environmental protection and risk assessment dimension which is crucial in identifying agricultural risks and shielding people and the fragile ecosystem from the hazards unleashed from irregular weather patterns, heavy fertilizer use and impairment from dam infrastructure given their high presence in the Middle Belt region. The fact that the risks attributed to these factors come with impacts capable of disrupting the environment makes the assessment herein an emerging vision for managing agricultural risks in different areas. At the same time, the paper offers decision makers an improved understanding and awareness of these risks and should not be underestimated.The significance of the result herein presented raises several questions for further scholarship and decision making that would need to be answered in the state and they include: what will the changing agricultural landscape be like in the coming years? What will be the core enablers of this change? Will storage devices be effective in mitigating post-harvest losses in rice production? What form will the geographic concentration of large farms assume in Niger state? How will climatic variability shape agricultural activities? Because of their significance to many aspects of future plans and the life of communities in the state, decision makers must grapple with how to integrate answers to these questions in their long range plans. In that light, current projects can build on the analysis herein using these questions as a template to future assessment of agricultural activities and potentials with focus on how change impacts the livelihood of communities by limiting access to sustainable use of the land base. The benefit of the project is that it offers a set of parameters upon which managers can draw from as they craft measures best suited for their state in order to ensure continued yield, access to farm landscape and sustainable use. In so doing, land managers can become cognizant of issues arising they would not have known in their areas thanks to this research. Consequently, GIS mapping as a management tool will provide locational capabilities necessary for tracking risk patterns across space. This benefit will represent a significant stride cowards effective planning and mitigation of eventual impacts. Pinpointing these risks enhances the capability of decision makers and agencies in the state in prioritizing vulnerable locales for intervention in case of uncertainties in the agro-ecosystems.
Appendix - 1
3.2.1. Analysis of Percentages of Change on Other VariablesAs indicated earlier, fertilizer use and the costs of procurements in Niger state all stayed on the rise much of the time (Table 2), while maize cultivated areas and production leveled up as well. Among the other crops, aside from pockets of meager declines in some periods (yam, millet, sheanuts and cassava) all of them showed appreciable growth levels in terms of cultivated area and yield between 2006 through 2010 [23]. However, the declining levels in production and the areas under cultivation in whatever forms, are negative signals that must be addressed by policy makers if the projected targets in the agricultural component of the state’s development plan is to be attained to the fullest in the years ahead.
Appendix - 2
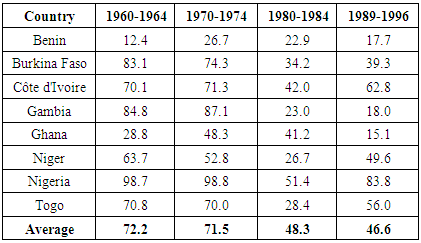
3.2.2. Comparisons of Rice Production Trends in Other NationsIn comparing the situation in Niger state to other countries, look no further than some of the neighboring countries in West Africa and the African continent as a whole. In the case of Africa, aside from a small number of nations that have achieved self-sufficiency in rice production, the demand for rice surpasses production and large quantities of rice are imported to meet local demand at the expense of hard earned foreign exchange. Of the 11.6 million tons of rice consumed annually in Africa, 3.3 million tons of that (33.6 percent) come from foreign markets. As a result, 21 of the 39 rice-producing nations in the continent that import almost 50 to 99% of their rice supplies, just ten have accomplished any visible form of rice self-sufficiency, while the other 29 are major importers with self-sufficiency levels of 0 and 62.8%. For that, there exist huge disparities in the distribution of rice importation among the various regions of Africa with the North and Central Africa regions the least importers. West Africa on the one hand, boosts of the largest rice area in Africa estimated at 3.7 million ha (56.5%), but the average self-sufficiency levels for the nations showed regular drop (72.2-71.5 and 48.3 to 46.6%) starting from 1960-1964 to 1996, a sign of the region’s incapacity to address growing demands through indigenous production [1], (Table 6). Given the abundance of rice in Niger state of Nigeria, it is safe to say that the insufficiency percent among West African nations over the years does not reflect current trends from this research even though Niger state experienced some notable drops in output in the 1990s.Table 6. Rice Insufficiency Percent in West Africa 1960-1996
 |
| |
|
Appendix - 3
4.1. RecommendationsTo deal with the problems identified in rice farming in Niger state, the paper offered the following suggestions to boost productivity, ecosystem health and land preservation in agricultural areas.4.1.1. Begin the Design of Farm Storage FacilitiesGalvanized iron mechanized silos are not only essential to store rice grains efficiently. They are vital in reducing the threats to surplus, and limiting the issues involved in postharvest storage and handling of rice seeds. These silos can efficiently shield grains from the damages inflicted by rain, flood, birds, rodents and pests. Considering that dozens of food exports from Nigeria are on the list of temporarily banned items by the European Union for poor quality standards. The proposed system has the capacity to greatly assist in the efficient handling of produced grains by global standards and increase the export potentials and quality for Niger state. The information on various agricultural crops including rice shows that the state’s share of farm crops is destined to increase, this means that the farm sector must double its efforts towards storage in the face of climate change threats and irregular weather patterns and quality standard criteria. This will raise the profile of PHL and provide best management practices and practical tools for implementing some aspects of the state’s development plan. It will go a long way in improving agro-productivity potentials of the state by setting up storage silos in different areas including Bida and Minna with major support. Such initiative could signal the readiness of the state towards mechanized farming and accelerate the distribution of modern implements in rice production.4.1.2. Use Bulk Handling Devices to Open up Rice MarketsGiven the less mechanized nature of farming in Niger state, storage and bulk handling system for food grains is emerging as a constraint to businesses in lieu of increasingly tedious stages involved in manual handling and its impediment to the loading and off-loading of farm products. As a result, the absence of proper storage infrastructure for food grains and other products results in damages and quality depreciation of stored food items. With the growing population in Nigeria and rising demands for food under new markets and increased yield per hectare in rice farming in Niger state. Improved storage infrastructure will open up untapped opportunities for export in the state. This should also involve the design of modern quality market infrastructure made up of transport and highways to facilitate flow of goods and services in farming areas. The proposed facilities can be located in bulk handling areas in Bida and Minna known for their rice processing plant facilities. Alternative sites could be areas where bulk quantities of food grain including rice are received during the harvest season. Accordingly, the paper supports the design of mechanized grain storage silos and handling systems to address postharvest storage and handling of surplus rice. The expectation is that these silos can help minimize wastage of food grains and other products, and ensure surplus quantities for domestic and export markets in a way that discourages rice imports.4.1.3. Support the Design and Use of Geospatial Information and Land Information Management SystemsThe study tracked common trends in cultivated land, rice production, fertilizer use, economic indicators of prices of rice seedlings, farm gate prices, and the vulnerability of ecosystems to the use of farm nutrients. The scale of those interactions with production, and the pressures from climate change to fertilizer run offs on the surrounding flood plains, and river systems in the state, reaffirmed the essence of regular spatial inventorying of various stressors. While mapping the elements and stressors through GIS enhances the decision support systems for mangers in the state. Access to the latest advances in spatial information systems as well as climate risk information offers a sizable advantage to those who have it and hinders the readiness of those who lack it in tackling problems facing rice farming in the state. Nevertheless, the declining levels in production in the 1990s and the areas under cultivation in whichever way manifested are critical indicators that must be tracked periodically using these devices. Because a comprehensive land information tracking system on cultivated areas and related elements at the state level never quite existed at the onset of this research, the farming community risks severe land degradation from deforestation, grazing and climate change at the expense of production. Such constraints hamper the ability of the managers to track deficits and surpluses in land areas and the competing uses with effective plans. Considering the void in land information devices in Niger state, the paper suggests regular applications and the design of a state wide geo-information system for land management to optimize the preservation of cultivated rice areas, the promotion of resource analysis and the logistics of production. 4.1.4. Promote Environmental Monitoring Knowing the sensitive nature of most ecosystems of the state and the scale of land use activities within the past years, the river systems adjacent to farming areas are now major sinks for vast loads of negative externalities originating from rice farming. As indicated earlier, fertilizer use and the costs of procurements in Niger state all stayed on the rise much of the time. In the process, water bodies and soil and built areas in farm producing areas of Niger state are at risk of ecological declines. The problems include the flow of pollutants and contaminated materials in the form of nutrients, fertilizers and chemicals. This pushes the ecosystem beyond limits with grave consequences. Faced with such negative externalities, an integral task for land managers involves quality of life improvement and ecosystem protection with emphasis on risk detection and the containment of pollution through water quality monitoring. Promoting water quality monitoring in those settings requires intermittent appraisal of the state of water resources in heavily farmed watersheds. It provides opportunities to track fertilizer application, the scale of absorption in nutrient loads, toxic levels and the response of the agro-ecosystem to the interaction. Since vulnerable water bodies provide life support services to the farm communities, the state should support water quality monitoring program and risk assessment so that eventual pollution from fertilizer use can be fully tracked at the source. This will enable early containment before irreversible damage is done to flood plains and water resources in Niger state.
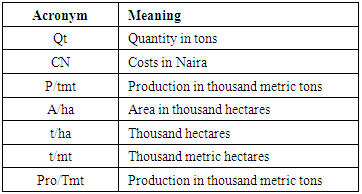
Acronyms
References
| [1] | Oteng, J.W. (1998). Rice Production in Africa: Current Situation and Issues. Rome: Italy, FAO Corporate Document Repository. |
| [2] | Akande, S.O. (2003). The Nigerian Rice Economy In a Completive World: Constraints, Opportunities and Strategic Choices: Rice Production Systems in Nigeria: A Survey. Abidjan: Côte d’Ivoire, West Africa Rice Development Association (WARDA). |
| [3] | Wada, A.C. (1998). Meeting The Rice Production and Consumption Demands of Nigeria with Improved Technologies. Rome: Italy, FAO Corporate Document Repository. |
| [4] | Adesina, A. (2013). National Agricultural Resiliency Policy Framework. Abuja FCT: Nigeria, Federal Ministry of Agriculture and Rural Development. |
| [5] | Federal Ministry of Agriculture and Rural Development & National Bureau of Statistics. (2012 May). Collaborative Survey On National Agriculture Sample Survey (NASS) 2010/2011. Abuja FCT: Federal Ministry of Agriculture and Rural Development. |
| [6] | Niger State Bureau of Statistics. (2012). Niger State Agricultural Statistics. Minna: Niger State, NGA, Niger state Bureau of Statistics. |
| [7] | Niger State of Nigeria. 2013. Development Action Plan for Niger State. Minna: Niger State, Niger State Government. |
| [8] | World Bank. (2011). Economic and Sector Work, Missing Food: The Case of Post-Harvest Grain Loses In Sub Saharan Africa. DC: Washington, the World Bank. |
| [9] | Ayinde, O.E. (2013 November). Evaluation of the Effects of Climate Change On Rice Production In Niger State, Nigeria. Ethiopian Journal of Environmental Studies and Management. 6: 6: 763-773 (Supplement). |
| [10] | Merem, E.C., & Twumasi, Y.A. (2012). Using GIS To Assess the Contributions of Farming Activities to Climate Change In The State of Mississippi. The British Journal of Environment and Climate Change. 2:2.1-15. |
| [11] | Merem, E.C., & Twumasi, Y.A. (2008 March). Geospatial Information Systems Analysis of Regional Environmental Change Along The Savannah River Basin of Georgia; International Journal of Environmental Research and Public Health. 5: 1:281-294. |
| [12] | Merem E.C. (2012 December). Tropical Landscape Change and The Role of Agroforestry In Southern Nigeria. The British Journal of the Environment and Climate Change. 2:3:285-319. |
| [13] | Schlossberg, M. (2003). GIS, The US Census and Neighborhood Scale Analysis. Planning, Practice & Research. 18:2-3:213-217. |
| [14] | Merem, E.C., & Twumasi Y.A. (2008 December). Using Spatial Information Technologies as Monitoring Devices In International Watershed Conservation along the Senegal River Basin of West Africa The International Journal of Environmental Research and Public Health. 5:5: 464-476. |
| [15] | Merem, E.C. 2005. Environmental Accounting For Changes In Farmland Use: A Canadian Case Study. New York, NY: Edwin Mellen. |
| [16] | Twumasi, Y.A., & Merem, E.C. 2005. GIS Applications in land management: The loss of High Quality Land to Development in Central Mississippi from 1987-2002. International Journal of Environmental Research and Public Health, 2: 2: 234-244. |
| [17] | Merem, E.C. (2014 March). Assessing Agricultural Landscape Change In Northern Mississippi Region. World Environment. 4:2: 43-60. |
| [18] | Merem, EC. (2015 March). GIS Assessment of Farm Landscape Change In South Carolina Lower Region. International Journal of Agriculture and Forestry. 5:2:92-112. |
| [19] | Merem E.C (2013 January). Geospatial Assessment of The Impacts of Changing Agricultural Landscape In Louisiana. The Journal of Marine Sciences. 3:19-29. |
| [20] | Merem E.C (2015 March). Analyzing Environmental Issues In The Lower Savannah Watershed, In Georgia and South Carolina. American Journal of Environmental Engineering. 5:1:1-20. |
| [21] | Alamu, L.O. (2013). Agro-Forestry Practices and Sustainable Agriculture in Yam Producing Communities of Niger state, Nigeria. Journal of Environmental Science and Water Resources. 2:6:167-171. |
| [22] | Tologbonse, D. (2008 December). Policy Issues In Meeting Rice Farmers Agricultural Information Needs in Niger State. Journal of Agricultural Extension. 12:2:84-94. |
| [23] | National Bureau of Statistics (2010). Agricultural Data Series 2006-2009. Abuja: FCT, Nigeria, National Bureau of statistics. |
| [24] | Primedia Business Magazines and Media. (April 2003). Software, Public Help Design Land Use Plans. American City and County. American City and County, 118:16-17. |

 Abstract
 Reference
 Full-Text PDF
 Full-text HTML