-
Paper Information
- Previous Paper
- Paper Submission
-
Journal Information
- About This Journal
- Editorial Board
- Current Issue
- Archive
- Author Guidelines
- Contact Us
Food and Public Health
p-ISSN: 2162-9412 e-ISSN: 2162-8440
2016; 6(6): 165-173
doi:10.5923/j.fph.20160606.03

Sodium, Potassium and Other Essential Mineral Contents on Dairy Milk Available in the Markets of a Northeastern Capital in Brazil: A Sodium Intake Estimation for Children
 Abstract
 Reference
 Full-Text PDF
 Full-text HTML
Marcio Augusto Ribeiro Sant’Ana1, Ilce Ferreira da Silva2
1Nutritional Quality Department, Instituto Federal de Educação, Ciência e Tecnologia do Maranhão (IFMA), São Luiz, MA, Brazil
2Department of Clinical Epidemiology, Fernandes Figueira Institute/Fiocruz, Rio de Janeiro, Av. Rui Barbosa, Flamengo, RJ, Brazil
Correspondence to: Ilce Ferreira da Silva, Department of Clinical Epidemiology, Fernandes Figueira Institute/Fiocruz, Rio de Janeiro, Av. Rui Barbosa, Flamengo, RJ, Brazil.
| Email: |  |
Copyright © 2016 Scientific & Academic Publishing. All Rights Reserved.
This work is licensed under the Creative Commons Attribution International License (CC BY).
http://creativecommons.org/licenses/by/4.0/

Background: Dietary mineral intake is particularly important for infants and young children. While insufficient mineral intake by children may cause health problems, sodium excess may result in early health implications for young infant, as well as affecting their long-term health status. Objective: To determine the concentration of sodium and selected minerals (K+, Ca, Mg, Fe and Zn) in dairy milk products available in São Luis, Brazil. To estimate sodium intake by children aged 4-8 years, comparing to WHO and DRI recommendations. Methods: Descriptive and analytical study was performedthrough chemical analysis of essential minerals contained in flavored milk, whole milk UHT, milk powder, and powder milk compounds using ICP-OES and flame atomic absorption spectrometry methods. Na and K concentrations were compared to the label and Brazilian official standards (POF). Results: Median Na+ concentrations in 200mL of flavored milk (255.1mg), whole milk (229.3mg), milk powder (737.2mg), and milk compound (793mg) were statistically higher than declared on the labels (p<0.05). Consumption of 200mL of milky foods could mean a 12% to 39.6% higher intake of Na+ than recommended. Median Na+ concentrations were 97% (flavored milk) to 339% (powder milk compounds) higher than POF. Flame Photometry was more efficient in determining Na and K (R2:86.6%-97.8%) than ICP-OES (R2:28.3%-90.8%). Conclusion: Sodium concentrations in 200 mL of studied dairy products were statistically higher than declared on the labels and official standards. Photometry test was more accurate than the ICP-OES method on determining Na and K. Daily consumption of tested dairy products by children 4 to 8 years (600mL), could increase the intake of Na (10% to 86.5% higher).
Keywords: Dairy milk products, Essential mineral, ICP-OES, Flame photometry, Brazil
Cite this paper: Marcio Augusto Ribeiro Sant’Ana, Ilce Ferreira da Silva, Sodium, Potassium and Other Essential Mineral Contents on Dairy Milk Available in the Markets of a Northeastern Capital in Brazil: A Sodium Intake Estimation for Children, Food and Public Health, Vol. 6 No. 6, 2016, pp. 165-173. doi: 10.5923/j.fph.20160606.03.
Article Outline
1. Introduction
- Dietary mineral intake is particularly important for young children, because of the important growth period. Insufficient essential mineral intake in this period, especially of iron and calcium (Ca), is related to illness such as anemia, osteoporosis or immune system diseases [1]. Studies developed in different countries and periods show controversial results concerning the daily intake of minerals (Na, K, Ca, Mg, Fe and Zn), [2]. According to such studies, Ca and Mg intakes were above the recommended values for all subgroups, and average intakes of sodium in each subgroup were above average nutritional requirements for this nutrient [2].Sodium (Na) intake should be monitored in young children since their excretory system is less efficient to eliminate this mineral than that of adults [3]. Consequently, sodium excess may result in early health problems for the young children, as well as affecting their long-term health status. Once children are likely to maintain their dietary intake patterns from childhood into adolescence, those infant with high Na intakes are more likely to consume higher amount of salt during adolescence and early adulthood, which may cause over 20 salt-related health problems [4]. Although sources of Na intake may change over time, evidences suggest that major sources of dietary Na among primary school children aged 4–13 years are processed food such as cereal and cereal products, meat and poultry products and milk product dishes [5, 6]. Whole milk UHT, powder milk, flavored milk, milk compounds contributes the most sodium within the milk products and dishes group, being frequently consumed (94%) among pre-school children [6]. Once Na and Potassium (K) have an inverse relation in the body, they are usually considered as nutrients of concern in the children’s diet [7]. Thus, it is important to examine not only individual mineral intakes but also the ratio of these two minerals in the diet. Although Na and K ratio has been more strongly associated with an increased risk of hypertension and CDV-related mortality than either Na or K alone [8], determining the ideal Na:K is still controversial, mainly because of debates about what would be an ideal Na intake. According to WHO recommendations, Na intake in adults should be <2000mg/d and adjusted downward based on the energy requirements of children (2-15 years old) relative to those of adults; and also recommends consumption of 600 mL/d of dairy milk for children aged 4-8 years [9]. On the other hand, the WHO also recommends that adequate K intake level is set at ≥3510 mg/d for adults and should be adjusted downward for children [10]. Thus, according to these recommendations, the Na:K would be <0.57 (i.e. 2000 mg Na/d and 3510 mg K/d) for healthy adults.In this sense, the quality and the safety of processed dairy milk produced in large amount includes the accurate analysis of minerals present in milk. The National Health Surveillance Agency in Brazil (ANVISA) recommends the atomic absorption spectrometry or ICP-optical emission spectrometry (ICP-OES) as the analytical methods employed to analyze the minerals present in dairy milk [11]. However, these methods are more expensive than the simpler methods such as flame atomic absorption spectrometry (flame photometry). Although ICP-OES have the advantage of measuring the main essential mineral and heavy metals, accurate and precise determination for Na and K remains an important challenge for such method [12].Thus, the aim of present study is to determine the concentration of Na, K and selected essential minerals (Ca+, Mg+, Fe+ and Zn) in dairy milk(UHT whole milk, chocolate flavored milk, milk compounds and milk powder), available in markets of São Luiz city, Northeastern Brazil, comparing to sodium informed on labels, and with the Brazilian standards(POF); also, to estimate sodium intake of Brazilian children aged 4-8 years, according to WHO [9] and DRI [13] recommendations, based on the intake of Na concentrations found in the studied dairy products.
2. Material and Methods
- A descriptive study related to the Na, K, Ca, Mg, Fe and Zn present in dairy milk available in the main 5 markets of São Luiz, state of Maranhão, Northeastern Brazil, was proceeded in two phases: Firstly, a chemical analysis was proceeded to measure such cations concentration in 38 selected dairy milk, using Optical emission spectrometry Inductively Coupled Plasma (ICP-OES). Later, Na and K were also analyzed by flame atomic absorption spectrometry. Na concentrations observed on both methods were compared to sodium concentrations informed on labels, and to the national standards (POF) for Na concentrations in dairy products. Secondly, we estimated a sodium and potassium intake by children of 4-8 years old, based on WHO and DRI daily dairy consumption recommendations for this age group.
2.1. Samples
- The materials studied were 38 selected dairy milk products: Whole liquid milk UHT (11 brands), chocolate flavored milk UHT (13 brands), whole milk powder (9 brands), milk compounds (5 brands; Table-1). All the dairy products were purchased from the 06 main local supermarkets (the city of São Luiz, March-June 2015). Depending on the package volume, its content was mixed and homogenized in an electric grinder. Duplicated sample of products was transferred to plastic bags and stored frozen (–20°C) until analyzed. Milk powder and milk compound products were prepared according to fabricant’s instruction. Acid digestion in vitro was performed in 1mL of all products according to the method developed by Pereira Junior et al [14]. Samples (approx. 50 mL) of digested products were stored in sterile glass recipient to proceed the essential minerals measurements, using the standardized parameter for each method (Appendix-1 to -3).
|
2.2. Analytical Methods
- OES-ICP Analysis. The ICP-OES (Varian 720-ES) employed in this study is based on a minilite Nd:YAG laser (Continuum, Santa Clara, CA, USA) operating at 355 nm, focalized to a 100-μm diameter ablation spot, with a laser pulse energy of 4.5 mJ. The ablation cell was connected to ICP-OES through a modified spray chamber; the instruments employed were a Vista Pro (Varian, Australia) or a JY 138 ultrace (Jobin Yvon Horiba, Longjumeau, France) modified for axial viewing. Modified spray chamber is made from a Scott double pass spray chamber (total volume number, 100 cm3) equipped with a double introduction system nebulizer and carrier gas from the ablation cell. The ICP-OES plasma parameters were 1,200 W for both instruments, the argon flow rate to transport ablated particles from the ablation cell was set to 0.4 L/min and a solution was nebulized to ensure wet plasma conditions (solution flow rate, 1 mL/min; Ar nebulization flow rate, 0.4 L/min on the JY138 and 0.3 L/min on the VarianVista). The JY138 spectrometer is a Czerny turner equipped with a 2,400-gr/mm grating and photomultipliers detection (integration time, 0.5 s). The Varian Vista is equipped with an echelle grating, a cross dispersion and a CCD simultaneous detection; the integration time was set to 1 s (Appendix-1 and -2).Flame atomic absorption spectrometry (flame photometry). A second measurement of Na and K concentrations was proceeded using a flame atomic absorption spectrometer model DM 64 from Digimed, equipped with a deuterium background corrector and hollow-cathode lamps. The operating conditions were chosen as recommended by the manufacturer (Appendix-3).All reagents were of analytical grade unless otherwise stated. Ultrapure water was obtained from an Easypure RF purification system (Barnstedt, Dubuque, IA, USA). Nitric acid and hydrogen peroxide were of Suprapur quality and obtained from Merck (Darmstadt, Germany). Laboratory glassware was kept overnight in 10% (v/v) nitric acid solution. Before use, glassware was rinsed with deionized water and dried in a dust-free environment. A 50 mg mL/1 copper solution was prepared from a 1000 mg L/1 copper stock solution (Merck) by appropriate dilution with 1% (v/v) nitric acid solution.Calibration solutions in the range of 0.2–2.0 mg mL/1 were prepared from a 50 mg mL/1 solution by appropriate dilution with 1.0 mol L/1 nitric acid solution. Phosphate buffer solutions of pH 6.0, 7.0 and 8.0 were prepared by dissolution of 24.20, 10.76 and 1.46 g of NaH2PO4.H2O (Merck) with 3.56, 17.67 and 27.44 g of Na2HPO4 (Merck) in ultrapure water, respectively. Ammonium buffer solutions of pH 9.0 and 10.0 were prepared by dissolution of 8.56 and 3.21 g of ammonium chloride (Merck) with 5.5 mL and 19.3 mL of ammonium hydroxide (Merck) in ultrapure water, respectively. All buffer solutions were prepared with the final concentration of 1.0 mol L/1 for a volume of 200 mL.
2.3. Data Analysis
- All mineral concentration was estimated using 200 mL of milk product as a reference. For powder products (whole milk powder and milk compounds), the standard measurement used was two full spoons that would count for 32g [15]. Brazilian Ministry of Health recommends a daily consumption of 400 mL of milk for children up to 10 years old [16]. As there is no recommendation for flavored milk consumption, we considered 600 mL daily consumption of milk drinks (200 mL of chocolate flavored milk plus 400 mL of milk) as a reference for mineral intake estimations.Both methods, ICP-OES and flame spectrometry, show results in mg/100 mL. Thus, conversions was proceeded using the equation (1)
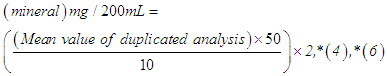 | (1) |
3. Results
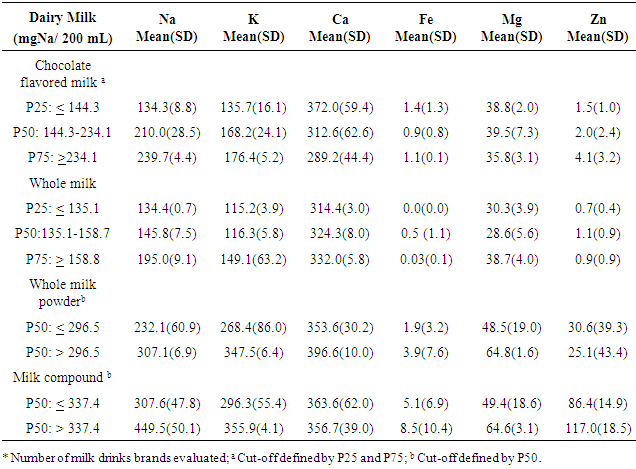
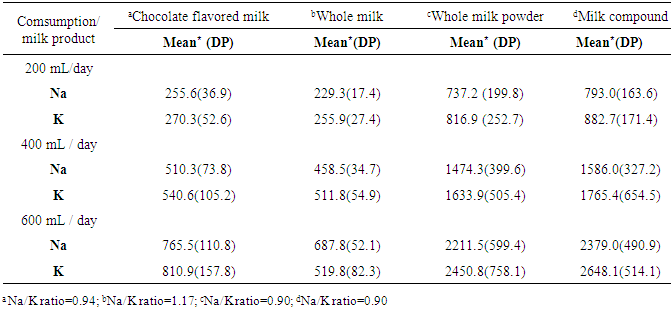
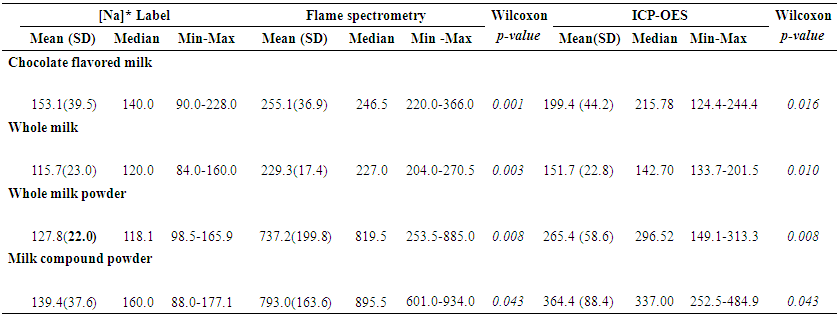
- From all dairy products available in the 5 main market of São Luiz, MA, there were 13 different brands of chocolate flavored milk, 11 different brands of UHT whole milk, 9 brands of whole milk powder, and 5 brands of milk compounds. Essential minerals distributions according to sodium content (mgNa+/200 mL) in each dairy product (ICP-OES) are presented in table-1. Mean Na content was higher than 239.7 mgNa+/200 mL ( 8.8) among 25% (P75) of flavored chocolate milk products, while in 50% of them the mean Na+ content was 210 ( 28.5) mgNa+/200 mL. Zn content also increased according to the increase of Na content of the products, varying from 1.5(±1.0) mgZn/200 mL (P25) to 4.1(3.2) mgZn / 200 mL (P75). On the other hand, Ca content decreased as the Na content increases. Highest means of Na content was observed in whole milk powder and milk compounds powder. Fifty percent of the two dairy products presented mean Na concentration of 307.1(6.9) mgNa+/200 mL and 449.5 ( 50.1) mgNa+/200 mL. Whole milk powder and milk compounds powder present the highest content level of all minerals evaluated with an increased mean of each mineral according to the percent of Na content, except for Ca in milk compound powder, and Zn in whole milk powder.Mean sodium content increased according to the amount of dairy milk consumption, reaching 2,379 (490.86) mgNa+ for an intake of 600 mL of milk compound powder. Lowest mean of Na content would be in 200 mL of whole milk (229.2717.37). However, the whole milk brands presented the highest Na+:K+ ratio (1.17). Whole milk powder and milk compounds powder presented the lowest Na+:K+ ratio (0.90), although the intake of 200 mL of each would represent an intake of over 700 mg of Na and 800 mg of K (Table-2).
|
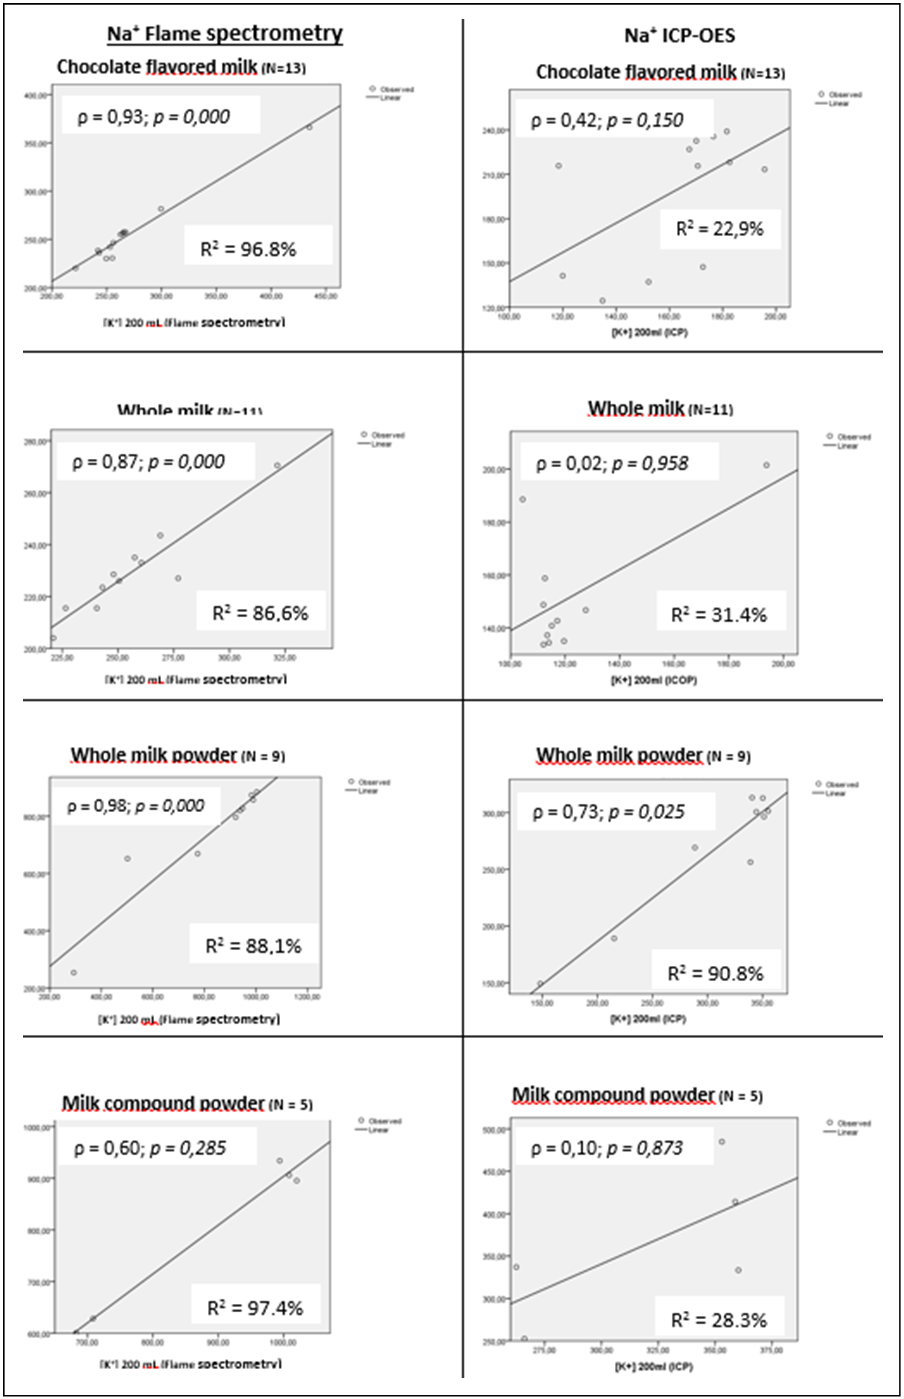 | Figure 1. Na and K correlation among selected dairy milk product, according to the chemical analysis (ICP-OES and flame atomic absorption spectrometry) |
 | Table 3. Comparisons of Na content between labeled value and observed value on dairy milk drink, according to the chemical analysis |
|
4. Discussion
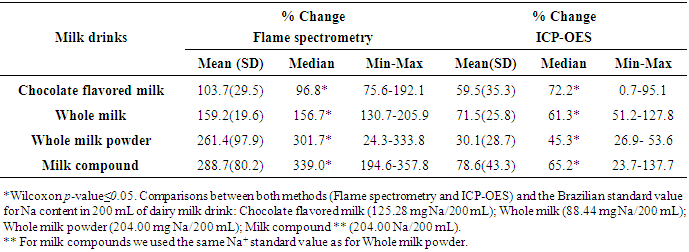
- Milk is a key source of macronutrients, Na, K, Ca, Mg, Fe and Zn for children [17, 18], and milk drinkers are more likely to meet dietary recommendations for many nutrients [19]. On the other hand, processed foods are the major source of salt in our diet contributing between 60% and 80% of Na, and therefore, salt intake [20]. Estimating sodium and other essential minerals consumed by children from a capital of Northeastern Brazil is a great challenge. Thus, present study evaluated the main brands of dairy milk (UHT chocolate flavored milk, UHT whole milk, whole milk powder, and milk compound powder) available in the markets of São Luis, state of Maranhão. Concerning to liquid dairy milk, such as UHT chocolate flavored milk and UHT whole milk, we observed that an increased consumption of brands with higher Na+ content (P75), would not mean an increasing consumption of other essential minerals. On the other hand, concerning to UHT whole milk and milk compound powder, a consumption of brands with increased Na+ content (P50) could mean an increased consumption of others essential minerals. The Dietary Guidelines for Americans recommended that children aged 2 to 8 years consume 2 cups/day fat free or low fat milk or equivalent dairy servings [21]. However, as only about a third to one half of American children boys consume the recommended number of dairy servings [22], flavored milks has become another option for meeting the recommended intakes of dairy products [23]. In this sense, the Brazilian Ministry of Health recommends a daily consumption of 400 mL of milk for children up to 10 years old [15]. However, there is no specification of the kind of milk should be served [15]. In this sense, information on the major contributors of Na from processed dairy products is important for informing Na reduction strategies. Such strategies could arise worries about the fact that monitoring Na content in processed dairy products (such as flavored milk) is not a priority for Brazilian Plan for Sodium Reduction [24].When considering dairy milk consumption recommended by WHO for children from 4 to 8 years old (200 mL of flavored milk, and 400 mL of whole milk), Na consumption in children from São Luis would be a lot higher than the recommendation for a whole day. In this sense, if children of 4-8 years old from São Luiz, MA, consume 600 mL of dairy milk (i.e. 200 mL of UHT chocolate flavored milk, and 400 mL of UHT whole milk), their Na intake would be 35.7% higher than WHO recommendation per day (2000 mg of Na) for an adult [9]. Also, if the children consume 600 mL of whole milk powder or milk compound powder, the Na intake would be respectively 86.3% and 86.5% higher than recommended for an adult per day.Considering that maximum daily Na consumption recommended by WHO of 2000 mg is for adults, it would be necessary a much lower consumption by children [9]. Thus, our findings suggest that studied dairy milk should be considered a source of Na in Brazil, since dairy milk and milk-based commercial supplements are also used as an alternative to breastfeeding in the country [27, 28]. Such studied brands of dairy milk are also largely served on children meals at schools in all states of Brazil [29, 30]. On the other hand, although Na:K ratios in such milk brands are considered high, K concentrations found meet the WHO recommendations for K consumption, while whole milk powder and milk compounds powder presented more adequate concentrations than liquid dairy milk. Such findings could suggest that consuming such dairy milk brands, would mean a sufficient K intake to balance the Na consumption in such a way that could prevent high blood pressure and other Na-related illness [25, 26]. In this sense, flame spectrometry analysis showed as statistically high correlation between Na+ and K+ (ρ>0.6) with an increased determination coefficient (R2>86%) for all studied dairy milk, except milk compound, which showed no statistical significance probably due to small sample size. When looking for ICP-OES analysis, we observed similar results for UHT flavored milk and whole milk powder, but not for UHT whole milk and milk compound (Figure-1). Such findings support that Na and K results derived from flame spectrometry method are more consistent than ICP-OES method.Therefore, another important issue is the variation in Na content found in the dairy milk products using both, flame spectrometry and ICP-OES methods, compared to the labeled values. In all dairy milk brands the mean Na content in 200 mL informed on the label of products were under 200 mg, which is 10% of a daily Na consumption recommended by WHO (2000 mg/day) [9]. However, median values observed were statistically higher then labeled ones, despite of the method used in the Na content measurement (flame spectrometry and ICP-OES methods). When considering using flame spectrometry analysis, mean Na content found in 200 mL of all dairy product was higher than 200 mg, reaching a mean value of 793 mg (±163.6) among milk compound powder. Our findings corroborate with Buzzo et al [31], who determined Na content in dairy milk products consumed in Brazil (UHT whole milk, UHT low fat milk, UHT whole milk powder) using ICP-OES method. Authors found increased mean Na content in UHT whole milk, and that 37% of the milk brands presented higher Na content than the labeled values. Such findings suggest that real Na content in the studied dairy milk brands may not meet the national law, which prohibit additions and supporting technologies/ preparation of fluid milks [32]. Such findings suggest a lack of quality control for concentration of Na in dairy products available in the Brazilian market.Comparing Na content found in the studied dairy products analyzed by flame spectrometry method with the National Standard values (POF/IBGE), we observed that the median percent change were 96.8% higher in flavored milk and 339% higher in milk compound. When comparing the results obtained by flame photometry versus ICP-OES methods, the median percent changes were statistically higher using flame spectrometry than by ICP-OES. However, even by ICP-OES method, the median percent change of Na content ranged from 45.3% higher than the national standard in whole milk powder to 72.2% higher among flavored milk.Such an increased Na+ content observed in the studied dairy product support the hypothesis of a possible use of unsuitable technological procedures for dairy milk production, which should aim the Na reduction. However, the Brazilian norms for addition use in dairy products allow a number of sodium-based chemicals such as stabilizer in liquid milk, milk beverage and dairy compound (INS 339 i, 339 ii, 339 iii, 407, 331 iii), anti-caking/anti-wetting agent in powdered milk (INS 554), emulsifier (INS 481i) and conservative (INS 201), dyes (INS 101ii), thickener/ stabilizers (iN 401, 407 and 466) in milk drinks. Many of these additives does not have any restriction on the use for sodium sorbate (INS 201) [33]. Although WHO already stablished that the maximum limit for Na content should be 5,000 mg/Kg for dairy milk products [34, 35], there is no Brazilian laws determining the maximum limit for stabilizer in UHT liquid milk, milky drinks and dairy compound, which contradicts the international system additives numbering proposed by Codex Alimentaruis [34].A major problem is that besides being stabilizer, INS group 331 additives have other technological purposes such as emulsifier, sequestrant, acidity regulator and antioxidant [35, 36]. Moreover, INS 339 group additives have above mentioned purpose and has also a conserving function, which is not allowed under Brazilian law for the production of liquid milk and most products, except for milk beverages [35].Although present study has the limitation of not using Certified Reference Materials (CRMs), described by the National Institute of Standards and Technology (NIST), such as SRM 8435 (Whole Milk Powder) and SRM 1549 (Non Fat Milk Powder) for calibration of ICP-OES equipment, the analytical procedure used for calibration (calibration curve) of the equipment is considered suitable for the minerals analyzed (Appendix 1 and 2). Also, although we used the wet digestion technique instead the dry digestion, such strategy did not seem to affect the validity of results, since Kira & Maihara (2000) have compared both techniques for determining Ca, Cr, Cu, Fe, K, Mg, Mn, Na, P and Zn in dairy products, finding no differences between them [37].On the other hand, the strengths must be considered, since this is the first study in Brazil aiming to evaluate Na content and other essential minerals (K, Ca, Fe, Mg, Zn) contents in dairy milk products available in the markets of a capital from Northeastern of Brazil. Also, this was the first study to compare the Na content in 200 mL informed in the label with the Na content observed in the product and with the National Standard values (POF), based on two different methods (flame spectrometry and ICP-OES). Another point that must be highlighted is that we used two different accurate chemical methods (flame spectrometry and ICP-OES) to estimate Na and K contents in the studied dairy products. In this sense, we observed that results might vary according to the dairy drink evaluated, suggesting that flame spectrometry could generate results more stable and accurate than ICP-OES. Such findings support the Ministry of Agriculture Supply (MAPA) that recommends flame spectrometry method for determining Na and K contents in animal derived products, since this is a relatively simple and cost-effective technique [38].
5. Conclusions
- Sodium contents observed in studied dairy products were statistically higher than the labeled values and the national standard values, regardless of the chemical method used (flame spectrometry and ICP-OES). Furthermore, we observed that brands with higher Na contents not necessarily presented higher contents of other essential minerals analyzed (Ca, Fe, K, Mg, Zn). Flame spectrometry method was more efficient and accurate than ICP-OES to determine Na+ and K+ contents in all studied dairy products. Also, children consume of 600 mL of any studied dairy products available in the markets of São Luis, MA, would represent a Na intake 10% to 86.5% higher than a daily Na intake recommended by WHO and DRI for adults (up to 2000 mg).
ACKNOWLEDGEMENTS
- This study was funded by the National Counsel of Technological and Scientific Development (CNPq) and the Coordination for the Improvement of Higher Education Personnel (CAPES) through the Master’s program established between the Federal University of Acre (Masters in Public Health) and the National School of Public Health, Oswaldo Cruz Foundation (Public Health and Environment Postgraduate Program). All of them have academicals purpose only. Authors also thank Dr. Sergio Koifman (in memoria) for idealizing and coordinating the interinstitutional Mater’s program between IFMA and Ensp/Fiocruz.