-
Paper Information
- Paper Submission
-
Journal Information
- About This Journal
- Editorial Board
- Current Issue
- Archive
- Author Guidelines
- Contact Us
Food and Public Health
p-ISSN: 2162-9412 e-ISSN: 2162-8440
2016; 6(5): 115-122
doi:10.5923/j.fph.20160605.02

Survey of Food Waste Generated by Western Australian Fruit and Vegetable Producers: Options for Minimization and Utilization
 Abstract
 Reference
 Full-Text PDF
 Full-text HTML
Purabi R. Ghosh1, Derek Fawcett1, Shashi B. Sharma2, Devindri Perera3, Gerrard E. J. Poinern1
1Murdoch Applied Nanotechnology Research Group, Department of Physics, Energy Studies and Nanotechnology, School of Engineering and Energy, Murdoch University, Murdoch, Australia
2Department of Agriculture and Food, 3 Baron Hay Court, South Perth, Australia
3Mathematics and Statistics, School of Engineering and Energy, Murdoch University, Murdoch, Australia
Correspondence to: Gerrard E. J. Poinern, Murdoch Applied Nanotechnology Research Group, Department of Physics, Energy Studies and Nanotechnology, School of Engineering and Energy, Murdoch University, Murdoch, Australia.
| Email: |  |
Copyright © 2016 Scientific & Academic Publishing. All Rights Reserved.
This work is licensed under the Creative Commons Attribution International License (CC BY).
http://creativecommons.org/licenses/by/4.0/

Food waste in Australia is estimated to cost around AUS$8 billion annually. This large unacceptable amount of wastage results in significant economic losses, inefficient use of resources and the adverse impact on the environmental. The present study collects primary data via a specifically designed questionnaire that was circulated around the 19 major farmers (fruits and vegetables) markets located around Western Australia. A total of 88 growers’ participated in the survey. The survey consisted of 12 targeted questions that collected participant demography and farming practices. The questionnaire also focused on reasons for not harvesting or selling produce, how waste is currently handled, options for reducing waste and approaches to better utilize fruit and vegetable wastes. An important issue identified by the survey was the need for consumer education that is specifically aimed at promoting the consumption of produce with cosmetic defects. The rejection of produce on purely visual appearance was found to be a major cause for food wastage.
Keywords: Food waste, Sustainable food system, Food security, Waste utilization
Cite this paper: Purabi R. Ghosh, Derek Fawcett, Shashi B. Sharma, Devindri Perera, Gerrard E. J. Poinern, Survey of Food Waste Generated by Western Australian Fruit and Vegetable Producers: Options for Minimization and Utilization, Food and Public Health, Vol. 6 No. 5, 2016, pp. 115-122. doi: 10.5923/j.fph.20160605.02.
Article Outline
1. Introduction
- The Food and Agriculture Organization (FAO) of the United Nations has estimated that around one-third of all food produced globally for human consumption, equating to approximately 1.3 billion tons per year, is lost or wasted [1]. A study by Lundqvist et al. has suggested that this lost or wasted portion could be as large as half of all global food production [2]. The level of lost or wasted food is of paramount importance since estimates of world population indicate that by 2100 there will be a population of around 12.3 billion to feed [3]. This means a further 5 billion people will need to be fed. But current global population estimates indicate that around two billion people are under feed and approximately 21,000 people each day die from hunger related causes. This equates to around 15 people dying each minute, with children accounting for 10 of the deaths [4]. Thus, there is a high demand for food resources to meet the current need and there will be an even greater demand placed on food resources to meet future population requirements. The growing demand for food resources and the associated high levels of food waste will increase food prices globally in the near future. This situation will make it even more difficult for people in the world’s poorest nations to purchase food [5]. In addition to the financial problems associated with increasing food production and delivering affordable food products, there will also be increasing problems resulting from environmental degradation. There will also be flow on effects resulting from the usage of large quantities of resources such as fertilizers, pesticides, water and energy that are normally required in modern farming practices [6-9]. Furthermore, increasing food production will also result in larger amounts of food wastes being produced. As a consequence food wastage is becoming a major factor in addressing long term sustainability and food security [10].To identify and determine the amount of food waste produced by food supply chains, several developing and developed countries have examined waste levels at each stage in the supply chain [1, 11, 12]. A number of studies have even examined food waste generation and management at both local community and regional levels [13, 14]. Many of these studies have identified significant information gaps regarding the causes of food wastage. These causes can range from poor harvesting technologies, lack or inefficient transport and even inadequate storage facilities. The studies also reveal that food waste is not the result of a single cause, but is generally the result of a combination of causes. The situation is exacerbated by the effects of land degradation, extreme weather events and changing climatic conditions [10]. In Australia very few studies have examined the level of food waste generated by fruit and vegetable producers. A recent Australian study revealed that around 25% of all vegetables produced annually, equating to around AUS $155 million dollars end up as waste [15]. The Australian agricultural food supply chain is a major part of the country’s economy and includes farm production, food processing and retail food sales. The food supply chain currently generates revenue estimated to be around AUS $230 billion dollars annually [16]. Agricultural production contributes between 15 and 20% to the income derived from annual exports, and contributes around 3% to Australia’s Gross Domestic Product (GDP) [16]. Fruits and vegetables forms the third largest agricultural sector in Australia. A recent report revealed that the Gross Value of Production (GVP) of the sector was estimated to be AUS $9.0 billion dollars between the 2010 and 2011 period. This estimate exceeded the AUS $6.5 billion dollars calculated for the 2004-05 period and clearly indicates significant growth in the sector [17]. However, a recent report produced by the Australian state of Tasmania found that between 30 and 40% of all vegetables grown in the state ended up as waste. The wastage results from produce not meeting visual and quality guidelines specified by retailers. For example, more than 150 tons of carrots worth many thousands of dollars were ploughed back into the field because the carrots were too large to sell in the market [18]. Financially, this level of wastage adds a significant burden to producers and is ultimately paid for by consumers. From an environmental perspective, Australian agricultural practices currently contribute around 16% to the countries greenhouse gas emissions. These emissions result from cropping and other food production related activities [16, 17]. Moreover, large areas of the Australian landmass are prone to drought or low rainfall and as a result current food production related activities consumes around 17, 000 Giga-liters of water each year. At present, Australian farmers contribute around 93% to the domestic produce market [16]. However, an increasing population, climate change and environmental degradation will make economically sustainable food production more difficult in the future. Hence, there is an immediate priority to identify and determine the extent of food waste at the state and national level in Australian.In the Australian state of Western Australia, a wide variety of fruits and vegetables are commercially grown. There are predominantly four regions in Western Australia were fruits and vegetables are grown. In the southwest of the state the two regions are the South West coastal plains and the South West high rainfall hills. In the north of the state the two remaining regions are the Gascoyne irrigation area and the Ord River irrigation area. A wide variety of produce is grown, typical crops produced include broccoli, carrots, potatoes and tomatoes. Many other fruits, vegetables and herbs are also grown in the various regions. These different geographic locations and differing production environments enables the state to produce vegetables throughout the whole year [19]. For example, farm gate value of vegetable production in Western Australia for 2012 was estimated to be around AUS $336 million dollars, which equated to a retail value of about AUS $1 billion dollars. However, high vegetable crop productivity also requires higher inputs compared to cereal crops. For example, fertilizer inputs for vegetables are typically 20 times higher, soil cultivations are two to five times higher and as many as 10 times higher for spraying and other machinery related operations. Furthermore, vegetable crops must have extensive fresh water irrigation, since most of Western Australia has relatively low rainfalls. The production of fruits and vegetables is predominantly confined to the more temperate southern region of the state. The region begins around Gingin to the north of Perth, the capital city of the state (31º 57′ S, 115º 51′ E), down to Albany located on the southern coast as seen in Figure 1. The prevailing weather conditions in this region are conducive for the cultivation of a wide variety vegetables and orchard fruit crops such as apples and stone fruits [20].
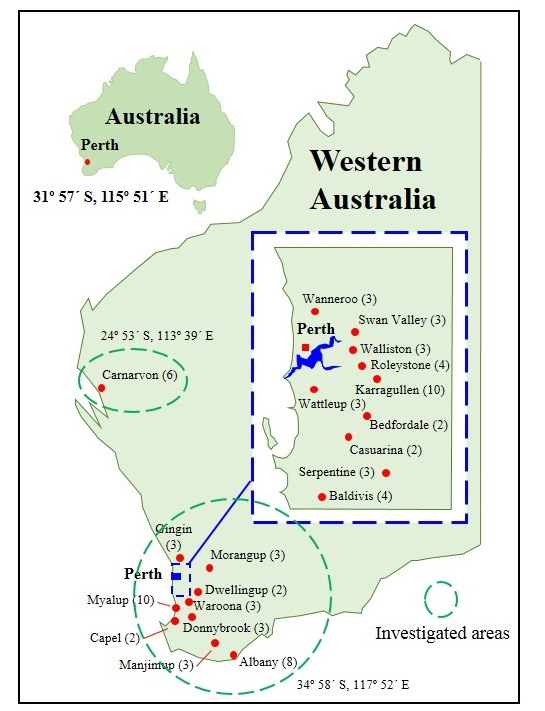 | Figure 1. Location of fruit and vegetable producers in Western Australia who participated in the present study |
2. Materials and Methods
- The study was based on collecting primary data via a specifically designed questionnaire that was answered by fruit and vegetable producers located at various locations around Western Australia. Fruit and vegetable producers were contacted and surveyed through farmers’ markets and producer (growers) associations across Western Australia. The questionnaire was sent directly to fruit and vegetable producers by email using an online survey link. An advertisement for the survey questionnaire was also published in the Western Australian grower’s magazine, where growers were requested to follow the survey link to participate. In addition, a walk in and hand-out of survey questionnaires and personal interviews were also carried out to gain maximum coverage and response. The survey was also aimed at farmers’ markets that sell directly to consumers, and farmers who sell directly to wholesalers who ultimately sell the produce to retailers. Farmers’ markets were targeted because they are rapidly growing in popularity as an alternative method for small producers to sell their produce direct to consumers. Many consumers around the state find farmers’ markets an attractive alternative way of purchasing fresh and locally produced fruits and vegetables. Farmers’ markets operate throughout the state, as far north as Carnarvon, as far south as Albany and as far east as Esperance. Farmers’ markets can also be found in the surrounding Perth suburbs. Farmers’ markets have also proven popular with fruit and vegetable producers because they provide the opportunity to diversify farm income via higher profits, less handling & transport and shorter storage times.Studies by other researchers have found estimating fruit and vegetable waste difficult and often results in inconsistent data. As a consequence of this inconsistency two main approaches have been developed and are generally used to measure food wastage in food supply chains. The first approach is to directly measure actual wastage and the second approach uses questionnaires to estimate the levels of wastage reported by respondents. The problem with the first approach is that it assumes all quantities are know from the start, and generally this is not the case [26]. Historically, qualitative losses are much more difficult to assess than quantitative losses [27]. For example, failure of fruit and vegetable produce to meet specific quality requirements results in reduced market values [25]. Quality management of fruits and vegetables in developed countries like Australia is paramount, since any downgrade of quality leads to less consumer appeal. In this study a structured questionnaire based on the Investigative Survey Research Approach (ISRA) was administered [28]. The questionnaire enabled respondents to provide both subjective and quantifiable information on various aspects of crops harvested, produce sold and aspects of waste management. The study also gave producers a range of answer choices to assist them in completing the survey questionnaire. To develop these various answer choices an extensive literature review was carried out and particular emphasis was placed on farming method, reasons for not selling and possible future waste reduction and utilization methods. The majority of questions had multiple choice answers based on the literature reviews and respondents were asked to rank their answer choice from 1 (most/best reason) to 6 (least reason). All survey participants were provided with an information letter that fully explained the character of the questionnaire as required by human ethics and confidentiality procedures by Murdoch University.
3. Data Administration and Analysis
- The first stage of the survey was to contact and hand out questionnaires to the growers’ at the 19 farmers markets located around Western Australia. Some participants were surveyed in person [51.1% (45)], while the remainder were contacted by telephone [1.2% (1)], by email [14.8% (13)], and via online survey link [32.9% (29)]. After a period of 26 weeks a total of 88 growers’ had participated in the survey. The survey data was then classified into meaningful categories and translated into excel spread sheet templates before the application of statistical parameters such as frequency and percentage [29]. The Statistical Package for the Social Sciences (SPSS) program (Version 21) was used to analyze the data. Analysis identified three main themes: 1) the distinction between produce received and produce waste; 2) reasons for waste generation and, 3) waste reduction and waste utilization preferences. The software program Nvivo7 (QSR International, 2006), developed for qualitative text analysis, was also used to analyze open-ended question answers. Respondents were also requested to state their own thoughts about waste generation, waste reduction and utilization approaches in the ‘other’ sections of the four questions forming the second half of the questionnaire. The responses in the ‘other’ sections were analyzed by text analysis software which has an element of subjective judgment on how to attribute the response criteria to each of the particular questions.
4. Results and Discussions
- The survey questionnaire consisted of two parts. The first part examined the demography of the participants and specific farming practices. While the second part of the survey focused on options for minimization and utilization of waste fruits and vegetables. The first portion of the demography section requested information regarding farmer gender, age and location of farming property within the state of Western Australian. In terms of gender, 71.59% of the 88 participants (63) were male and 28.41% (25) were female as indicated in Figure 2(a). The age distribution of participants revealed that the majority of participants (84%) were between the ages of 35 and 64. While participants under the age of 35 accounted for only 5.68% of the total number of participants. While participants aged 65 and over was estimated to be 10.23% of the total number of participants as seen in Figure 2(c). The survey also revealed that the vast majority of participants were located in the more temperate southwest region of the state. With 37 of the 88 participants located within the Perth metropolitan area and only 6 participants located in the northwest of the state (Carnarvon) as seen in Figure 1.The second portion of the demography section requested information on farming method used, major cultivated crop, cultivation area per year, harvested area per year and percentage of total produce sold at the market. This part of the survey revealed that the majority of the participants (64, equivalent to 72.41%) used conventional farming methods and the remaining participants (24, equivalent to 27.59%) practiced organic growing practices as presented graphically in Figure 2(b). The production of high quality produce occurs throughout Western Australia. Because of the state’s large geographical expanse many fruits and vegetables can be grown throughout the year. Major fruits and vegetables produced include apples, baby leaf salads, avocadoes, carrots, potatoes, onions and tomatoes. Other fruits and vegetables include stone fruits, mangoes, watermelons, mushrooms and other smaller scale fruits, herbs and vegetables are listed in Figure 3. In terms of land usage, the majority of participants (55, equivalent to 62.50%) cultivated farm land ranging in area from 1 to 10 hectares. Larger areas, greater than 40 hectares, were cultivated by 22.73% (20) of the participants and the remaining participants (13, equivalent to 14.78%) cultivated land ranging in area from 11 up to 40 hectares as seen in Figure 4(a). While 53.41% (47) of participants surveyed revealed that their harvested area was equivalent to 100% of their cultivated area. Interestingly, 87.50% (77) of participants reported their harvesting area was between 71 and 100% of their total cultivated area, while 12.5% (11) reported their harvesting area was less than 60% of their total cultivated area as seen in Figure 4(b).
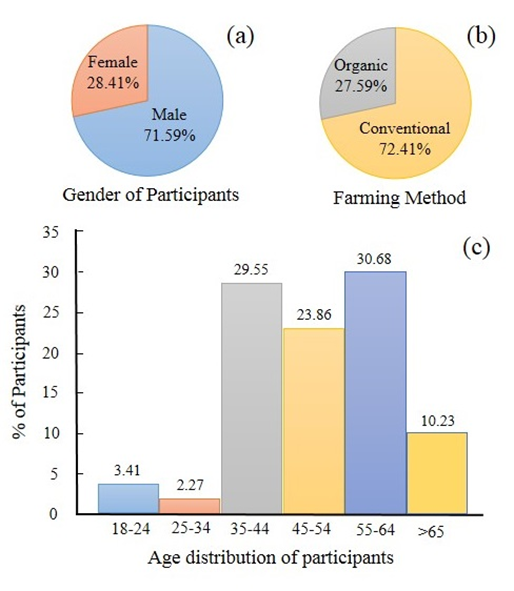 | Figure 2. (a) Gender of participants, (b) farming method used and (c) age distribution of participants |
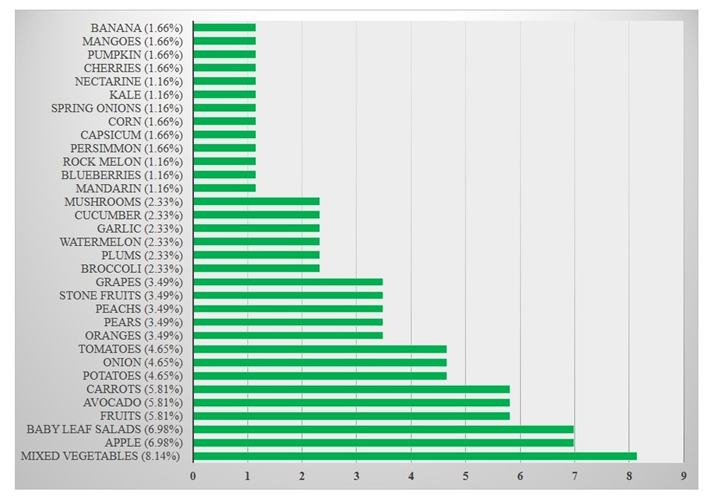 | Figure 3. Percentage breakdown of major fruits and vegetables produced in Western Australia |
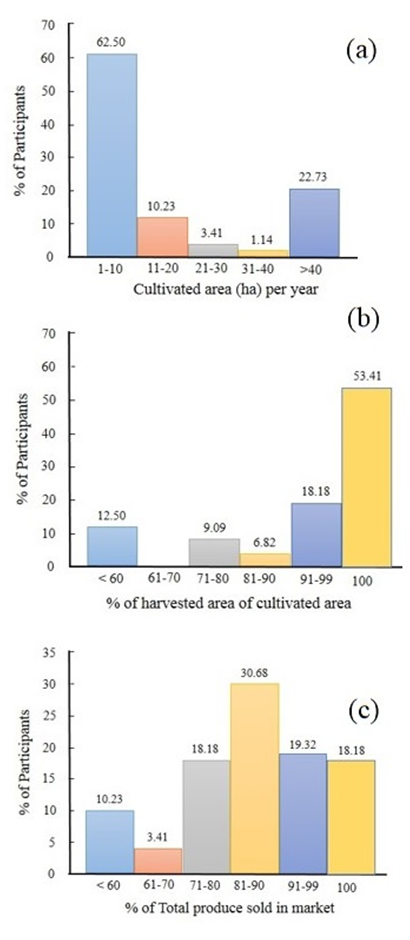 | Figure 4. Levels of land cultivation, harvesting area and produce sold in the market: a) Cultivated area per year; b) percentage of harvested area of cultivated area, and c) total produce sold in the market |
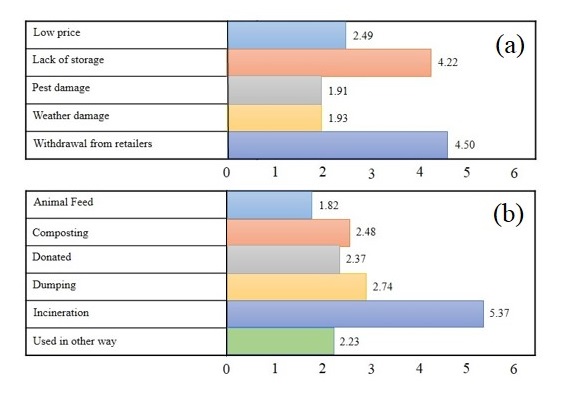 | Figure 5. (a) Reasons for not harvesting or selling and (b) What is done with the waste |
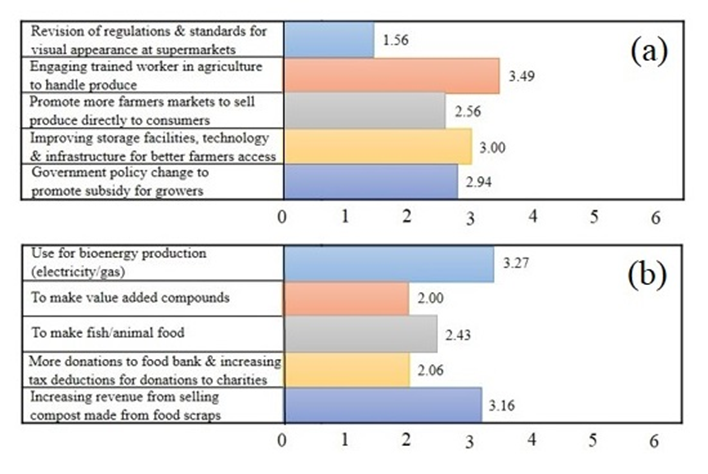 | Figure 6. (a) Methods to reduce food wastes and (b) Methods of utilizing food waste better |
5. Conclusions
- The present study examined options for reducing and utilizing fruit and vegetable waste generated by produces operating at 19 major farmers markets located around Western Australia. A survey questionnaire consisting of 12 targeted questions was circulated and 88 fruit and vegetable producers responded. The survey identified that both organic and conventional farming methods considered pest damage and weather damage as the main reasons for not harvesting or selling produce. The study found that the majority of participant produce waste levels ranging from 0 to 30% and continue to supply even when lower market prices prevail resulting in greater amounts of waste. Thus, better communication between all parties regarding produce demand could maintain profitable produce prices and reduce waste levels. Participants also believed consumer education that highlighted nutritional value and promoted the consumption of produce with cosmetic defects was an effective method of reducing waste levels.
ACKNOWLEDGEMENTS
- Mrs Purabi Ghosh would like to acknowledge Murdoch University for providing her PhD Scholarship to undertake the present study. This work was partly supported by Horticulture Innovation Australia Project Al14003 and Derek Fawcett would like to thank Horticulture Innovation Australia for their research fellowship.