-
Paper Information
- Paper Submission
-
Journal Information
- About This Journal
- Editorial Board
- Current Issue
- Archive
- Author Guidelines
- Contact Us
Food and Public Health
p-ISSN: 2162-9412 e-ISSN: 2162-8440
2016; 6(5): 107-114
doi:10.5923/j.fph.20160605.01

Ochratoxin A in Wines and Evaluation of Consumer Exposure
 Abstract
 Reference
 Full-Text PDF
 Full-text HTML
Priscilla Silva de Abreu1, Michelle Ferreira Terra2, Guilherme Prado3, Wilder Douglas Santiago4, Maria das Graças Cardoso4, Carolina Valeriano1, Luís Roberto Batista1
1Federal University of Lavras, Department of Food Science, Brazil
2Federal University of Lavras, Department of Microbiology, Brazil
3Ezequiel Dias Foundantion, Brazil
4Federal University of Lavras, Department of Chemistry, Brazil
Correspondence to: Priscilla Silva de Abreu, Federal University of Lavras, Department of Food Science, Brazil.
| Email: |  |
Copyright © 2016 Scientific & Academic Publishing. All Rights Reserved.
This work is licensed under the Creative Commons Attribution International License (CC BY).
http://creativecommons.org/licenses/by/4.0/

The purpose of this work was to assess the incidence of ochratoxin A (OTA) in wines, as well as the risk of human exposure to this toxin. The estimate of OTA content was by means of high-performance liquid chromatography based method. Thirty-eight samples were analyzed, from which 27 red wines, 7 white wines, two rosé wines, and two fortified wines. Samples were grouped into domestic and imported wines. Mathematical equations were used to assess the aggregate exposure, seeking to evaluate the human risk to OTA. The detection limits and OTA estimate were around 0.16 and 0.56μg.kg-1 respectively. About 36.84% of samples showed OTA contamination, all of them imported. From these samples, about 85.71% showed levels of OTA contamination less than 2μg.L-1. Results indicate that the consumption of analyzed wines does not imply OTA contamination for the population under study.
Keywords: Risk evaluation, Contamination, Intoxication, Toxin
Cite this paper: Priscilla Silva de Abreu, Michelle Ferreira Terra, Guilherme Prado, Wilder Douglas Santiago, Maria das Graças Cardoso, Carolina Valeriano, Luís Roberto Batista, Ochratoxin A in Wines and Evaluation of Consumer Exposure, Food and Public Health, Vol. 6 No. 5, 2016, pp. 107-114. doi: 10.5923/j.fph.20160605.01.
Article Outline
1. Introduction
- The ochratoxin A (OTA) is a secondary metabolite produced by species of filamentous fungi belonging to the Penicillium and Aspergillus genera (EC, 2006; Brera et al., 2011). The occurrence of this toxin in food has been extensively reported, mainly in cereals and derivatives from cereals, coffee, cocoa, beer, grape, grape juice, dehydrated fruits, medicinal plants, and wine; these being considered the second most important source of OTA for humans in Europe (CAC, 1995; Miraglia and Brera, 2002).The ochratoxigenic species have been found in temperate and tropical climate regions, and they are found in soil and organic matter, resulting in grapes contamination during the berry growth period. By having a very stable molecule, this mycotoxin is not degraded during processing, and may remain in large amount of food (Murillo Arbizu et al., 2010).The presence of this toxin in food and beverage is found to be a risk toward population, because OTA has carcinogenic, nephrotoxic, teratogenic and immunosuppressive properties (Solfrizzo et al., 2010), being classified as a possible human carcinogen (group 2B) (IARC, 1993).After the first report of occurrence of OTA in wine (Zimmerli and Dick, 1996), various studies were performed to evaluate the presence of this mycotoxin in wine and in wine derivative products (Stefanaki et al., 2003; Ratola et al., 2004). Such results had caused considerable concern about potential risk to human health, by the consumption of these products (Tjamos et al., 2004), showing an increasing need to use tools that not only detect the presence of the toxin in the food, as well as assess the exposure risk to this substance. A model that has been increasingly used in many studies is the evaluation of risk, which contributes to take control steps by means of scientific evidences (WHO, 2006).Considering the importance of risk assessment in the management of food safety, and the existing poor knowledge about this subject in Brazil, as well as the increase in wine intake recorded in the country; this study was performed aiming to assess the human exposure risk to OTA, resulting from the consumption of domestic and imported wines.
2. Material and Methods
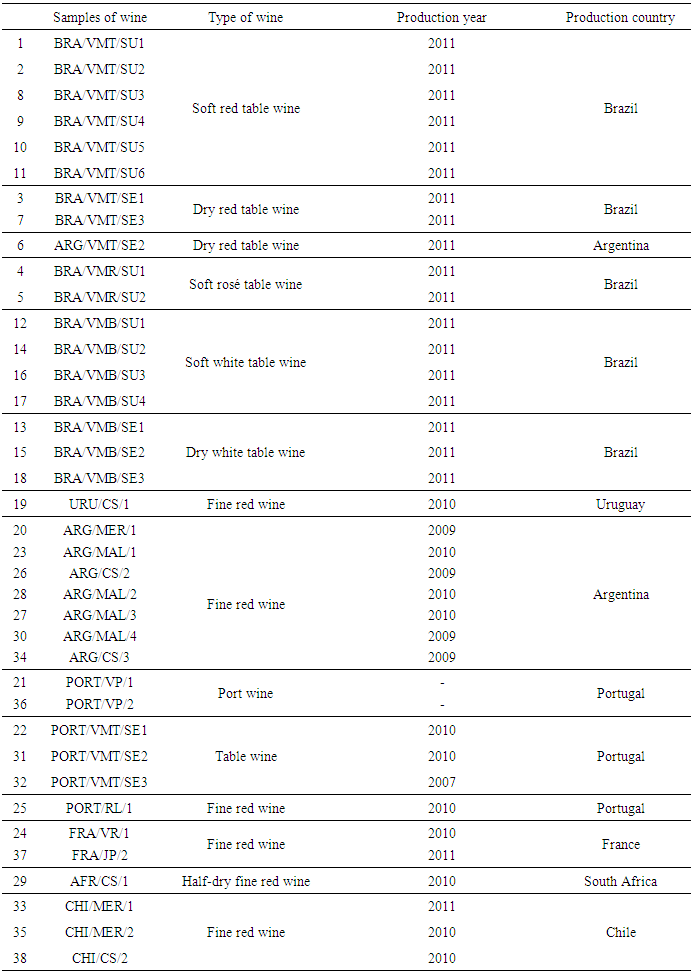
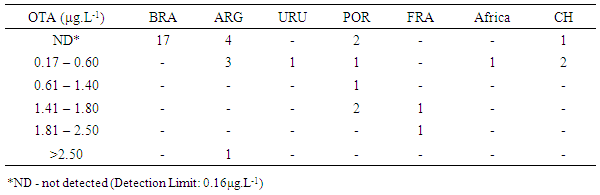
- Thirty-eight wine samples were randomly obtained in different commercial establishments of Lavras, State of Minas Gerais, Brazil. Then, they were analyzed after being grouped in twenty-seven red wines, seven white wines, two rosé wines, and two fortified wines. Samples were grouped into domestic (table wines) and imported (fine wines) brought from France, Portugal, Argentina, Chile, Uruguay and South Africa (Table 1). The most part of samples consisted of table wines from Brazil (17), followed by wines from Argentina (8), Portugal (6), Chile (3), France (2), Uruguay (1) and South Africa (1).The high-performance liquid chromatography (HPLC) method was used to estimate the content of OTA in wine samples, which uses the fluorescence detection system, as outlined in EN 14133/2003 (EN, 2003).
|
2.1. Solution and Reagents
- A dilution solution was prepared by dissolving 10 g of Polyethylene Glycol 8000 and 50g of sodium bicarbonate (NaHCO3) in 1000mL of purified water. For obtaining the washing solution, 25g of sodium chloride (NaCl) and 5g of sodium bicarbonate were dissolved in 1000mL of purified water. The OTA Sigma stock solution (St. Louis, MO, USA) was prepared in toluene: acetic acid (99:1 v/v). The concentration was estimated according to the Association of Official Analytical Chemists (AOAC, 1997), and was verified in spectrophotometer at 333nm, with e = 5.440 cm-1mol-1.L. The working solution was prepared by the appropriate dilution in toluene: acetic acid (99:1 v/v) for the recovery testing and calibration curve. For the mobile phase, the acetonitrile: methanol: aqueous acetic acid (35:35:30) was used, followed by vacuum filtration through regenerated cellulose membranes PTFE about 0.45 µm. The aqueous acetic acid was prepared using glacial acid acetic solution in purified water (1:29 v/v). Solutions were stored in dark, at temperature from -15°C to -20°C.
2.2. Preparation of Samples and Purification in Immunoaffinity Column
- Firstly, samples were cooled to 4°C. For each sample, 40 mL were added to 40mL of dilution solution and homogenized under mechanical stirring on a shaker at medium speed for 30 minutes. This solution was subjected to vacuum filtration (2mL per minute) in GFA membrane and, 40mL of the filtrate were passed through an immunoaffinity column (Ochraprep, R-Biopharm Rhône Ltd) adapted to the Visiprep TM SPE Vacuum Manifold system. The column was washed using 10mL of washing solution and, then, using 10mL of purified water for the removal of non-specific residues. Subsequently, 2mL of methanol was added to the column for the release of OTA bound to the antibody, with repetition of the procedure for three times. The eluate was evaporated with heating samples (at around 50°C) under nitrogen atmosphere. The dried extract was reconstituted in 250µL of the mobile phase. Fifty µL of standard solutions of OTA and of extracts of samples were injected in the liquid chromatograph.
2.3. Quantification of Ochratoxin A by Liquid Chromatography
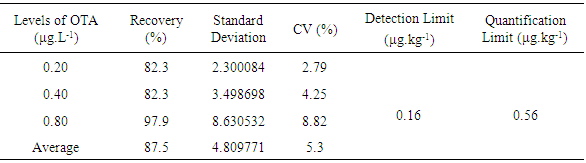
- The equipment used was the Shimadzu High-Performance Liquid Chromatograph (HPLC), equipped with two high-pressure pumps, model SPD-M20A; degasser, model DGU 20A3; interface, model CBM-20A; automatic injector, model SIL-10AF; and fluorescence detector RF-10 AXL. The column was the Agilent-Zorbax Eclipse XDB-C18 (4.6 × 250 mm, 5µm) connected to a guard column Agilent-Zorbax Eclipse XDB-C18 4-Pack (4.6 × 12.5 mm, 5 µm).The wavelength chromatographic conditions were as follows: excitation at 332nm and emission at 476nm. The flow rate throughout the analysis was about 0.8mL.min-1 and, the injected volume of samples, as well as of the standard, was 20µL. The elution was carried out in an isocratic system of 35:35:29:1 (methanol: acetonitrile: water: acetic acid). The OTA quantification in samples was carried out by developing a calibration curve obtained by linear regression (y = 1.11756x10⁷x – 2592.1485; where y = peak area and x = concentration of OTA), correlating the peak area versus the concentration of the respective standard solution. The coefficient of determination (r2) was 0.9999. The detection limit (DL) and quantification limit (QL) were estimated by means of parameters obtained for the calibration curve, and estimated by means of their mathematical relations: DL = 3SD/m and QL = 10SD/m (where SD = estimate of Standard Deviation of the regression line and m = angular coefficient of the calibration line) (Harris, 2008). Then, estimates about 0.0004 and 0.0016 μg.g-1 respectively were found. All samples were analyzed in duplicate, while standard solutions of OTA were injected in triplicate.Confirmation of the presence of OTA was determined by the formation of methyl esters, which resulted in the increase of retention time of samples due to OTA derivatization. From the estimate of OTA peak area of samples extracts, and of standard solutions, the content of OTA in samples was quantified. In the analysis conditions, the retention time was about 9.99±0.56 minutes. The DL and QL were 0.16 and 0.56μg.L-1 respectively.To ensure calibration quality of results, recovery trials were performed. Wines were fortified in three levels with concentrations equal to 1.0ng.mL-1, 2.0ng.mL-1, and 4.0ng.mL-1; in triplicate. They were extracted using methanol and analyzed according to the previously described methodology.The following recovery rates were respectively obtained: 82%, 82% and 98%; which proved the excellent reproducibility of the method; in accordance with rules of the CODEX, in the criteria of performance of calibration methods, between 70% and 110% of recovery (CAC, 1995).To assess the human exposure to OTA found in elements under study, the analysis of the daily mean intake quantity of wine was performed. According to the obtained values, an estimate of exposure was obtained using the following equation:
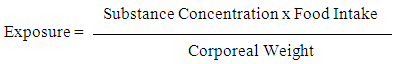 The estimate to assess the aggregate exposure was carried out according to deterministic method; on which fixed, punctual, concentration, and intake values were used according to results obtained from analyses of wines.The estimate of daily intake in mg.kg-1 corporeal weight per day was carried out considering the sum of wine intake by the population under study, using the following equation:Ingestion = Ʃ Ri x C1/Corporeal Weight, where:R is the substance concentration in the wine i in mg.kg-1 and C is the daily intake of the beverage by the population or individual, in liters (WHO, 1997).Experiments were established in completely randomized design with ten replications per treatment and, for the statistical analysis, the SISVAR statistical package was used. The analysis of variance was carried out, and means were compared by the Scott Knott (1974) test at 5% significance.An exploratory data analysis, correlating the content of OTA with the origin, type of grape and type of wine, was carried out by means of principal component analysis (PCA). Data were processed in a matrix containing samples of wine arranged in rows, and variables in columns. The qualitative variables considered here were: (i) Brazil, Uruguay, Argentina, Portugal, France, South Africa and Chile - for the origin; (ii) table wine, Cabernet Sauvignon, Merlot, from Port, Malbec and Cabernet-syrah - for type of grape; and (iii) soft red wine, dry red wine, soft rosé wine, soft white wine, dry white wine, fine red wine, and fortified wine - for type of wine. These variables were expressed as binary values: 0 = out of class, and 1 = belongs to the class. Data were autoscaled, and the PCA was run. Results were shown in score and weight charts for the first two principal components. The Chemoface v1.5 software was used for the analysis (Nunes et al., 2012).
3. Results
3.1. Standardization of the Analytical Methodology
- The calibration curve obtained from the linear regression equation, and estimated by the least square method, was linear, and ranged from 0.4 to 10μg.L-1.The mean recovery values and coefficients of variation for wines were 87.5% and 5.3%, respectively (Table 2). These results are within the recommended standards in EC 401/2006 (EC, 2006) for contamination values below 1.0μg.L-1 and between 1.0μg.L-1 and 10μg.L-1.
|
3.2. Occurrence and Levels of Ochratoxin A in Wines
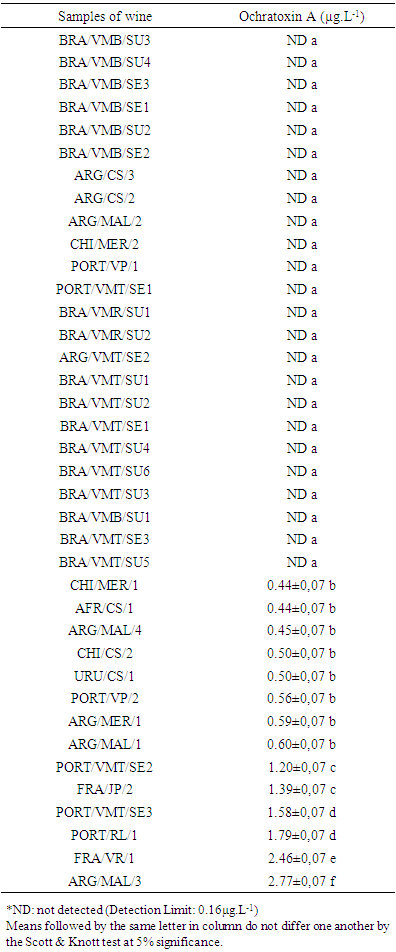
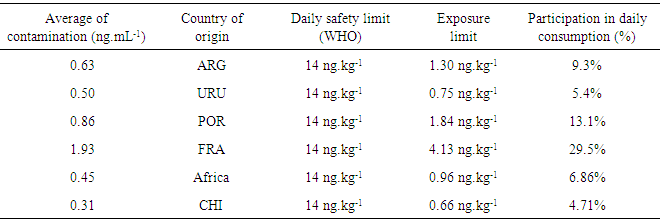
- The incidence and mean values (minimum and maximum) of OTA found in wine samples are described in the Table 3. As can be seen, the mean levels of OTA of contaminated wines are considered different among the six groups statistically defined (a, b, c, d, e and f) by the Scott Knott test (p<0.05).
|
|
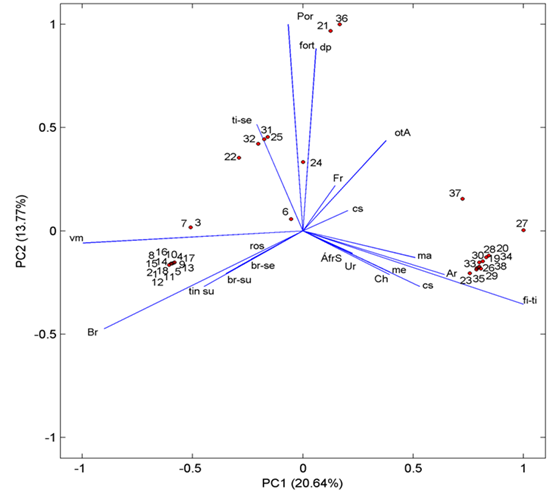 | Figure 1. Relation between the presence of ochratoxin A and the analyzed variables. The numbering of samples corresponds to the numbering showed in the Table 1 |
|
4. Discussions
- In this study, the presence of OTA was not detected in any sample of domestic wine. Thus, considering that the production of OTA by A. carbonarius is favored in low temperatures (from 15 to 20°C), the climate conditions of European countries are more suitable for grape contamination by OTA than in tropical climate regions such as Brazil (Lasram et al., 2010). Similar results were found here, once was considered that wines from Brazil are poor source of OTA when compared to wines from other Mercosul countries (Argentina and Chile), and other traditional producing countries of wine (União Brasileira de Vitivinicultura, 2012). Wine analyzed in Brazil showed frequency of contamination by OTA around 31%, while in European countries, such as Spain, the contamination may reach 99% (Welke et al., 2009).Samples which showed some level of contamination by OTA were red wines. This finding was expected according to data from other studies. For example, Lasram et al. (2007) assessed the presence of toxin in wines from Europe, and they showed a positive tendency towards contamination of this kind of wine. The highest content of OTA in red wine is probably found due to the characteristics of the winemaking process, where the maceration of grapes contributes significantly to the increase of levels of OTA in this type of wine (Fernandes et al., 2003). During the winemaking process of white wine, after grape maceration, the solid part is separated from the new wine, allowing less contact with peel and seeds. For red and rosé wines, the solid parts are fermented with new wine to potentiate the extraction of color and aroma. During this phase a greater extraction of OTA from grapes occurs, hinting that peel is probably the most contaminated part of the fruit (Lasram et al., 2008).No sample of white and rosé wine showed OTA contamination. This may be related to various factors such as type of grape, winemaking process, geographical region, climate conditions, and different practices performed during the cropping process of grapes; which influence the incidence of ochratoxigenic fungi and production of toxin.Great part of samples showed contamination by OTA. However, the majority showed values less than 2µg.L-1, the maximum limit acceptable established by the law. Terra et al. (2012) performed a study in San Francisco, Northeast Brazil, and they reported the presence of OTA in 75% of wines. However, the contamination level was considered low.Regarding the exposure risk to OTA due to wine intake, even for values that exceeded the limit (2µg.L-1), the exposure risk is low, both for human exposure and for aggregate exposure, since the consumption of this beverage in Brazil is still less than in other countries. However, when associated with the consumption of other food and beverages, which may contain significant levels of this toxin, its presence becomes relevant. Some authors found levels of OTA in red wines from Brazil from 0.10 to 1.33µg.L-1. According to them, although the results showed values below the limit, a less but continuous exposure to this mycotoxin may pose risk to human health (Shundo et al., 2006).
5. Conclusions
- Although the low incidence of OTA in these wines it is necessary to consider the possible exposure to this toxin through the consumption of other products, thus creating a significant risk when contaminated wines are often ingested. Therefore, other studies addressing the OTA exposure due to wines intake are necessary. These would allow better comprehension of facts that significantly contribute to the incidence and occurrence of this toxin in the beverage. In addition, they would contribute to minimize the potential risk of presence of this toxin, which would facilitate the maintenance of low levels of contamination, as showed in this study.