-
Paper Information
- Paper Submission
-
Journal Information
- About This Journal
- Editorial Board
- Current Issue
- Archive
- Author Guidelines
- Contact Us
Food and Public Health
p-ISSN: 2162-9412 e-ISSN: 2162-8440
2016; 6(4): 99-106
doi:10.5923/j.fph.20160604.03

Lipids Components of Industrialized Food for Nutritional Labelling
 Abstract
 Reference
 Full-Text PDF
 Full-text HTML
Sabria Aued-Pimentel1, Mahyara Markievicz Mancio Kus-Yamashita1, Simone Alves da Silva2, Odair Zenebon3
1Núcleo de Química, Física e Sensorial – Centro de Alimentos - Instituto Adolfo Lutz, São Paulo, Brasil
2Núcleo de Contaminantes Orgânicos – Centro de Contaminantes - Instituto Adolfo Lutz, São Paulo, Brasil
3Instituto Adolfo Lutz, São Paulo, Brasil
Correspondence to: Mahyara Markievicz Mancio Kus-Yamashita, Núcleo de Química, Física e Sensorial – Centro de Alimentos - Instituto Adolfo Lutz, São Paulo, Brasil.
| Email: |  |
Copyright © 2016 Scientific & Academic Publishing. All Rights Reserved.
This work is licensed under the Creative Commons Attribution International License (CC BY).
http://creativecommons.org/licenses/by/4.0/

Legal dispositions regarding nutritional facts on food products are been considered. Definitions of lipid contents in the nutrition facts have not been standardised. This paper has the objective to give analytical subsides to evaluate the different lipid classes contents for nutritional label, comparing procedures: modified AOAC 996.06 method with conventional gravimetric methods. The lipid classes contents were evaluated in industrialized foods in Brazil. Total fat diverged for about 42% of samples, Fatty acid contents were similar for both methods. The modified AOAC method was faster than conventional and used a lesser quantity of toxic solvents. However the results reinforce that lipid classes contents are analytical method dependent.
Keywords: Lipid class, Quantification, Nutritional labelling
Cite this paper: Sabria Aued-Pimentel, Mahyara Markievicz Mancio Kus-Yamashita, Simone Alves da Silva, Odair Zenebon, Lipids Components of Industrialized Food for Nutritional Labelling, Food and Public Health, Vol. 6 No. 4, 2016, pp. 99-106. doi: 10.5923/j.fph.20160604.03.
Article Outline
1. Introduction
- Nowadays the contents of total fat (TF) and fatty acids (FA) in industrialized foods, with bad effects (such as trans fatty acids) or good effects on health (n-3 and n-6 fatty acids), and the analytical procedures to determine these compounds have received special attention all over the world [1, 2, 3]. Excessive consumption of saturated fatty acids, mainly palmitic and lauric acids and trans fatty acids have been consistently correlated with chronic diseases, and the beneficial effects of polyunsaturated fatty acids have received increasing interest [4, 5]. Nutritional labelling information is one of the strategies of the World Health Organisation to help consumers choose healthy food and prevent chronic diseases [6]. Since cardiovascular problems are a primary cause of death among several populations, many countries such as United States, Canada and Brazil have adopted the mandatory declaration of nutritional information on the label of packed foods [7]. Brazilian legislation demands the declaration of total fat, saturated (SFA) and trans (TFA) fatty acids, among other nutrients, on the label of foods [8]. To commit to such legislation, official laboratories must be able to verify, by means of analysis, the contents declared on labels. Approaches and legal dispositions regarding nutritional facts on food products packaging depend on the countries. Definitions about which lipid contents should figure on label have not been standardised yet, nor have analytical methods been consistently adopted, including those in Brazilian laboratories. For nutritional labelling proposes in Brazilian legislation, TF is defined as the set of substances of vegetable or animal origin, insoluble in water, and constituting both triacylglycerol (TAG) and small quantities of non-glycerides, mainly phospholipids [8]. A number of time-consuming gravimetric methods are available for TF analysis in a variety of food matrices in accordance with Brazilian legislation [9, 10]. However, these methods can give divergent results for the same food matrices [11]. On the other hand, according to American and Canadian laws [12], TF is defined as the sum of fatty acids that originate from the different classes of lipids (mono-, di-, triacylglycerols, phospholipids and sterol esters), expressed as TAG [12]. Saturated, along with mono-, poly-unsaturated and trans fatty acids, must be expressed as free fatty acids, according to the legislation cited above. Restriction in the definition of total fat by US nutritional labelling legislation has resulted in method standardisation and decreasing discrepancies in laboratories. Hydrolytic methods have been developed to extract TF and FA from food and then quantify the levels of fatty acids by GC/FID, including trans fatty acids [9, 13, 14]. TF determined from FA composition by GC/FID methods has been calculated through a mathematical formula, which condensate FA in glycerol molecule [15, 16, 17]. The gas chromatographic methods have been endorsed in order to determine TF and FA for nutritional label purposes by the official analytical expertise organisations such as Association of Official Analytical Chemists (AOAC) and American Oil Chemists’ Society [9, 17, 18].In order to give analytical subsides to evaluate the different lipid classes contents for nutritional label, the present work aimed to compare the modified gas chromatographic AOAC 996.06 method [11] with current conventional gravimetric analytical methods applied in Brazilian laboratories to determine total fat and fatty acids in commercial foodstuffs for nutritional labelling purposes.
2. Materials and Methods
2.1. Samples
- Twelve commercial industrialized food products were analysed: soy drink powder (A), ice cream (B), built meat smoked (C), chicken sausage (D), chocolate cake (E), chocolate-filled biscuit (F), cream cheese (G), chocolate biscuit (H), powdered chocolate dessert (I), salty corn snack (J) and salted biscuits (K and L). All samples were sent to the laboratory to establish by analysis the values for nutrition label facts. The samples were appropriated to this study due the wide range of lipid component contents (TF and FA), difference in consistency and type.
2.2. Reagents, Solvents and Standards
- Fat extraction and methyl ester preparation were carried out with reagents and solvents of analytical reagent grade, except n-hexane which was GC grade.A mixture of 37 standards of fatty acids methyl esters (FAME) was used, from 4 to 24 carbon atoms, with certificated quantities of each compound (Supelco Inc. Bellefonte, PA, USA); mixture of cis/trans FAME isomers of 18:2 and 18:3 (Sigma Chemical Co, St. Louis, MO, USA); individual FAME standards purchased from Sigma (about 99% purity): elaidic (18:1 9t), trans vacenic (18:1 11t), 18:1 7c, 18:1 12c, conjugated linoleic acid (CLA) (18:2 9c11t and 18:2 10t12c). FAME and TAG 11:0 and 13:0 internal standards (IS) were purchased from Sigma. The FAME solutions were prepared in n-hexane with a concentration of about 2.5 mg mL-1 and the TAG solutions had a concentration of about 5 mg mL-1.
2.3. Total fat Gravimetric Determination (Laboratory Conventional Method - CM)
- The meat and poultry products, chocolate cake, chocolate-filled biscuit, chocolate biscuit, salty corn snack and salty biscuit were ground before oil extraction. All food samples were homogenised and submitted a conventional gravimetric method to determine total fat. The fat contents were employed to calculate fatty acid quantities. Gravimetric methods for total fat followed the Métodos Físico-Químicos para Análise de Alimentos do Instituto Adolfo Lutz [10] and AOAC methods [9] – Figure 1.
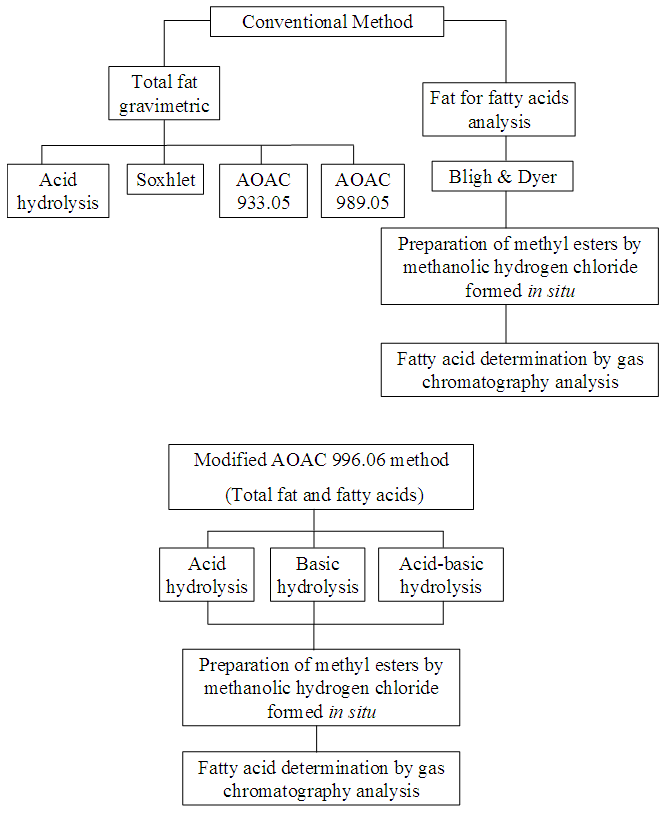 | Figure 1. Fluxogram of conventional and AOAC 996 methods |
2.4. Total fat from Fatty Acid Composition – Modified AOAC 996.06 Method
- The total fat contents in foodstuffs were also calculated from the fatty acid composition by the AOAC method 996.06 [9], with some modifications [19, 20]. Previous acid hydrolysis was indicated for all industrialized foods studied, except for ice cream (previous basic hydrolysis) and cream cheese (previous acid-basic hydrolysis) [9, 20]. The amount of samples, containing between 100 to 200 mg of fat, were weighed into 100 mL corked centrifuge tubes. Two millilitres of the TAG 11:0 and 13:0 solutions (IS) were added as well as 2 mL of 95% ethanol. Samples A, C, D, E, F, H, I, J, K and L were hydrolysed acid with 8.3 mol L-1 HCl (10 mL) in heated water bath (70 to 80°C) for 40 min. Ethanol 95% (10 mL) was then added. The sample of ice cream (G) was hydrolyzed with NH4OH 58% and the sample of cream cheese (B) with NH4OH 58% and HCl 12 N [9, 20]. The tubes were vortex mixed and cooled in a water bath to room temperature. The contents of the tubes were transferred to a separator funnel and the fat was extracted with three aliquots of diethyl ether/petroleum ether (1:1 vol/vol). The solvent was filtered and dried with nitrogen. The extracted fat was methylated and analysed by GC/FID. TF was calculated as the sum of individual FA expressed as equivalent TAG. This procedure involved modifications proposed in a previous study [10], such as the apparatus simplification and substitution of the toxic and expensive boron trifluoride (BF3) methanolic methylation reagent by the Hartman and Lago (1973) [20] procedure in which methanolic hydrogen chloride is formed in situ from non-toxic and inexpensive reagents [11].Total fat was calculated as the sum of individual fatty acid expressed as equivalent TAG [11].
2.5. Preparation of Methyl Esters by Methanolic Hydrogen Chloride Formed in situ
- The fatty acid composition of commercial samples by CM was evaluated in the residue obtained by the Bligh and Dyer (1959) [22] extraction method. Samples were homogenised with a mixture of chloroform/methanol/water (1:2:0.8 vol/vol) for 2 min followed by a 2:2:1.8 (vol/vol) chloroform/methanol/water mixture for 5 min. The chloroform layer was separated. This procedure was performed to extract fatty acids, in a cold extraction mode, aiming at not altering the original fatty acid composition of the food.The fat extracted from the CM method (Bligh & Dyer) [22] and from the modified AOAC 996.06 method [9] was methylated by the Hartman and Lago (1973) procedure [21] and analysed by GC/FID. Fat (up to 200 mg) was weighed (CM) or transferred (modified AOAC method) with 2 mL of n-hexane to a 50 mL corked centrifuge tube. A 2.0 mL of IS solution was added in the case of the CM (FAMEs 11:0 and 13:0). The esterification method consisted of saponification of the samples with 8 mL of 0.5 mol L-1 NaOH methanolic solution and boiling (3-5 min). To the cold solution, 10 mL of the esterification reagent was added (10 g of NH4Cl, 300 mL of methanol and 15 mL of H2SO4) and heated to boiling (3-5 min). To the cold solution, 3 mL of n-hexane and a saturated NaCl solution were added. The upper phase, which contained the FAMEs, was injected into the GC/FID.
2.6. Fatty Acid Determination by Gas Chromatography Analysis
- One microlitre of the FAME mixture was analysed in a gas chromatograph with a flame ionisation detector (Shimadzu, model GC 17A), using a fused silica capillary column with a cyanopropyl polysiloxane stationary phase (SPTM-2560, 100 m x 0.25 mm id, 0.20 µm film thickness; Supelco Inc., Bellefonte, PA, USA). The chromatographic conditions were optimised, including for trans fatty acids, with a programmed column temperature: 45°C for 4 min; increase of 12°C min-1 to 175°C (held for 27 min); then an increase of 4°C min-1 to 215°C (held for 35 min). The injector and detector temperature was set to 250°C, the carrier gas was hydrogen and the column pressure was 175 kPa [23, 18]. The FAMES were identified by standard co-injection and relative retention time to FAME 13:0 (IS) and quantified against this IS (g/100 g of sample) [9, 10].The figure 1 shows the steps of the conventional and AOAC 996 method.
2.7. Statistical Analyses
- The precision of the methods was evaluated by relative standard deviation (% RSD) (three repetitions). Student’s t- test was employed (5% significance) to check variations between the procedures [24].
3. Results and Discussion
- The results obtained for TF, SFA, TFA, monounsaturated (MUFA) and polyunsaturated (PUFA), with the means, standard deviations (SD) and relative standard deviations (% RSD), for three repetitions, are shown in Tables 1 and 2.
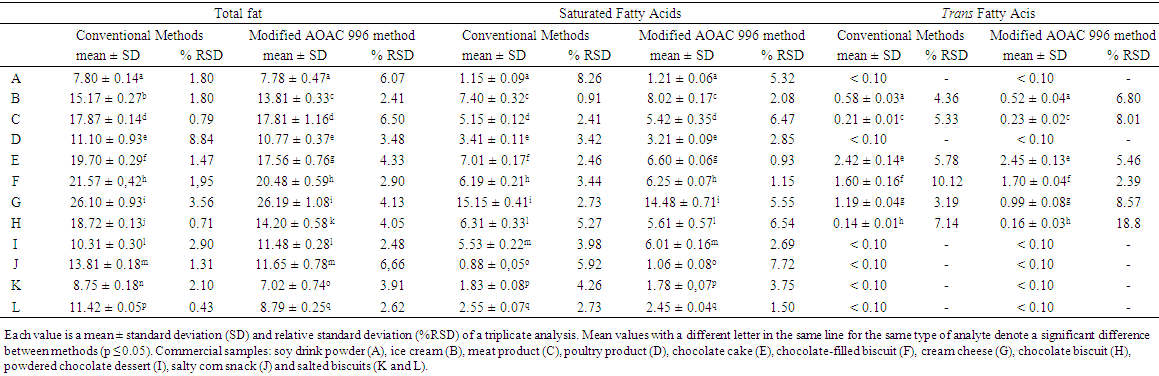 | Table 1. Total fat, saturated and trans fatty acids results from the modified GC/FID AOAC 996 and conventional laboratory methods in commercial samples, expressed in  |
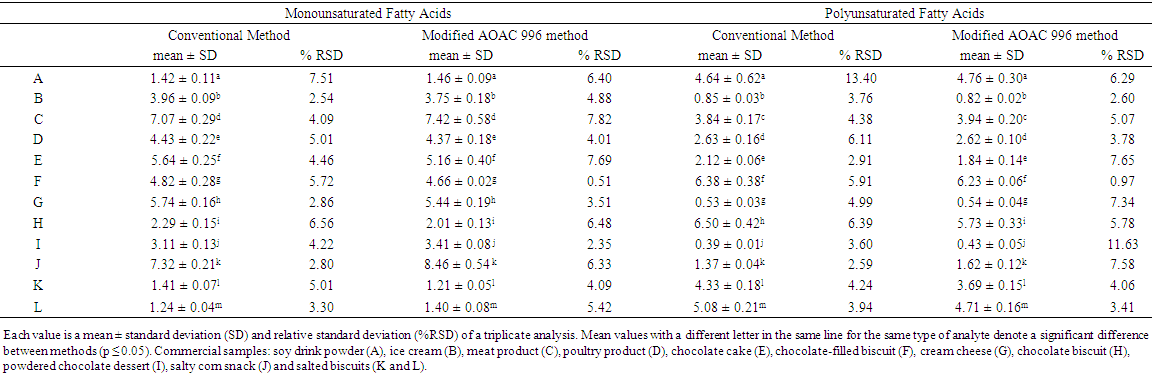 | Table 2. Monounsaturated and polyunsaturated fatty acids results from the modified GC/FID AOAC 996 and conventional laboratory (CM) methods in commercial samples, expressed in  |
3.1. Total Fat Determination in Foodstuffs
- The analysed samples were industrialized foods, of different type, consistency and fat content. The values of total fat as triacylglycerol by the modified AOAC 996.06 method agreed with part of the values determined by the CM method (Table 1). However, sample B (ice cream) and the bakery products, such as the chocolate biscuit (sample H), chocolate cake (sample E) and salted biscuits (samples K and L) presented total fat contents significantly different between the two methods (p ≤ 0.05). The salted biscuits showed total fat contents by the modified AOAC 996 method about 20% lower than with the CM. Gravimetric procedures with a previous acid or basic hydrolysis can overestimate total fat contents, because extract fat and probably other non-fat compounds such as glycerol, low molecular weight carbohydrates and novel compounds of industrialized foods such as additives, technology coadjutants and others [9, 25]. By the other side, it should be noted that the calculation of total fat by the AOAC method 996.06 is made from the condensed fatty acids in the molecule of glycerol and determined mathematically. The discrepancies observed in experimental results were in agreement with other studies [3, 11, 15, 26].On the other hand, the gravimetric procedure to extract fat from sample G (cream cheese) gave a similar content of total fat by both methods (Table 1). Also, the precision of results was low and similar, although the content of fat in the analyzed sample was high (about 26%) (Table 1). Mixed hydrolysis (basic and acid) followed by a gravimetric or GC/FID determination has been indicated as the official method for the quantification of TF in cheese products [17].Total fat results (in triplicate) by the modified AOAC method gave % RSD lower than 5% for most samples (Table 1). The non-homogeneity of some products such as the built meat smoked (C) probably affected the method performance and the precision of results. The applicability of GC/FID AOAC hydrolytic methods for TF and FA, including trans, has been tested and confirmed by several food matrices with variable amounts of fat [12, 13, 15, 18, 25, 26, 27, 28, 29]. In the present study, the TF varied from about 7.8 to 26.2% and results by conventional gravimetric (CM) and GC/FID methods agreed in about 58% of analyzed sample.
3.2. Fatty Acid Determination
- Tables 1 and 2 show the values for all fatty acids obtained by both methods. Concerning SFA, only chocolate cake (E) showed a significant difference between the methods. Regarding the GC/FID method, samples C and J showed dispersion values higher than 5%, probably due the low contents in sample J (around 1%) and the non-homogeneity and the presence of novel ingredients in the built meat smoked (C).Considering the trans fatty acid content in samples C, D, H, I, J, K and L, these were considered trans free. Brazilian nutritional labelling legislation [8] established a maximum level of 0.20 g per serving for trans-free products. According to the Brazilian legislation RDC 359/03 ANVISA/MS [31], which established the serving size for different food products, the contents of TFA were significant for samples E and F, and the quantity of TFA should be given per serving on the nutritional label of the product. The trans fatty acids observed in samples E and F were characteristic of partially hydrogenated vegetable fat (PHVF). A number of 18:1 trans isomers were present, so both content and variety of TFA were high (Figure 2B).The non-homogeneity of sample F (chocolate-filled biscuit) probably affected the TFA quantification performance, mainly when the CM method was employed. The % RSD values were about 10% for TFA. Samples D, I, J, K and L presented contents of trans fatty acids lower than 0.10 g.100-1 g of sample (the limit of quantification). In these samples, the % RSD values observed with triplicate analysis of trans fatty acids were greater than 20%. The reduced contents of TFA observed in the greater part of the samples, especially in bakery products, indicate that Brazilian food industries are in agreement with the recommendations of the World Health Organisation to reduce the trans contents of foods as much as possible.The modified AOAC 996.06 method showed satisfactory precision for TF and FA, including trans. In most cases, % RSD was below to 5% for contents above 1%, as shown in Table 1. The dispersions of TFA values were high, especially for contents below 1%.MUFA and PUFA are more unstable molecules than saturated fatty acids. Treatments such as the hydrolytic conditions employed in AOAC 996.06 could affect some reactive sites of the samples, such as PUFA. This feature can explain the values of % RSD greater than those obtained for SFA with both methods (Tables 1 and 2). The PUFA contents in samples E (cake), H, K and L (biscuits), determined by CM, were higher than those from the modified AOAC 996.06 method, although there was no statistically significant difference (5% confidence). The more mild extraction conditions in CM and the combination of extraction solvents (chloroform/methanol) were probably more efficient in extracting those molecules and not degrading them. [2, 3]. (Figure 2A)
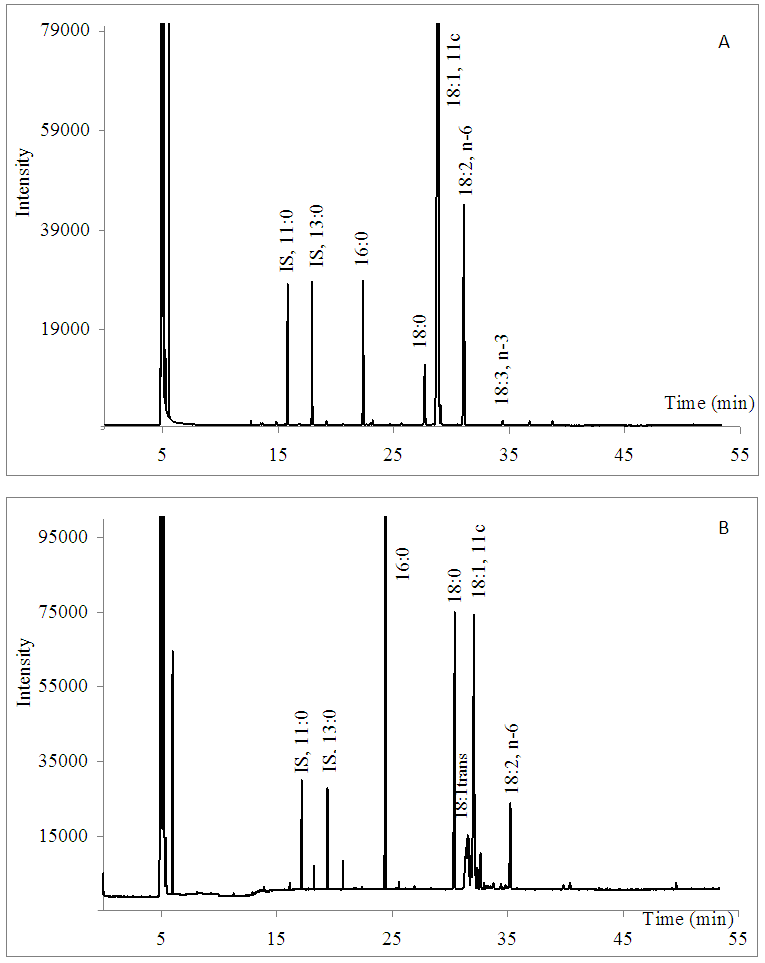 | Figure 2. Cromatogram of samples. 2A. Salted biscuits (sample K) and 2B. Chocolate cake (sample E) |
4. Conclusions
- Total fat in commercial samples obtained by the CM and the modified AOAC 996.06 method diverged (p>0.05) in about 42% of samples, mainly in bakery products in which the contents were lower by the last method. Fatty acid contents were similar for most samples by both methods.The dispersion of replicates (% RSD) was lower than 5% for a great part of the samples and fat classes, in both methods.Method AOAC 996.06 was modified by apparatus simplification and substitution of toxic borum trifluoride reagent by hydrogen chloride formed in situ. The modified AOAC method was faster than the conventional method tested and used a lesser quantity of reagents and solvents.The implantation of the modified AOAC method in Brazilian laboratories would be more advantageous, in view of the performance characteristics of the method, the lower cost and run time plus security for the analyst. However it is necessary to modify the Brazilian legislation regarding the definition of total fat for nutrition labelling purposes.Although the results in the present study confirm the applicability of the modified AOAC method for industrialized food samples, the contents of different lipid components depend on the analytical method employed. The results reinforce the necessity of method and nutritional label legislation standardization to meet the consumer right to obtain correct and consistent information about the nutrients declared on food labels.
ACKNOWLEDGMENTS
- The authors are grateful to Fundação de Amparo à Pesquisa do Estado de São Paulo (FAPESP) for the financial support.