-
Paper Information
- Paper Submission
-
Journal Information
- About This Journal
- Editorial Board
- Current Issue
- Archive
- Author Guidelines
- Contact Us
Food and Public Health
p-ISSN: 2162-9412 e-ISSN: 2162-8440
2015; 5(6): 207-212
doi:10.5923/j.fph.20150506.01

Investigating Quality Characteristics of Drinking Water in Hail Area, Kingdom of Saudi Arabia
 Abstract
 Reference
 Full-Text PDF
 Full-text HTML
Abdel Moneim E. Sulieman, Abdalla S. Al-Shammary, Abdel Muhsin A. Abdel Muhsin, Vajid N. Veeteel
Department of Biology, Faculty of Science, University of Hail, Hail, Kingdom of Saudi Arabia
Correspondence to: Abdel Moneim E. Sulieman, Department of Biology, Faculty of Science, University of Hail, Hail, Kingdom of Saudi Arabia.
| Email: |  |
Copyright © 2015 Scientific & Academic Publishing. All Rights Reserved.
This work is licensed under the Creative Commons Attribution International License (CC BY).
http://creativecommons.org/licenses/by/4.0/

The aim of the present study was to analyze microbiologically and chemically drinking water samples which were monthly for six months from various sites in Hail area. Analytical results were compared with local and International Standards. Ten sites on water bodies that are used by the residents of Hail for various domestic purposes were chosen. Various physical, chemical and microbiological parameters were analyzed by using standard water quality measurements. The results indicate that the highest temperature was recorded in the month of June when the temperature was above 29°C. The pH was high during dry season especially in the month of June. The conductivity and turbidity were highest during the months of February and March at sites 1 and 3, respectively. All samples gave acceptable results contents of sodium, phosphate and chloride salts contents as well as total dissolved solids which ranged between 117-130 mg/L. The microbiological analysis showed that most of the tested samples were fit for consumption; however, fecal coliform levels were alarmingly high in 40% of tested water samples.
Keywords: Quality, Phosphate, Conductivity, Turbidity, Coliforms
Cite this paper: Abdel Moneim E. Sulieman, Abdalla S. Al-Shammary, Abdel Muhsin A. Abdel Muhsin, Vajid N. Veeteel, Investigating Quality Characteristics of Drinking Water in Hail Area, Kingdom of Saudi Arabia, Food and Public Health, Vol. 5 No. 6, 2015, pp. 207-212. doi: 10.5923/j.fph.20150506.01.
Article Outline
1. Introduction
- While the safe quality of water supplied to communities is an important consideration in the protection of human health and well-being, it is not the only factor that affects consumers. Access to water is of paramount concern and other factors, such as the population served, the reliability of the supply and the cost to the consumer, must therefore be taken into account [1].Safe drinking water especially in rural communities in developing countries is of prime importance, because unsafe water is related to morbidity and mortality (WHO. 2008). However, globally, unsafe drinking water coupled with poor sanitation kill at least 1.6 million children under the age of five every year, 84% of them living in rural areas. If this situation persists, about 1.7 billion rural dwellers will not have access to safe water and improved sanitation by 2015 [2].Access to water may be restricted in several ways, e.g. by prohibitive charges, daily or seasonal fluctuations in availability or lack of supplies to remote areas, and many countries face problems of this sort. In some parts of the world where water is scarce and has to be transported over long distances by road or on foot, the cost of drinking-water may absorb a significant proportion of the average daily income. The world Health Organization [3] defined safe drinking water as that water having acceptable quality in terms of its physical, chemical and bacteriological parameters. Bacteriological parameters especially Escherichia coli (E.coli) and total coliform have been used to determine the general quality of drinking water in the world [3-5]. The E. coli particularly, has been found to be the most specific indicator of faecal contamination in drinking-water [5]. Its presence indicates contamination of water with faecal waste that may contain other harmful or disease causing organisms, including bacteria, viruses, or parasites [6]. Water quality monitoring is the foundation on which water quality management is based [7]. Monitoring provides the information that permits rational decisions to be made on the following:• Describing water resources and identifying actual and emerging problems of water pollution.• Formulating plans and setting priorities for water quality management.• Developing and implementing water quality management programmes.• Evaluating the effectiveness of management actions.In Saudi Arabia, the quality of drinking water is currently receiving some attention from environmentalist and water scientists [8-10]).The general objectives of this work were to carry out a set of physical, chemical, biochemical and microbiological analyses in order to match the national and international standards for drinking water in Hail area, however, these parameters will indicate quality and safety of drinking water for human consumption.
2. Materials and Methods
2.1. The Study Area
- Ha'il is largely agricultural, with significant grain, date, and fruit production. A large percentage of the kingdom's wheat production comes from Ha'il Province, where the area to the northeast, 60 to 100 km (37 to 62 miles) away, consists of irrigated gardens. Historically Ha'il derived its wealth from being on the camel caravan route of the Hajj. Ha'il is well known by the generosity of its people in Saudi Arabia and the Arab world as it is the place where Hatim al-Tai lived. It is also is the homeland of the Al Rashid family.Hail city is located in the middle of the northern region of the Arabian Peninsula, between 25°-29° N and 38°-42° and has an average elevation of 900-1350m above sea level. It is one of the major cities in the Kingdom of Saudi Arabia and considered as the fifth city in regard to its area. The local geology is dominated by the Arabian shield rock extending to steep wadies and hills. It is characterized by its limestone sand, which exists in the form of sand sheets and sand dunes.The weather system in Hail city is generally arid to extra arid. The wind in the study area comes from the north or northwest and is a great evaporative force hence causing immense physical damage. At certain times of the year, especially during spring, the wind builds up 4-5 days severe dust storms known as 'Shamals' in which air is full of grit (sand+silt) to a height of hundreds of meters. The rainfall is erratic and irregular. The main source of precipitation comes from the winter cyclones originating from the Mediterranean Sea and the eastern Atlantic Ocean. The most dry months are September till mid-October [11].
2.2. Collection of Water Samples
- Water samples were collected (monthly) from ten different sites in Hail, these sources included: various water treatment stations, municipal water, public coolers and bottled water from various supermarkets. Prior to sampling, water was allowed to run for several minutes and the water outlet was flamed to avoid external contamination. Water samples for chemical analysis were collected in polyethylene bottles whereas samples for bacteriological analysis were collected in 250 ml sterile glass bottles in the morning hours, and the samples were transported in cool boxes to the Microbiology laboratory of the Department of Biology, Faculty of Science, Hail University for further microbial analysis. The water samples were kept at 4°C and then transported to the laboratory pending analysis. On-site water testing was carried out to determine physical characteristics of collected water samples.
2.3. Physical Analysis of Water Samples
- At each collection site in Hail area and during each round of sample collection, some physical parameters were estimated by using the DR/850 colorimeter and YSI 599 Replaceable Module kit, respectively. The parameters measured included: Temperature (°C), Dissolved Oxygen (mg/L), pH, conductivity (ms/cm) and Turbidity (FTU).
2.4. Chemical Analysis of Water Samples
- The total dissolved solids (TDS) value was determined in the laboratory by filtering 50 ml of the sample using filtration apparatus. An empty dish was put in the drying oven at 180°C for one hour, and weighed using the analytical balance. The filtrated sample was put in the evaporated dish and incubated in a water bath until it dried. The dish containing the sample, was then put in the oven at 180°C for one hour and weighed.Calculation:Total dissolved solids mgl-1 = (A - B)*106/ sample volume in ml. (1)where:A= Weight of dish + dried residue (g).B= Weight of dish before use (g).The minerals and minerals salts contents in the different water samples were determined according to the AOAC [12]. The minerals and present in the ash as metallic oxides were converted to chlorides by HCl and diluted. Flame Atomic Absorption Spectrophotometer (FAAS) with a variant spectrometer (SPECTR AA-10) was used to determine the levels of calcium, sodium, chloride, sulfate and flouride, Nitrate (mg/L), Phosphate (mg/L) and Total Chlorine (mg/L).
2.5. Microbiological Analysis
2.5.1. Colony Count
- Total viable count was carried out using the pour plate technique as described by Harrigan and MacCance [13]. Ten ml of each sample were transferred to 90 ml of sterile Ringer’s solutiont, as a first dilution 101, serial dilutions were made up to 106 and 1ml of each dilution was transferred aseptically in duplicate into sterile Petri-dishes. 10- 15 ml of melted plate count agar were poured into the dishes. The dishes were then thoroughly mixed to facilitate distribution of the sample throughout the medium, the medium was allowed to solidify and plates were incubated at 370°C for 48 hours. Colony counter (Labtech) and hand-tally were used for the determination of the total bacterial counts in terms of colony forming units per ml (c.f.u./ml).
2.5.2. Determination of Total Coliform
- The most probable number (MPN) test was carried out according to APHA [14]). The multiple tube fermentation technique was performed as a presumptive test for total coliform using tubes containing MaCconkey Broth and inverted Durham tubes. Inoculation was carried out as follows:(i) To each of 3 double-strength MacConkey broth tubes, 10 ml of the original sample was added.(ii) To each of 3 single-strength MacConkey broth tubes, 1ml of the original sample was added.(iii) To each of 3 single-strength MacConkey broth tubes, 0.1ml of the original sample was added.All tubes were incubated at 370C for 48 hours for the observation of gas production. First reading was taken after 24 hours to record positive tubes, and the negative ones were incubated for another 24 hours.The confirmed test was determined by inoculating each gas positive presumptive tube into a tube containing 10 ml Brilliant green lactose broth medium. All tubes were incubated at 370C for 48 hours for the observation of gas production.The completed test (Fecal coliform test) was determined by sub-culturing at least 3 loopful of each confirmed positive tube into Escrichia coli(EC) broth medium which then incubated at 44.5°C for 24 hours. Tubes showing any amount of gas production were considered as positive and the most probable number was recorded (the results were compared with the most probable number table).
2.5.3. Yeast and Moulds Count
- Using pour plate method, potato dextrose agar was used for detection of yeast /moulds, using the serial dilutions from each sample. To increase the media acidity, 10% of tartaric acid was added during the pouring of the media in the plates. 0.1 ml from each dilution was taken; incubation was carried out at 280C for 72 hours.
2.5.4. Detection of Salmonella
- Selenite broth was used for the detection of Salmonella spp. According to APHA [14], by taking 10ml from the original sample and added it to flask containing 100ml of sterile nutrient broth, incubated for 24 hours at 370C, after incubation 1ml was taken and added to tubes containing selenite broth, incubation was carried out for 24 hours at 370C using streak plate method, and using bismuth sulphite agar and incubation for 72 hours at 370C. Observation of black colonies was an indication of Salmonella presence.
3. Results and Discussion
3.1. Physical Characteristics of Water Samples Collected from Various Sites
- The results of mean of the physical characteristics of water collected from various sites are presented in Tables (1-4). The temperature remained between 20 and 30°C during the study period. The highest temperature was recorded in the month of June when the temperature was above 29°C (Table 1).
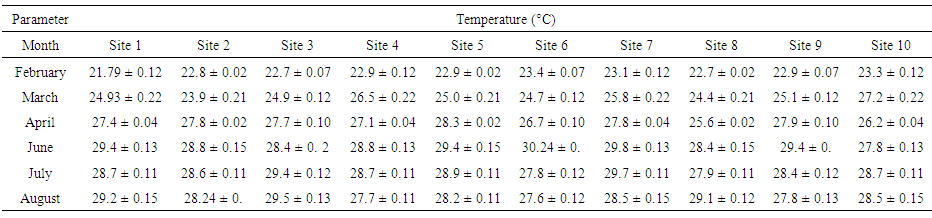 | Table (1). Temperature values (°C) of water samples collected from various sites |
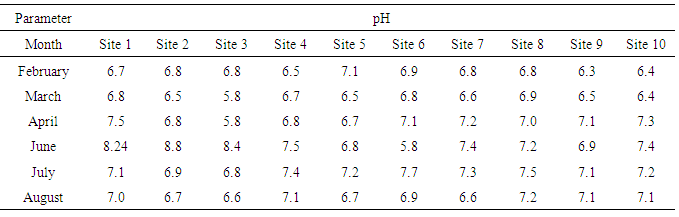 | Table (2). pH values of water samples collected from various sites |
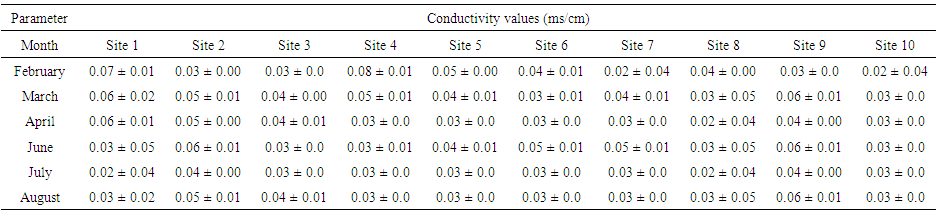 | Table (3). Conductivity values (ms/cm) of water samples collected from various sites |
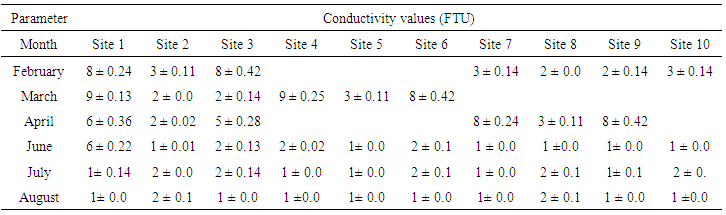 | Table (4). Turbidity values (FTU) of water samples collected from various sites |
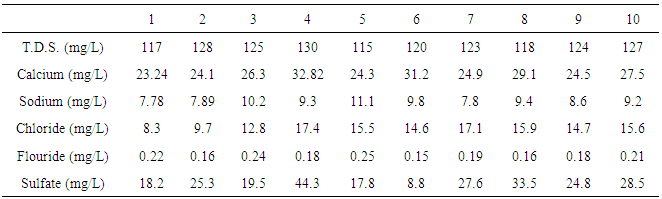 | Table (5). Chemical characteristics of water samples collected from various sites |
3.2. Microbiological Characteristics of Water Samples Collected from Various Sites
- Table (6) shows results of the microbiological analysis of water samples collected from various sites. The bacteriological analyses of water samples using the presumptive test indicated that four sites of tested water samples revealed the presence of coliform, showing that 40% of them failed to meet the guidelines set by SASO, G.C.C.S, WHO and USEPA which means the samples were unfit for drinking. In addition, E.coli was also detected in these samples. According to the International Standards [1] for drinking water, E.coli or thermo tolerant coliform bacteria and pathogenic intestinal protozoa must not be detectable in any 100 ml sample intended for drinking, and also for the treated water in the distribution system. Presence of Coliform bacteria in treated water indicates that water treatment system was not operated satisfactorily, or that water became contaminated within the distribution system. This is expected since these water samples do not receive any chlorination treatment before consumption in urban areas.
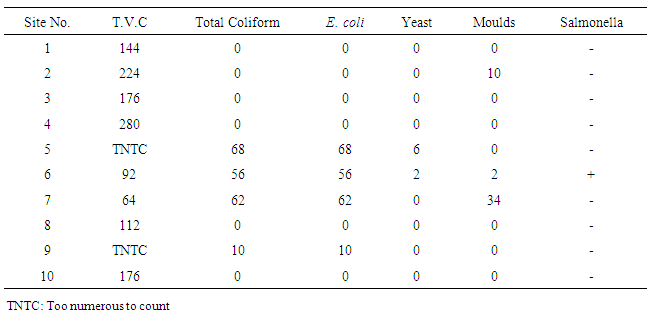 | Table (6). Microbiological characteristics of water samples collected from various sites |
4. Conclusions
- This study aimed to investigate the quality of drinking water consumed by majority of people residing in Hail area, Kingdom of Saudi Arabia. The obtained results emphasize the importance of adopting appropriate routinely monitoring system in order to prevent or to diminish the chances of contamination of this water source.In this study, the microbiological quality of the drinking water was satisfactory for the chemical indicators of organic contamination in most of the samples, probably because the values of microbial counts were not high enough to modify them. It is important to ensure periodic cleaning of water tanks to prevent potential water pollution and reducing the proportion of dissolved solids and salts in the water. Water circulating in the distribution system whether treated or not, should not contain any organisms which may be of fecal origin, if coliform organisms are found, further investigation is required to determine their source. Frequent examinations are essential for hygienic control. A proper sanitary survey and implementation of water and sanitation projects in the community are recommended.
ACKNOWLEDGEMENTS
- The authors express their sincere thanks to the University of Hail, Kingdom of Saudi Arabia for financing this study.