-
Paper Information
- Paper Submission
-
Journal Information
- About This Journal
- Editorial Board
- Current Issue
- Archive
- Author Guidelines
- Contact Us
Food and Public Health
p-ISSN: 2162-9412 e-ISSN: 2162-8440
2015; 5(5): 151-156
doi:10.5923/j.fph.20150505.01
Getting the Message: Framing Nutrition Labels to Increase Consumer Elaboration Likelihood
 Abstract
 Reference
 Full-Text PDF
 Full-text HTML
Gregory Clare1, Katie Burghardt2
1Design, Housing and Merchandising, Oklahoma State University, Stillwater, OK, USA
2Human Nutritional Sciences, Oklahoma State University, Stillwater, OK, USA
Correspondence to: Gregory Clare, Design, Housing and Merchandising, Oklahoma State University, Stillwater, OK, USA.
| Email: |  |
Copyright © 2015 Scientific & Academic Publishing. All Rights Reserved.
An online experiment measured perceived differences between nutrition label modifications of 946 participants divided into three groups (n=316 Control, n=308 Calories, and n=322 Percentage). One group of subjects reviewed a FDA mandated label as a control, another group a calorie label supplement, and the third group a percentage label supplement. Across the label exposure groups, significant differences were found for need for cognition on evaluation of potential outcomes. Health consciousness demonstrated a direct positive significant relationship to evaluation and focus on positive outcomes factors of the evaluation of potential outcomes scale. Interaction effects were observed between need for cognition and health consciousness between treatment groups, suggesting potential benefits from nutrition label summary supplements.
Keywords: Consumer Behaviour, Labelling, Packaging
Cite this paper: Gregory Clare, Katie Burghardt, Getting the Message: Framing Nutrition Labels to Increase Consumer Elaboration Likelihood, Food and Public Health, Vol. 5 No. 5, 2015, pp. 151-156. doi: 10.5923/j.fph.20150505.01.
Article Outline
1. Introduction
- Food labels provide standardized information to inform consumers about the nutritional components of different foods [1] Levy and Fein [2] proposed that nutrition labels offer consumers the potential to compare food products and make better decisions about the healthiness and nutritional value of their food choices. Calories, calories from fat, total fat, saturated fat, cholesterol, sodium, carbohydrate, dietary fiber, sugars, protein, vitamin A and C, calcium, and iron have to be present on the Nutrition facts label [3]. Despite a dramatic increase in the availability of nutrition information made available to consumers through many communication channels obesity and chronic diseases are on the rise [4]. This research study explores label supplements designed to highlight key information on nutrition labels and how this information informs consumer evaluation of food labels. A study conducted by Post et al. [5] revealed that when an individual with a chronic disease is directed by a health professional to read the label the probability is only 50% that they will do so, and this fact suggests that improvements to nutrition label information and design may improve consumer responses to label information. Balasubramanian and Cole [6] demonstrated a linkage between motivation to act and nutritional knowledge of consumers suggesting that lower levels of nutrition knowledge and motivation are more likely to use label information to make healthy food choices.
2. Why do Consumers need to Understand the Nutrition Facts Panel?
- It is important for consumers to understand the Nutrition Facts Panel so that they can betternavigate through nutrition label information versus marketing slogans and tactics intended to get them to purchase food products. Of the 49% of products found to contain some sort of nutrition marketing by Colby et al. [7], 48% of the products were actually high in sodium, sugar, and/or fat. Understanding and knowing how to use the Nutrition Facts Panel can lead to improved health, less chronic diseases and a longer life. Jasti & Kovacs [8] demonstrated the correlation of consumers that read nutrition labels consuming less trans-fat, a leading contributor to many chronic diseases. People that use nutrition facts labels often have diets lower in fat and cholesterol, eat more fruits and vegetables, and have a higher level of nutrition understanding [9]. Therefore, a gap needs to be bridged between those who understand the information and those individuals who do not by understanding what consumer characteristics influence label use. Providing nutrition information in a simplified, comprehensive manner could increase the chance of consumers using nutrition facts as a tool, and therefore increase health and overall nutrition understanding. Due to time constraints many consumers may not take the time to read and interpret label information. Drichoutis et al. [10] found that consumers with more time for shopping have greater tendencies to read nutrition labels. Some aspects of the current nutrition label may prevent consumers from effectively understanding the information presented andeye tracking studies have demonstrated label design factors such as placement, perceived relevance of information order, noise, and size of the label may enhance label use [11]. Research has shown between 45 and 80% of adults have reported using nutrition facts [12]. Label use may be more common for people buying a product for the first time and when evaluating alternatives [13].
3. Improving the Nutrition Facts Panel
- The Elaboration Likelihood model [14] (ELM) is the theory chosen for this study to explore consumer understanding of nutrition labels and measure perceived differences between label designs. According to Barbara J. Wilson, “The ELM posits that variations in persuasive effects are a function of how people process information and the degree to which they engage in elaboration or issue-relevant thinking” [15]. This model has two groups into which individuals are categorized for their need for cognition. The first is the “central” route of thinking. This route requires a higher level of thinking and involvement, or high elaboration. Individuals are more likely to fall into this category when the topic being presented is relevant to them [15]. The second group includes those who think in a “peripheral” or low elaboration manner with less concern about the outcome of their food choices. These individuals tend to want things to be simple, or use some type of “cognitive shortcut” or heuristics to assess the information [15]. What the ELM tends to reveal is that when central processing occurs, individuals are more likely to maintain what they have learned over time, but if peripheral processing occurs, the habits or opinions of individuals are more likely to change in the future. Research Hypothesis: Between subject samples (control, calorie label modification, percentage label modification) there are differences in at least one pair of means in need for cognition and health consciousness score across the three classes on elaboration of potential outcomes.Null Hypothesis (H0): In the population from which the samples were drawn, there are no differences in mean elaboration of potential outcomes across the three subject samples (control, calories, percentage). Cacioppo and Petty [14] created the need for cognition scale to assess if a person has a tendency to enjoy the process of thinking and be engaged in it. The researchers suspect that a person’s need for cognition may influence label reading behaviors directly and positively. An individual who demonstrates greater elaborative thinking and infers potential outcomes of decisions may correlate to their reported need for cognition in general. Therefore, we will test the relationship of need for cognition to evaluation of potential outcomes to better understand this relationship.H1: Need for cognition demonstrates a direct positive relationship to evaluation of potential outcomes.The Health Consciousness Scale (HCS) created by Gould [16] measures a participant’s involvement in his or her own health. Presumably, people with greater health consciousness scores indicating awareness of their health status will be more likely to interpret label information and evaluate how the specific food item(s) will impact their health more readily. Persons that report lower health consciousness scores may not demonstrate a direct positive relationship to evaluation of potential outcomes. H2: Health consciousness demonstrates a direct positive relationship to evaluation of potential outcomes.Another scale used was the Elaboration of Potential Outcomes Scale (the EPO scale), created by Nenkov, Inman and Hulland [17]. This scale is a:“Generalized predisposition toward thinking about consequences, specifically, it captures the degree to which individuals: 1) generate potential consequences of their behaviors; 2) evaluate the likelihood and importance of these consequences; 3) encode anticipated end states, with a positive focus; 4) encode anticipated end states with a negative focus”, Bearden et al. [18].The scale is useful to the study because nutrition choices are often made based on how an individual considers the possible outcomes of consuming a particular food item. An individual may consider what happens if they choose foods high in fat or sugar (obesity, diabetes, heart disease), or they may consider what occurs when healthful choices are made (weight loss/maintenance, strong bones, low cholesterol, decreased cancer risk, etc.). The researchers were also interested to learn if positive thinkers (determined by the “Positive Outcome Focus Dimension”) responded differently to our intervention than negative thinkers (determined by the “Negative Outcome Focus Dimension”). The EPO scale is separated into three sub-scales based on factor loadings. The first six questions are considered the “Generation/Evaluation Dimension”. The second part is the “Positive Outcome Focus Dimension” and it consists of three questions. The last section is the “Negative Outcome Focus Dimension” and it contains four questions. The relationship of health consciousness scores is likely to vary in the component factors since the researchers believe that health consciousness is a positive behavior related to evaluation and the subject’s anticipation of favorable outcomes based on their attention to health details. On the other hand, low health consciousness may demonstrate a relationship to the subject’s tendency to expect that negative outcomes will or will not occur in an inverse relationship to subjects with a positive outcome focus and greater health consciousness. We also measured the influence of participant levels of need for cognition on the component factors of the EPO scale to determine if the subject’s reported tendency to evaluate outcomes and focus on positive or negative is related to nutrition label modifications.H3a: Health consciousness will demonstrate a direct positive relationship to the “evaluate” and “positive outcome” factors of the evaluation of potential outcomes scale. H3b: Health consciousness will demonstrate an inverse relationship to the “negative outcome” focus factor.H4a: Need for cognition will demonstrate a direct positive relationship to the “evaluate” and “positive outcome” factors.H4b: Need for cognition will demonstrate an inverse relationship to the negative outcome focus factor.
4. Methods
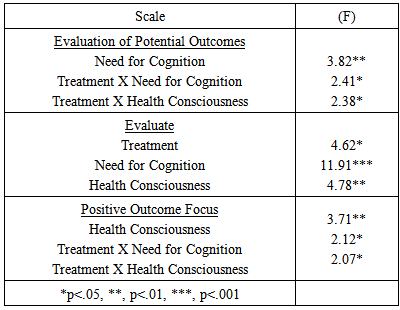
- Recent focus groups by the researchers revealed participants were concerned with calories, fat, sugars and protein in order of importance when reviewing nutrition labels, Clare & Burghardt [20]. Front of package labelling and novel label designs were of secondary importance to participants. Easy to understand labels with similar designs to the FDA label standards were preferred among focus group participants and justified an exploration of nutrition label variants using conventional FDA label design standards. The researchers felt it would be helpful to choose items without a large amount of servings in the container. Therefore, bottled beverages were an excellent choice, as smaller portions are easy to find, and a wide range of healthfulness was available. Two types of milk, two types of juice, and two types of bottled smoothie style drinks were chosen. The survey data was collected using Qualtrics and an Amazon Mechanical Turk panel, 951 participants started and 946 individuals completed the experiment and survey. The survey consisted of informed consent documentation, exposure to a product and label, and a posttest. Participants of the online only survey group were compensated with a $1.00 payment for each completed survey. Participants were exposed to one of three conditions. Each condition was chosen at random. The first condition was a control using the standard FDA label. The second condition consisted of the beverages with the nutrition facts label and a supplemental nutrition information panel with the caloric breakdown of the beverage, and the posttest. The second condition related to the ELM was believed to appeal to individuals of low elaboration, as it simplifies how one thinks about caloric breakdown of the drinks. The third condition contained the products with the nutrition facts label and a summary of macronutrient recommendations that shows what percent of each should be consumed on a daily basis based on age of the consumer (percentage label modification). The third condition relates to the ELM because the researchers believed it would likely appeal to individuals of high elaboration. Completing mental math to calculate the percentage of something consumed can take a considerable amount of time. Recommended macronutrient amounts were obtained from the Dietary Guidelines for Americans [21].To determine if an individual was of high or low elaboration, we used the elaboration of potential outcome scale measured 1-4 (strongly agree to strongly disagree). To test the hypothesized model, a one-way ANOVA and multiple comparisons test was utilized. The three experimental groups (control, calories, and percentages) were assigned randomly. Each participant reviewed five identical nutrition label designs for five different beverages with varied nutritional content before completing the post-test survey. The survey measured the theoretical constructs of elaboration likelihood though the use of the elaboration of potential outcomes scale, the health consciousness scale, and the need for cognition scale. The subject’s estimates of the elaboration likelihood for nutrition information stimuli were tested with a factorial ANOVA of three multi label groups (control, percentage, calories) by five (very low to very high) need for cognition ratings by five Health Consciousness (very low to very high). The three nutrition label group estimates were then compared to each of the three components of the elaboration of potential outcomes (evaluate, positive outcome, negative outcome) using a factorial ANOVA.
5. Findings
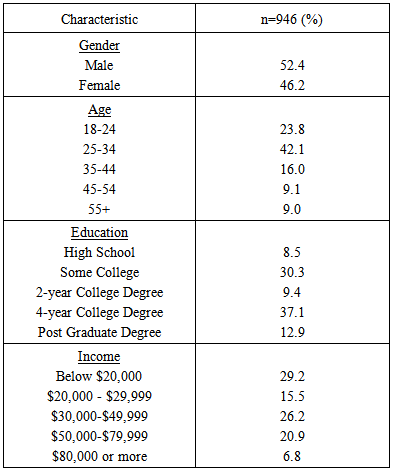
- A total of 946 participants completed the online experiment and survey: Control n=316, Calories n=308 and Percentage n=322. 52.4% of the participants were male and 46.2% were women. Additional characteristics of the sample may be found in Table 1.
|
|
6. Conclusions
- On February 27, 2014, the Food and Drug Administration prescribed updates to the Nutrition Facts label on packaged food items. These future labels will reflect serving sizes more accurately to the amount of food consumers tend to consume, and will focus on key areas including the serving sizes and calories. Calorie information will be presented in a larger font than current label mandates, Eisenman [22]. Overall, the fact that these study findings lend credence to the recommendations proposed by the FDA suggests that label changes are needed, and could possibly have a positive impact on the nutritional status of Americans by simplifying key label information design to emphasize cognitive processing methods.It appears behavioral makeup (negative thinker, positive thinker, and evaluator), degree of health consciousness and need for cognition of an individual could impact a person’s perception of labels. However, further research is needed to confirm this. Upon the completion of our analysis, we also observed that presenting nutrition label information by providing the percentage chart to individuals who prefer to evaluate potential outcomes, have a greater need for cognition and a higher health consciousness may be effective. More research is required to support this observation. A study conducted by Barone [23] concluded that the percent daily values would be of greater use to individuals who tend to evaluate a product in relation to their everyday diet. This finding is in line with this as those with a higher health consciousness; a greater need for cognition and an increased tendency to evaluate potential outcomes were more perceptive to the percentage chart created to compliment the %DVs on the Nutrition Facts panel. These findings also support the findings of Viswanathan & Hastak [24], who found that while %DVs might be helpful to consumers alone; the information could be enhanced if summary information was also provided. A study in which nutrition information was presented to participants in different formats (additional information panels, multiple columns, or verbal descriptors) revealed that participants did not perceive the additional information effectively because it was not similar to what the standard FDA label looked like. The study attempted to standardize label supplements by adopting a design consistent with standard FDA lalels [25]. Perhaps those with a higher need for cognition, high health consciousness, and those who evaluate potential outcomes responded well to the percentage chart because it elaborated on the %DV information already present on the Nutrition Facts panel combined with requirements by age of the consumer. It is also likely certain participants preferred the percentage chart because it followed the same format (font, font size, layout) as the standard FDA label.
7. Limitations and Further Research
- The participant population was split fairly evenly between male and female. However, many of the participants were between twenty-five and thirty four (42.1%), with the second greatest amount of participants being between twenty and twenty-four (21.7%). In both studies, the middle aged/older U.S. population was not well represented. The majority of participants had completed some college or obtained a four-year degree. This means those who have obtained a high school diploma/GED, have completed less than high school, or have obtained a Master’s degree or higher were not well represented. Most participants in the quantitative study made below $39,999 per year and below $20,000 per year. Therefore, individuals in the U.S. population who make $40,000 and over were not represented well. Lastly, as the online survey was a paid survey, it is possible that response bias, or the act of participants responding to questions in a manner they believe will please the questioner, could have occurred. The findings from this study offer potential for an ongoing research agenda for label design to influence desirable consumer behaviors related to nutrition choices. First, while it was found that the percentage chart appealed to high health conscious individuals who prefer to evaluate potential outcomes and have a greater need for cognition, further study is needed to learn what type of label would appeal to a wider range of people. Secondly, a large-scale study that more fully represents the entire U.S. population would allow us to see if the results relate to other groups of people.