-
Paper Information
- Previous Paper
- Paper Submission
-
Journal Information
- About This Journal
- Editorial Board
- Current Issue
- Archive
- Author Guidelines
- Contact Us
Food and Public Health
p-ISSN: 2162-9412 e-ISSN: 2162-8440
2015; 5(4): 127-137
doi:10.5923/j.fph.20150504.05
Thin Layer Chromatographic Analysis of Annatto Extracts Obtained Using Supercritical Fluid
 Abstract
 Reference
 Full-Text PDF
 Full-text HTML
Carolina L. C. Albuquerque1, Ádina L. Santana2, M. Angela A. Meireles2
1DTA (Food Technology Department)/CTDR (Technological and Regional Development Center)/UFPB (Federal University of Paraíba), Av. Escoteiros, S/N, João Pessoa-PB, Brazil
2LASEFI/DEA/FEA (School of Food Engineering), UNICAMP (University of Campinas), R. Monteiro Lobato, Campinas-SP, Brazil
Correspondence to: M. Angela A. Meireles, LASEFI/DEA/FEA (School of Food Engineering), UNICAMP (University of Campinas), R. Monteiro Lobato, Campinas-SP, Brazil.
| Email: |  |
Copyright © 2015 Scientific & Academic Publishing. All Rights Reserved.
The goal of this paper was to qualitatively identify the chemical composition of annatto extracts obtained by supercritical fluid extraction (SFE) using thin layer chromatography (TLC) in terms of volatile oil compounds, compounds with antioxidant activity and phenolic compounds. The mobile phase that achieved the best separation of the studied compounds of interest presented in the extracts was used. The γ-tocotrienol and δ- tocotrienol antioxidants as well as squalene and β-sitosterol were identified by comparison of their Rf values to the same constituents present in the 30% Tocomin commercial sample. The chemical profile of extracts varied as a function of extraction time. The intensity of antioxidants, phenolic compounds and volatile oil compounds was reduced, while the intensity of carotenes (bixin) was increased.
Keywords: Annatto, Bixin, Supercritical fluid extraction, Tocotrienols
Cite this paper: Carolina L. C. Albuquerque, Ádina L. Santana, M. Angela A. Meireles, Thin Layer Chromatographic Analysis of Annatto Extracts Obtained Using Supercritical Fluid, Food and Public Health, Vol. 5 No. 4, 2015, pp. 127-137. doi: 10.5923/j.fph.20150504.05.
Article Outline
1. Introduction
- Bixin obtained from Bixa orellana L. (annatto) is the most important natural food grade colorant next to saffron in the global market with a current consumption of 10,650 tons [1]. Brazil is one of the major producers and exporters of annatto seeds and extracts. These products have been used to produce various dairy and fat-based products, such as butter, margarine, cheese, baked foods and snack foods, and they have been used in pharmaceutical products, leather dyes and cosmetics [2].Several carotenoids can be obtained from annatto seeds, mainly bixin and norbixin, and other carotenoids, including β-carotene, cryptoxanthin, lutein, zeaxanthin and methyl bixin, can be obtained but in a lesser quantity [3].In addition to the presence of carotenoids, annatto seed extracts also contain phenolic compounds, namely hypoletin as the major compound and a caffeoyl acid derivative as the minor derivative. The levels of phenolic compounds in annatto seed extracts are 20–30 times lower than the bixin contents [4].High or low extract yields can be obtained for annatto depending on the used extraction method as follows: indirect extraction with solvents; direct extraction using aqueous alkali solutions [5]; supercritical fluid extraction, SFE [6]; pressurized liquid extraction, PLE; and low-pressure solvent extraction, LPSE (that is, atmospheric pressure solvent extraction) [7].Global yield isotherms (GYIs) are used to select the operational conditions of temperature and pressure based on the extraction yield and the chemical composition of the extract. After this selection, the overall extraction curve (OEC) must be determined because it provides information about the kinetic behavior of the SFE process [8].Both carotenoids and phenolic compounds are considered to promote human health because they are responsible for critical biological functions [9].High-pressure technologies involving sub- and supercritical fluids offer the possibility to obtain new products with special characteristics or to design new processes, which are environmentally friendly and sustainable [10]. Supercritical fluid extraction with carbon dioxide is important in natural compound extraction, especially temperature unstable natural compounds [11].Determination and separation of various constituents can be performed by a variety of analytical techniques including gas chromatography (GC), high-performance liquid chromatography (HPLC), thin-layer chromatography (TLC), capillary electrophoresis (CE) and nuclear magnetic resonance (NMR) spectroscopy.Thin-layer chromatography (TLC) and its refined version, high-performance thin-layer chromatography (HPTLC), is an established method of lipid analysis whereby normal phase TLC is traditionally used [12].With its advantages of simplicity, economy, easy operation and required for only small amounts of solvent, TLC is used widely in various fields to separate or purify mixtures of chemical and biological compounds [13].The mobile phase is the transport medium for the compounds to be separated as it migrates through the stationary phase by capillary forces. The type of the mobile phase influences the separation of compounds. The polarity and volatility of the mobile phase as well as the solubility of the components to be separated have to be considered [14].Recently, TLC has been used to qualitatively analyze food samples, such as commercial drinks [15], honey bee [16], pitanga [17], jambú [18], shrimp [19] and cherry [20]. Nevertheless, there is a scarcity of recent available information on the chemical profile of annatto seed analyzed by chromatography. TLC has been applied to qualitatively identify the total carotenoids in annatto, carrot, corn and tomato extracts [21]. Static headspace gas chromatography (HSGC) has been applied to quantify residual solvents in annatto extracts [22]. HPLC and mass spectrometry have been used to identify and quantify the carotenoids and phenolic compounds in annatto seeds [9], HPLC analysis has been used to identify the γ-tocotrienol and δ-tocotrienol compounds in annatto oil obtained by supercritical fluid extraction [23].The TLC separation process consists mainly of the adsorption principle. The adsorption of the solute occurs in the interface between the solid and the mobile phase due to the presence of active groups on its surface. The desorption of the solute implies its return to the mobile phase due to the volatility or solubility in the mobile phase [24].The TLC method allows the rapid identification of the food coloring present in samples by comparison of their Rf (ratio of fronts or retention factor) values and the colors of the extract samples compared to standards [15]. The Rf value depends on the difference of solubilities of the analyte between the stationary and mobile phases [24]. The Rf value is defined as the ratio of the distance travelled by a component to the distance travelled by the solvent front. The Rf value indicates the solubility of the spot components in the TLC plate [25].This study qualitatively evaluated the performance of TLC in determining the composition changes in the chemical profile of annatto seed extracts obtained by SFE through the acquisition of global yield isotherms (GYIs) and the overall extraction curves (OECs).Additionally, standards were used to assist the identification of compounds present in the extracts when known compounds were present in the mixture. The identification of known compounds was performed by the comparison of respective standards through Rf calculation.
2. Material and Methods
2.1. Raw Material
- Annatto variety Piave was obtained from IAC (Agronomic Institute of Campinas) at the Department of Agriculture and Supply of São Paulo, Brazil.Immediately after acquisition, the sample was identified and stored at 225K in the dark until further analysis.
2.2. Obtainment of Extracts
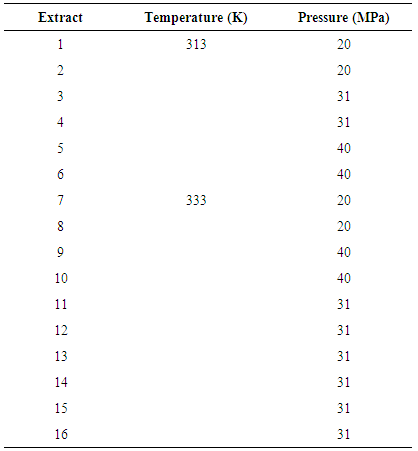
- Global yield isotherms (GYIs) and overall extraction curves (OECs) from whole annatto seeds were determined at 313 and 333K as well as 20, 31 and 40MPa in a 290ml extraction vessel using supercritical carbon dioxide [6].The extract was collected in a 100 ml amber glass vial immersed in an ice bath at ambient pressure. After the extraction, the glass vial remained in a desiccator for ten minutes to allow for the complete elimination of CO2. The total extract mass was determined as the sum of the extract obtained during the extraction and the recovered extract in the cleaning process. The cleaning process consisted of recovering extract from the tubing line leading out of the extraction vessel with acetone. The glass vials (used in both the extraction and cleaning processes) were flushed with N2 and stored at 255 K until analysis.
2.3. Chemicals
2.3.1. Reagents
- Ethyl acetate, acetone and n-hexane (99.8%) were obtained from Merck (Darmstadt, Germany). Glacial acetic acid and concentrated sulfuric acid (99.8%) were purchased from Synth (Diadema, Brazil). Formic acid, petroleum ether and methanol were acquired from Ecibra (Santo Amaro, Brazil).The p-anisaldehyde, 2, 2-diphenyl-1-picrylhydrazyl and 2-aminoethyl diphenylborinate (99.8%) reagents were purchased from Sigma-Aldrich (Darmstadt, Germany). Carotech (Perak, Malaysia) donated Tocomin® (30%).Due to the difficulty in finding suppliers and the high cost of commercial forms of tocotrienols, the 30% Tocomin® commercial sample was used to identify the isomers of tocotrienols on the TLC plates.The commercial sample was an oil (30% tocotrienol suspension), and it was comprised predominantly of α-, β-, γ-, and δ-tocotrienol as well as α-tocopherol, squalene and other minor constituents, such as sterols (β-sistosterol) and carotenoids (β-carotene). The constituents were extracted and concentrated by a molecular distillation process from crude palm (Elaeis guineensis) oil, which was provided by Carotech Inc. Berhad (Malaysia).
2.3.2. Standards
- β-sistosterol (95%), α-tocopherol (97%) and stigmasterol (95%), β-carotene (97%) and squalene (97%) were obtained from Sigma-Aldrich (Darmstadt, Germany). The origin of bixin (96%) was not specified.
2.4. TLC Chromatography
- Concentrated aliquots from the extract solutions were applied onto silica gel 60 plates on aluminum backs (CCF-C/25, Merck, Darmstadt, Germany), which were used as the stationary phase. TLC analyses were performed with the aid of a glass capillary tube. Ultraviolet light (UV)-sensitive (F254) and non-UV-sensitive plates were used in this study.TLC plates were inserted into glass chambers and subjected to elution with the mobile phase. The visualization of the bands generated by constituents that were not observed in the visible region was performed by an UV light (Multiband UV–254-366nm, UVGL-58, Mineralight® Lamp, Upland, CA, EUA) equipped with a cabinet (UVP-Chromato-VUE, CC-10, Upland, CA, EUA) with a short wavelength of 254 nm and a long wavelength of 366nm. For compounds that did not emit fluorescence in the UV light, the visualization of the bands was performed by spraying reagent solutions (spray or visualization reagents) onto the TLC plates to color the bands of compounds. After the exposure, UV light was used to visualize the bands.
2.5. TLC Plate Application
2.5.1. Mobile Phase Selection
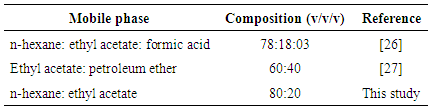
- Initially, TLC analyses were performed by comparing three different proportions and/or combinations of solvents as shown in Table 1.
|
2.5.2. Phenolic Compounds and Flavonoids
- For the visualization of flavonoids and phenolic compounds, the method of Wagner and Bladt [28] was used without applying polyethylene glycol (PEG).A 2-aminoethyl-diphenylborinate (NP) spray reagent was prepared in a 250 ml conical flask by diluting 1 g of 2-aminoethyl-diphenylborinate in 100 ml of methanol.After spraying the plates with the NP solution, they were visualized with UV light at a wavelength of 366nm.
2.5.3. Volatile Oil Composition
- The methodology of Wagner and Bladt [28] was adopted for visualization of volatile oil constituents. A spray reagent of sulfuric anisaldehyde (SA) was prepared in a 250ml conical flask by diluting 0.5ml of p-anisaldehyde in 10ml of glacial acetic acid, 85ml of methanol and 5ml of concentrated sulfuric acid in this order, which formed an intense exothermic reaction. The plates were sprayed with SA. The bands were visualized in the visible region after heating the plates in an oven (Tecnal, TE-385-1, Piracicaba, São Paulo) at 373K for 10 minutes.
2.5.4. Antioxidant Compounds
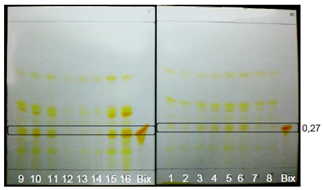
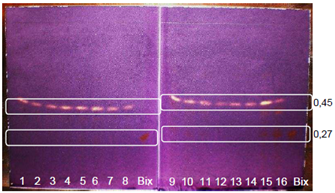
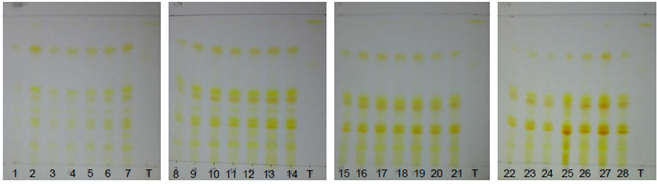
- The revelation of antioxidant compounds was done by spraying a DPPH solution [26] in which 0.5g of 2, 2-diphenyl-1-picrylhydrazyl was diluted in 250ml of methanol.The bands were visualized under natural light to verify the presence of yellow spots versus a purple background. The TLC plates were sprayed with DPPH at time zero (t0), after 15 minutes (t15) and after 30 minutes (t30). The presence of yellow spots indicates the presence of antioxidant constituents in the sample. Bixin and 30% Tocomin were used for the standards.
3. Results and Discussion
3.1. Mobile Phase Selection and Identity of the Extracts
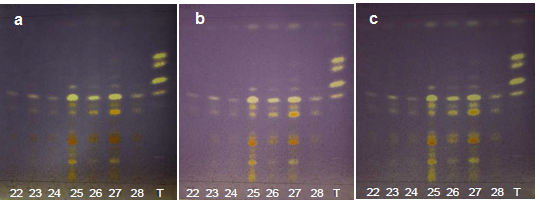
- The eluted TLC plates with the following mobile phases are shown in Figure 1:a) n-hexane: ethyl acetate: formic acid (78:18:3); b) ethyl acetate: petroleum ether (60:40); and c) n-hexane: ethyl acetate (80:20).The n-hexane: ethyl acetate: formic acid (78:18:3) mobile phase achieved the best separation of bands as shown in Figure 1a.
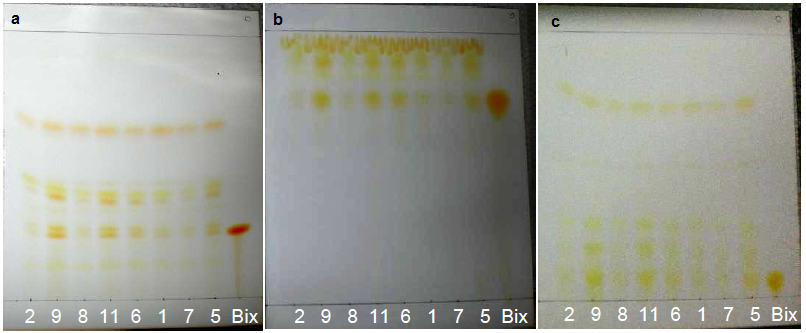 | Figure 1. Selection of the optimal mobile phase of annatto extracts obtained by GYI and bixin (Bix) with the following mobile phases: n-hexane: ethyl acetate : formic acid (a), ethyl acetate : petroleum ether (b) and n-hexane : ethyl acetate (c) |
|
|
 | Figure 2. Extracts from GYIs. Visible zone shown without spray reagent |
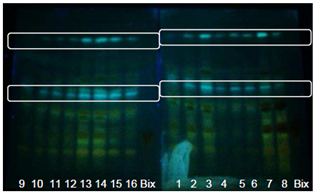
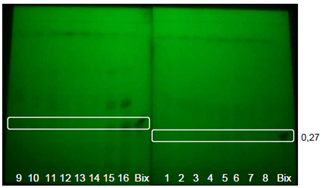 | Figure 3. Extracts from GYIs. Bands visualized with UV light at 254nm without spray reagent using UV-sensitive TLC plates |
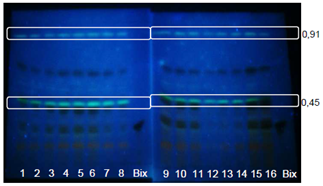 | Figure 4. Extracts from GYIs. Bands visualized with UV light at 365nm without spray reagent |
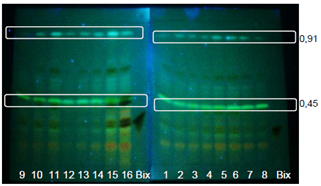 | Figure 5. Extracts from GYIs. Bands visualized with UV light at 366nm without spray reagent using UV-sensitive TLC plates |
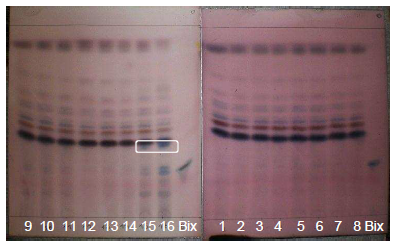
 | Figure 6. Extracts from GYIs. Visible region visualized with DPPH |
3.2. Phenolic Compounds and Flavonoids
- Figure 7 shows the bands of compounds after spraying with NP. Flavonoids are characterized by fluorescence observed with UV light at 365nm. Predominantly orange and yellow-green color indicates flavones and some types of flavonols, and dark green color indicates some types of flavonones. Phenolic carboxylic acids appear as fluorescent blue [28].Figure 7 shows the bands of phenolic compounds visualized with UV light at 366nm after spraying with NP solution.
 | Figure 7. Extracts from GYIs. Bands visualized with UV light at 366 nm with NP using an UV-sensitive plate |
3.3. Volatile Oil Composition
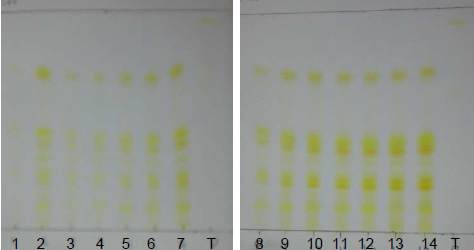
- Studies on the chemical composition of volatile components from water and oil-soluble annatto extracts [31] and volatile annatto oil [32] have utilized gas chromatography and mass spectroscopy to quantitatively analyze the components.Adopting a qualitative method, a p-anisaldehyde sulfuric solution (SA) was used as a spray reagent (Figure 8) to visualize the constituents in volatile oils. This reagent also detects terpenoids, pungent principles, bitter principles and saponins.
 | Figure 8. Extracts from GYIs. Volatile oils visualized with AS |
3.4. Antioxidant Compounds
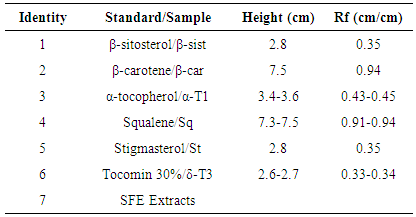
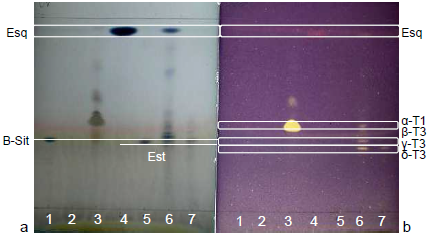
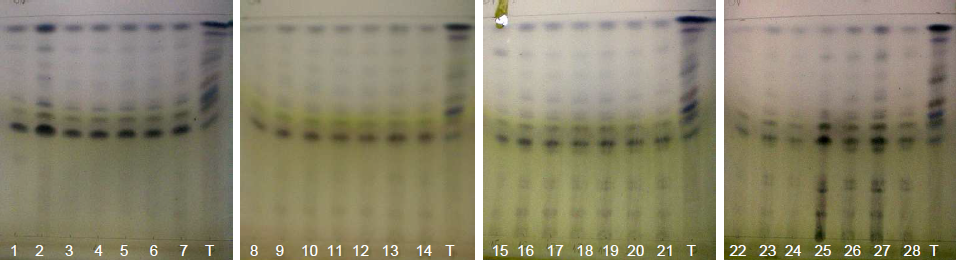
- High intensity bands for δ-tocotrienol and traces of β-tocotrienol were reported on the lipidic fraction extracted from annatto seeds using n-hexane/diethyl ether as the mobile phase in the work of Frega et al. [33].Figure 9 shows the bands of standards, 30% Tocomin and SFE extracts, which were identified in Table 3. The bands of carotenoids, namely β-carotene and bixin/norbixin, from samples 6 and 7, respectively, were visualized in the visible region (Figure 9a).Constituent β-carotene was identified by comparison of its Rf (Table 3). In the UV-254 nm light (Figure 9b), compounds that extinguish the fluorescence were visualized in the α-tocopherol standard and samples 6 and 7. According to the chemical structure of tocopherols and tocotrienols, conjugated double bonds in the cyclic chain from both compounds may have extinguished the fluorescence of the plate.
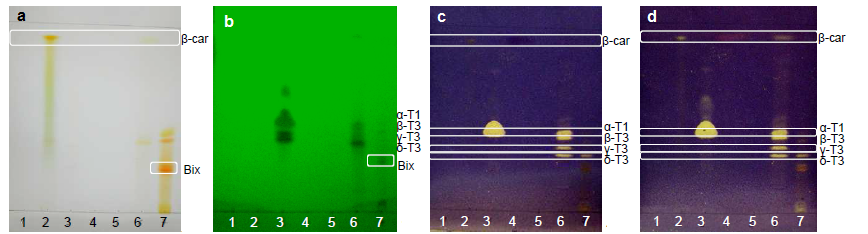 | Figure 9. Standards, annatto extracts and 30% Tocomin 30%: (a) visible region; (b) UV-254 nm without spray reagent on UV-sensitive TLC plate; (c) visible region with DPPH in t0; and (d) visible region with DPPH at t30 |
 | Figure 10. Standards, annatto extracts and 30% Tocomin: (a) volatile oils in the visible region visualized with AS; and (b) antioxidant constituents in the visible zone visualized with DPPH at t30 |
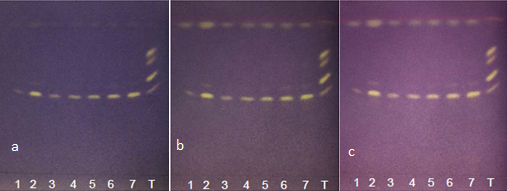 | Figure 11. Annatto extracts from the OECs at 5-50 minutes in the visible zone with DPPH at (a) t0, (b) t15 and (c) t30 |
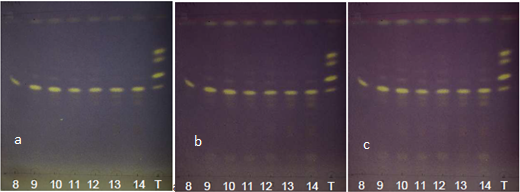 | Figure 12. Annatto extracts from the OECs at 50-135 minutes in the visible region with DPPH at (a) t0, (b) t15 and (c) t30 |
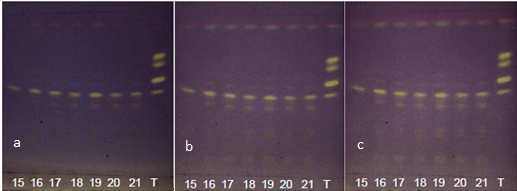 | Figure 13. Annatto extracts from the OECs at 135-260 minutes in the visible region with DPPH at (a) t0, (b) t15 and (c) t30 |
 | Figure 14. Annatto extracts from the OECs at 260-420 minutes in the visible region with DPPH at (a) t0, (b) t15 and (c) t30 |
 | Figure 15. Annatto extracts from the OECs at 50-135 minutes in the visible region |
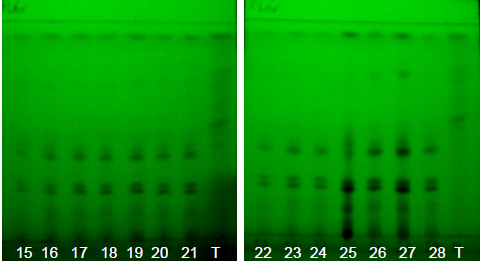 | Figure 16. Annatto extracts obtained by SFE at 50-135 minutes with UV light at 254 nm |
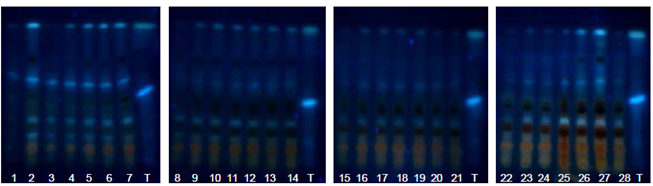 | Figure 17. Annatto extracts from the OECs at 5-420 min with UV light at 366 nm and NP using UV-sensitive plates |
 | Figure 18. Annatto extracts from the OECs at 5-420 minutes in the visible region without spray reagent |
 | Figure 19. Annatto extract from the OECs at 5-420 minutes with volatile oils in the visible region with AS |
4. Conclusions
- In this study, the chemical profile of annatto extracts obtained using supercritical fluid was investigated by TLC. As a function of extraction time, the intensity of antioxidants, phenolic compounds and volatile oil compounds was reduced, while the intensity of carotenes (bixin) was increased.Because this was a qualitative analysis, we did not evaluate the quantity or concentration, and we cannot guarantee which temperature and pressure condition provided extracts with higher or lower concentration of the studied constituents. Based on these results, the 30% Tocomin commercial sample used for isolating the isomers of tocotrienols served as a γ-T3 and δ-T3 standard for the identification analyses of antioxidants by TLC.Although TLC is not a quantitative analysis, it is possible to select the duration of SFE process or predetermined periods for the recovery of extracts during extraction by fractionating it according to the component of interest.
ACKNOWLEDGEMENTS
- Carolina L. C. Albuquerque is grateful to CNPq (Process 143092-2008-1) for her Ph.D. assistantship. Ádina L. Santana is grateful to CAPES for her Ph.D. assistantship. M. Angela A. Meireles acknowledges the productivity grant (301301/2010-7) from CNPq. The authors acknowledge financial support from CNPq and FAPESP (Process: 2009/17234-9). The authors are also grateful to Dr. Eliane G. Fabri (Agronomic Institute of Campinas, IAC) and Mr. W.H. Leong (Carotech Inc., Malaysia) for donating the annatto seeds and the 30% Tocomin commercial sample, respectively.