-
Paper Information
- Previous Paper
- Paper Submission
-
Journal Information
- About This Journal
- Editorial Board
- Current Issue
- Archive
- Author Guidelines
- Contact Us
Food and Public Health
p-ISSN: 2162-9412 e-ISSN: 2162-8440
2014; 4(4): 193-199
doi:10.5923/j.fph.20140404.03
Meat Versus Fish: Health Risk Perception, Convenience, Price, Ethnic Value and Consumption in Ibadan, Nigeria
 Abstract
 Reference
 Full-Text PDF
 Full-text HTML
F. M. Ibrahim1, B. Osikabor1, H. O. Akinosho2, A. A. Adesope1, A. G. Ibrahim3, B. T. Olatunji1, O. F. Akanni2, O. G. Ogunwale1
1Department of Agricultural Extension and Management, Federal College of Forestry, P.M.B. 5087, Ibadan, Oyo State, Nigeria
2Department of Agricultural Technology, Federal College of Forestry, P.M.B. 5087, Ibadan, Oyo State, Nigeria
3Department of Agricultural Extension and Management, Federal College of Animal Health and Production Technology, Moor Plantation, Ibadan, Oyo State, Nigeria
Correspondence to: F. M. Ibrahim, Department of Agricultural Extension and Management, Federal College of Forestry, P.M.B. 5087, Ibadan, Oyo State, Nigeria.
| Email: |  |
Copyright © 2014 Scientific & Academic Publishing. All Rights Reserved.
This paper examined the perception of health risk, convenience, price, ethnic value with regard to meat and fish consumption.Six hundred and sixty copies of a structured questionnaire were randomly and systematically administered in this cross sectional survey. Paired-Samples t test and Pearson’s r were used to assess the difference and similarity between meat and fish consumption respectively. One way ANOVA and t test were used to assess significant differences in means, across sub-groups of marital status and gender respectively. Step-wise multiple regression analysis was used to assess the relationship between and among meat consumption, fish consumption, health risk perception, convenience, price, ethnic value, age and education. The consumption of meat was significantly lower than that of fish (p < 0.001) and negatively correlated with each other (r= -.344, p< 0.001). Gender and marital status had insignificant effect on both meat and fish consumption (p>0.05). Health risk perception significantly but negatively predicted meat consumption but ethnic value, convenience and education significantly and positively predicted same (p<0.05). Price and age did not predict meat consumption (p>0.05). Health risk perception, education and price significantly and negatively predicted fish consumption but convenience significantly and positively predicted same (p<0.05). Ethnic value and age did not predict fish consumption (p>0.05). Reducing health risk perception, increasing ethnic value, convenience and education increased meat consumption with no reference to price and age. Reducing health risk perception, education, price and increasing convenience increased fish consumption but ethnic value and age did not explain same. Gender and marital status had no effect on meat and fish consumption in the study area.
Keywords: Fish, Meat, Consumption
Cite this paper: F. M. Ibrahim, B. Osikabor, H. O. Akinosho, A. A. Adesope, A. G. Ibrahim, B. T. Olatunji, O. F. Akanni, O. G. Ogunwale, Meat Versus Fish: Health Risk Perception, Convenience, Price, Ethnic Value and Consumption in Ibadan, Nigeria, Food and Public Health, Vol. 4 No. 4, 2014, pp. 193-199. doi: 10.5923/j.fph.20140404.03.
Article Outline
1. Introduction
- The question of food insecurity remains central in the dynamics around food in developing countries. In the last few decades however, concerns have dramatically shifted from food insecurity to questions of risk. For instance, the link between food or diet and chronic illnesses has generated so much attention. Among several issues, red meat consumption stands out as a major risk factor in the development of chronic illnesses such as inflammatory arthritis [1], type-2 diabetes [2], metabolic syndrome [3], cardiovascular diseases [3, 4], stroke [5] and cancer mortality [4]. On the contrary, the consumption of fish is relatively tolerated and even encouraged: it was reported that increasing fish consumption may reduce coronary heart disease (CHD) risk in women [6]. It was found that fish consumption was associated with lower risk of type-2 diabetes in men but not in women [7]. Similarly, a meta-analysis of evidence on the association between fish consumption and risk of type 2 diabetes concluded that current public health recommendations which encourage fish consumption should be maintained [8]. Xun and He [9] also performed a meta-analysis and found an inverse association between fish intake and diabetes incidence in Eastern countries, though not in Western countries. Although, Szymanski, Wheeler and Mucci [10] found no association between fish consumption and the incidence of prostate cancer, but reported an association between it and a significant 63% reduction in prostate cancer–specific mortality. Fotuhi, Mohassel and Yaffe [11] conducted a systematic review of the literature to establish the association between eating fish and the risk of cognitive decline or Alzheimer disease (AD). They asserted that their data suggested the protective role of fish consumption in slowing cognitive decline in the elderly, though such consumption does not prevent or treat dementia, including Alzheimer disease (AD). The disparate reputation of meat and fish in the literature raises concerns about people’s comparative consumption of same, which are consequent upon factors in socio-economic and cultural contexts such as health risk perception, convenience, price and ethnic value. As far back as in the 50s, meat among Yoruba people was traditionally consumed by the affluent, especially on rare occasions either when animals died or were sacrificed [12]. Fish and meat consumption may represent public response to these independent factors and, for instance, health risk perception can dictate emerging and prospective policy initiatives [13]. Irrespective of scientific evidences regarding the aptness and otherwise of meat and fish consumption, public’s perspectives and practices should necessarily be examined and incorporated in food related policies. Only then can the potential of decreased meat and increased fish consumption be successfully encouraged and practiced. Thus, this work aimed at establishing a knowledge base about public’s perspective and practices regarding meat and fish consumption by answering the following questions: 1. Which is consumed more between meat and fish in the study area?2. How do respondents comparatively perceive the health risks associated with meat and fish consumption? How does this affect consumption of same?3. What are the demographic, socio-economic and cultural predictors (convenience, price and ethnic value) of meat and fish consumption in the study area?
2. Methods
2.1. Design and Instrument
- The design of this work is cross sectional survey. Six hundred and sixty copies of a structured questionnaire were used to collect data. The questionnaire was also translated to Yoruba and this version was either utilized by those who do not understand or those not comfortable with English language. The informed consent of respondents was sought after the intention of the study was well explained to every respondent. They were thereafter required to sign a form that indicated their consent before completing the questionnaires. The questionnaire was either self administered or administered via structured interview where respondents were not literate enough to complete same on their own. Six hundred and forty one copies of the questionnaire were retrieved after the study (97.1% response rate), 5 copies were discarded due to inadequate completion and 636 were utilized in the final analysis. Data collection took place between December 2013 and March, 2014.
2.2. Population, Procedures and Participants
- The study’s population included male and female adult residents aged 16 years and above in Ibadan. Ibadan is the capital city of Oyo State, South Western Nigeria. Oyo State is a Yoruba land and the people largely speak Yoruba. However, many are bilinguals, speaking both English and Yoruba. Ibadan metropolis is made up of 5 local government areas (LGAs). These are presented below along with their population [14].
 The total population of Ibadan is 1,338,659. Using sample size calculator, (Creative Research system, http://www. surveysystem.com/sscalc.htm), the required sample size at 95% confidence level and confidence interval of 4 is 600. This was increased to 660 to give room for problematic questionnaires. Elements of random and systematic sampling technique were used to select respondents. This process was also multi-staged. Out of the 5 LGAs of the metropolis, 2 were randomly drawn. These were Ibadan North West and Ibadan South West. Three communities each were further randomly selected from these LGAs. They included Jemibewon, Eleyele and Sabo in the former as well as Aleshinloye, Okebola and Oke Ado in the latter LGA. Streets of these communities were identified with the aid of google maps and informal enquiries. Households in each street were estimated and systematic sampling was used to select same. Inclusion criteria included being aged above 16 years and willingness to participate. Where more than one person met the inclusion criteria in a household, a coin was tossed to determine who participated.
 2.3. Definition of Variables/Measures
2.3.1. Health Risk Perception
- This was defined as the perceived likelihood that the consumption of meat or fish could hamper health. Health risk perception of meat was assessed with a 3-item author devised Likert scale. Examples of items in the scale are ‘the chances of developing an illness from eating meat rather than fish is very high’, ‘meat causes illnesses when compared with fish’. Cronbach alpha was 0.72. Health risk perception of fish was also assessed with a 3-item author devised Likert scale. Examples of these items are ‘fish can guard against several illnesses when compared with meat’, ‘fish is better for health when compared with meat’. The Cronbach alpha was 0.69. Response categories ranged from ‘strongly agree’ to ‘strongly disagree’ and the midpoint was ‘unsure’. Range of possible scores was 3 to 15 in each scale.
2.3.2. Convenience
- Convenience is defined as the ease at which meat rather than fish could be consumed, and vice versa. Convenience of meat consumption was assessed with a 5-item author-adapted version of the 5 item convenience subscale in the food choice questionnaire [15]. Crobach alpha was 0.79. Convenience of fish consumption was similarly assessed. Crobach alpha was 0.74. The author adapted versions assessed the extent to which respondents agreed that meat rather than fish (and vice versa) is easier to prepare, can be cooked very simply, takes no time to prepare, can be bought in shops close to where respondents live and is easily available in shops and supermarkets. Response categories ranged from ‘strongly agree’ to ‘strongly disagree’ and the midpoint was ‘unsure’. Range of possible scores was 5 to 25 in each scale.
2.3.3. Price
- This is respondent’s estimation of the cost of meat rather than fish, and vice versa. Price of meat was assessed with a 3-item author-adapted version of the 3-item price subscale in the food choice questionnaire [15]. Crobach alpha was 0.72. Price of fish was similarly assessed in the same manner and its Crobach alpha was 0.76. The author adapted versions assessed the extent to which respondents agreed that meat rather than fish (and vice versa) was- generally more expensive than fish, cheaper than fish, good value for money when compared with fish. Response categories ranged from ‘strongly agree’ to ‘strongly disagree’ and the midpoint was ‘unsure’. Range of possible scores was 3 to 15 in each scale.
2.3.4. Ethnic Value
- This is the extent to which respondents think that their ethnic group places significance on the consumption of meat rather fish and vice versa. Ethnic value of meat was assessed with 2 items: ‘meat is more appreciated than fish among the people of my ethnic group’ and ‘people of my ethnic background prefer to be served meat rather than fish’. Crobach alpha was 0.89. Ethnic value of fish was similarly assessed with 2 items: ‘people of my ethnic background serve fish to important visitors rather than meat’, ‘fish is more important to people of my ethnicity than meat’. Crobach alpha was 0.86. Response categories ranged from ‘strongly agree’ to ‘strongly disagree’ and the midpoint was ‘unsure’. Range of possible scores was 2 to 10 in each scale.
2.3.5. Meat and Fish Consumption
- This is the level of respondent’s meat and fish intake. Meat consumption was assessed with a 3 item index which determined the number of days respondents eat meat in a typical week, the number of pieces of meat usually eaten on those days and the frequency at which meat was served with respondent’s meal in the past 30 days. Responses to the last item included ‘usually’, ‘sometimes’, ‘rarely’, and ‘never’ with meat. These were scored from 4 to 0. Crobach alpha was 0.68. Fish consumption was assessed in a similar manner and its Crobach alpha was 0.65. Respondent’s score in each item was converted to scale of 0 to 10 by dividing the score in each item with the maximum score of the item and then multiplying by 10. The three scores were then sumed. Range of possible scores was 0 to 30 in each scale.
2.3.6. Socio-demographic Variables
- Nominal measures were used to assess gender, marital status, main work status and ethnic background. Age and highest educational qualification were assessed as continuous variables with the latter ranging from 1 to 7.
2.4. Data Analysis
- The profile of respondents was examined with simple percentile analysis, mean, median and the mode. Scores from items in various scales were aggregated. One sample Kolmogorov Smirnov test (for normalcy) was used to test whether the data deviate significantly from normal distributions and they were not (p > 0.05). Paired-Samples t test and r were used to assess the difference and similarity between meat and fish consumption respectively. One way ANOVA was used to assess significant differences in means across sub-groups of marital status. The t test was used to test this difference between gender sub groups. Step-wise multiple regression analysis, including Pearson’s correlation coefficient (r), multiple R, multiple coefficient of determination (R2) and beta coefficient (β) were used to elaborate the relationship between and among meat consumption, fish consumption, health risk perception, convenience, price, ethnic value, age and education. All data were analyzed with Statistical Package for Social Sciences (version 17).
3. Results and Discussion
3.1. Socio-demographic Profile of Respondents
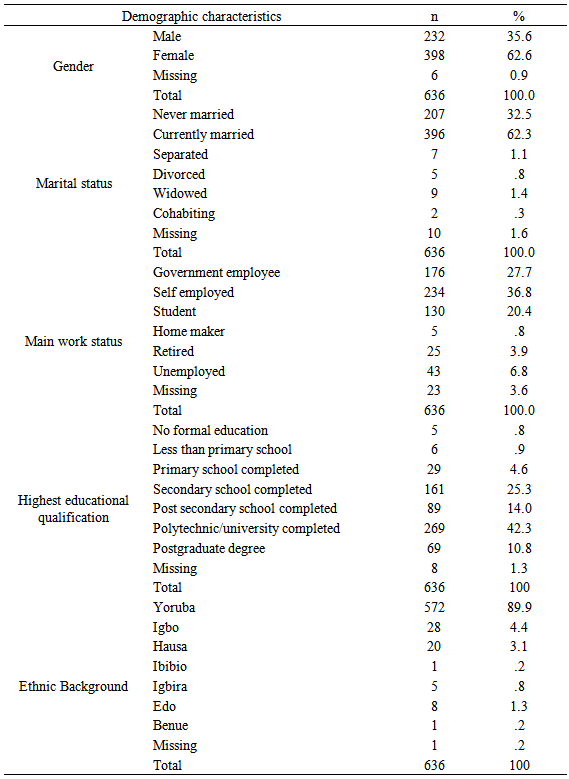
- The mean age of respondents was 33.2, the median was 31 while the modal age was 30 (min. = 16, max. = 73, range = 57). These reflect the youthful nature of the population of the study area. These data are substantiated by the position of Awogbenle and Iwuamadi [16] who claimed that two-third of African population is aged below 30. Females and males were 62.6 and 35.6% respectively, reflecting a preponderance of females in the study. This is probably because more women rather than men were likely to be met at home or to work close to home during data collection. The gender of six respondents (0.9%) was unaccounted for. The majority of respondents were married (62.3%) while 32.5% were never married. This percentage of unmarried people is quite high and probably reflects the young age of the population of the study area or poor access to the prerequisites of marriage including but not limited to financial resources. Minor percentages of respondents were separated (1.1), divorced (0.8), widowed (1.4) or cohabiting (0.3) while 1.6% of respondents did not indicate their marital status. The main work status of respondents varied considerably with government employees (27.7%), self employed individuals (36.8%) and students (20.4%) dominating the pool of respondents. A noticeable percentage was unemployed (6.8%) while 3.9% were retired. A negligible percentage (0.8) of respondents was homemakers. This vaguely reflects the unpopularity of being an housewife in the study area. Three point six percent (3.6%) of respondents who were probably unemployed did not indicate their work status. The highest educational qualification of respondents appears impressive, the majority were graduates (42.3%). This was followed by those who completed secondary school (25.3%), those who held post secondary school qualification (14%) and those possessing postgraduate qualification (10.8%). Negligible percentages (0.8 and 0.9) of respondents were either not formally educated or completed less than primary schooling respectively while 4.6% of respondents completed primary schooling. A trivial number of respondents (1.3%) did not indicate their formal educational status. These data supports the notion that there has been a multiplication of candidates acquiring tertiary education in Nigeria [16]. An overwhelming majority of respondents (89.9%) were expectedly Yoruba. However, people of other ethnic backgrounds were represented in the study: Igbo (4.4%), Hausa (3.1%) and Edo (1.3%). Other marginally represented ethnic backgrounds were Igbira (0.8%), Ibibio (0.2%) and Benue (0.2%). The summary of data on the socio-demographic profile of respondents is presented in Table 1.
|
3.2. Meat Versus Fish Consumption in the Study Area
- Meat consumption was 14.8±5.5 (min. = 0, max. =30) while fish consumption was 17.5± 4.1 (min. = 2.5, max. = 30). The difference between these means is significant (t statistic = 8.553, p < 0.001). The consumption of meat is significantly lower than that of fish in the study area. This suggests that the consumption of meat and fish in the study area share some similarity with recommendable standards. Meat and fish consumption are inversely and significantly related (r = -.344, p< 0.001). This shows that meat and fish consumption are significantly and negatively associated. This is equally delightful. However, this coefficient is only fair and does not depict an ideal situation which abhors meat consumption.
3.3. Influence of Gender on Meat and Fish Consumption
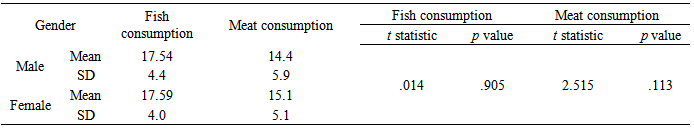
- Fish consumption among males was 17.54±4.4 while female’s was 17.59±4.0. Both males and females consumed almost the same quantity of fish. This difference was insignificant (p > 0.05). The meat consumption score among males was 14.4±5.9 while female’s was 15.1±5.1. These show that females consumed more meat when compared with males but this difference was insignificant (p> 0.05). Hence, gender is an insignificant factor in both meat and fish consumption in the study area. The summary of results obtained in the analysis of the influence of gender on meat and fish consumption in the study area is presented in Table 2.
|
3.4. Influence of Marital Status on Meat and Fish Consumption
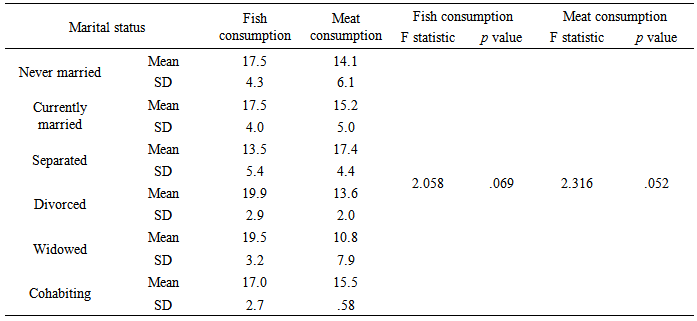
- Divorced respondents consumed fish the most (19.9±2.9). This was closely followed by the widowed (19.5±3.2). Fish consumption among the currently married (17.5±4.0), the never married (17.5±4.3) and the cohabiting (17.0±2.7) appear very similar. Individuals who have separated from their spouses had the least score of fish consumption (13.5±5.4). These differences are insignificant (p > 0.05). Descriptive statistics further shows that meat consumption is highest among the separated (17.4±4.4). This was followed by cohabiting (15.5±0.58) and currently married respondents (15.2±5.0). These differences are insignificant (p > 0.05). Hence, marital status is an insignificant factor in both meat and fish consumption in the study area. The summary of results obtained in the analysis of the influence of marital status on meat and fish consumption in the study area is presented in Table 3.
|
3.5. Health Risk Perception, Convenience, Price, Ethnic Value, Age, Education and Meat Consumption
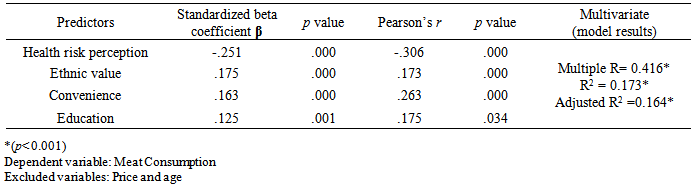
- The predictors of meat consumption as yielded by step-wise multiple regression analysis include health risk perception (standardized β = -.251, Pearson’s r = -.306, p < 0.001), ethnic value (standardized β = .175, Pearson’s r = .173, p < 0.001), convenience (standardized β = .163, Pearson’s r = .263, p< 0.001) and education (standardized β = .125, Pearson’s r = .175, p < 0.05). These significant coefficients are weak but instructive: the inverse relationship between health risk perception and meat consumption imply that as the former increases, the latter reduces. Hence, meat consumption increases with reducing perception of health risk. This bears negativity for public health nutrition in the study area. Further, the linear relationship between meat consumption and ethnic value imply that meat consumption increases with increasing ethnic value. This suggests that ethnic and cultural positions are important for meat consumption in the study area. The significant linearity found between meat consumption and convenience also demonstrates the importance of transient factors in meat consumption. It indicates that convenience is a motivation of meat consumption. Increasing education was also found to increase meat consumption. This signifies the inconsequential consequence of educational achievement on the quantity of meat that the individual consumes. This situation further underscore the importance of health education as the conventional education appears not enough to inform healthy food choices. Meanwhile, price was found to be of no consequence for meat consumption. This is counter-intuitive as consumption normally responds to price. However, it is a positive development for public health and nutrition since it implies that economic ability does not mediate who eats meat or otherwise. Age was also found to have no relationship with meat consumption. This bears negativity for public health and nutrition as it is ideal to reduce one’s consumption of meat as one grows older. Meanwhile, this finding is contrary to that of Anyiro et al. [17], who reported that the meat consumption was influenced by age and price. This incongruence could be attributed to methodological differences or cultural differences in the targeted population of both studies. The multivariate analysis of meat consumption and the combination of its four significant predictors yielded a Multiple R of 0.416, R2 of 0.173 and an adjusted R2 of 0.164 (p < 0.001). This shows that only 16.4% of the variation in meat consumption is weakly explained by health risk perception, ethnic value, convenience and education. Price and age demonstrated transient or no association with meat consumption. A summary of the significant results is presented in Table 4.
|
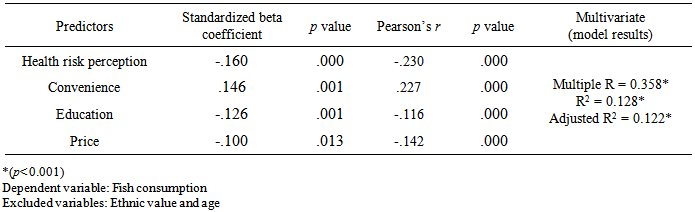
3.6. Health Risk Perception, Convenience, Price, Ethnic Value, Age, Education and Fish Consumption
- Fish consumption was predicted by the following variables after step-wise multiple regression: health risk perception (standardized β = -.160, Pearson’s r = -.230, p < 0.001), convenience (standardized β = .146, Pearson’s r = .227, p < 0.005), education (standardized β = .-126, Pearson’s r = -.116, p < 0.05) and price (standardized β = -.100, Pearson’s r = -.142, p < 0.001). Although weak, these significant coefficients are informative. The negative relationship between health risk perception and fish consumption shows that the latter increases with reduced perception of health risk. This singular finding is a positive development for public health and nutrition in the study area. This is so because fish consumption is safer for health, when compared with meat’s. For instance, reduced meat and increased fish consumption are among the strategies recommended for surviving breast cancer [18]. Further, the linear relationship between fish consumption and convenience indicated that perceived ease of preparing fish is a significant factor motivating its consumption. Education serves no protective role predisposing fish consumption as it was inversely related with fish consumption. This once again demonstrates the importance of nutrition education. Price was found to be significantly but inversely related with fish consumption. Fish consumption increases with reduced price. This is similar to other findings which reflected that price determined fish consumption [19]. Fish consumption reacts to the law of demand which expects increased demand with reduced price. Ethnic value demonstrated insignificant association with fish consumption. Cultural standards appear to have no bearing on motivations to consume fish. Age also demonstrated insignificant association with fish consumption. Increasing age is an ideal reason to increase fish rather than meat consumption, hence, this result proffers a negative outlook for public health and nutrition.The multivariate analysis of fish consumption and the combination of its four significant predictors yielded a Multiple R of 0.358, R2 of 0.128 an adjusted R2 of 0.122 (p< 0.001). This shows that only 12.2% of the variation in fish consumption is weakly explained by health risk perception, convenience, education and price. Ethnic value and age bears no significance for meat consumption. A summary of the significant coefficients in fish consumption is presented in Table 5.
|
4. Conclusions
- The pattern of meat and fish consumption faintly resembles the ideal, recommendable standard in the study area. Gender and marital status are impractical explanations for meat and fish consumption. The perception of health risk associated with consuming both meat and fish is similar, with similar effect on the consumption of both. This is a positive development for fish but not meat consumption. Both meat and fish are perceived as safe for health. While this is a positive development for fish consumption, the same cannot be said of meat consumption. Ethnic value is implicated in meat but not fish consumption. Convenience is a practical explanation for both meat and fish consumption as it predisposes both. Increased education does not protect against or predispose meat and fish consumption respectively. Price is both irrelevant and relevant to meat and fish consumption respectively. Age is not useful in explaining both fish and meat consumption. The pattern of meat and fish consumption in the study area needs to be sustained while fish consumption is further improved upon.