-
Paper Information
- Paper Submission
-
Journal Information
- About This Journal
- Editorial Board
- Current Issue
- Archive
- Author Guidelines
- Contact Us
Food and Public Health
p-ISSN: 2162-9412 e-ISSN: 2162-8440
2014; 4(4): 181-184
doi:10.5923/j.fph.20140404.01
Effect of Frying Process on Physicochemical Characteristics of Corn and Sunflower Oils
 Abstract
 Reference
 Full-Text PDF
 Full-text HTML
Hassan A. Mudawi1, Mohammed S. M. Elhassan2, Abdel Moneim E. Sulieman3
1Department of Food Science and Technology, University of Khartoum, Khartoum, Sudan
2Food Processing Research Centre, Khartoum-North, Sudan
3Department of Biology, Faculty of Science, University of Hail, Kingdom of Saudi Arabia
Correspondence to: Abdel Moneim E. Sulieman, Department of Biology, Faculty of Science, University of Hail, Kingdom of Saudi Arabia.
| Email: |  |
Copyright © 2014 Scientific & Academic Publishing. All Rights Reserved.
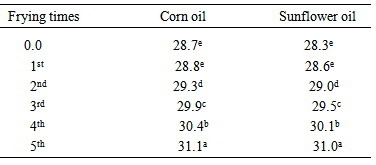
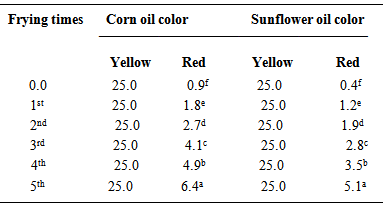
This study has been conducted to explore the effect of frying on the physical and chemical characteristics of corn and sunflower oils. For the purpose of this study, corn and sunflower oils and potatoes were obtained from the local market; the oils were reused for frying five days consecutively. After each frying process a sample of oil was taken daily after it cools. The samples were physically and chemically tested, all the physicochemical characteristics were changed. The colour of corn and sunflower oils increased from 0.9 to 6.4 and from 0.4 to 5.1, respectively. Whereas the refractive index of corn and sunflower oils increased from1.4750 to1.4820, and from 1.4750 to 1.4810, respectively. On the other hand, the viscosity of corn oil and sunflower oil increased from 28.7 to 31.0, viscosity of sunflower oil increased from 28.7 to 31.0. The free fatty acids increase in corn oil from 0.125 to 200.0 whereas in sunflower oil they increased from 0.110 to 0.150. In case of peroxide value in both oils the study showed that it was not constant. It worth mentioning here that the frying process followed in this study is the same that is usually used at homes.
Keywords: Frying, Viscosity, Refractive index, Corn, Free fatty acids
Cite this paper: Hassan A. Mudawi, Mohammed S. M. Elhassan, Abdel Moneim E. Sulieman, Effect of Frying Process on Physicochemical Characteristics of Corn and Sunflower Oils, Food and Public Health, Vol. 4 No. 4, 2014, pp. 181-184. doi: 10.5923/j.fph.20140404.01.
Article Outline
1. Introduction
- Fat frying is one of the oldest and popular food preparation. Fried foods have desirable flavor, color and crispy texture, which make deep-fat fried foods very popular to consumers [1]. Frying is a process of immersing food in hot oil with a contact among oil, air, and food at a high temperature of 150 to 190℃. The simultaneous heat and mass transfer of oil, food and air during fat frying produces the desirable and unique quality of fried foods. Frying oil acts as a heat transfer medium and contributes to the texture and flavor of fried food. Fat frying produces desirable or undesirable flavor com-pounds and changes the flavor stability and quality of the oil by hydrolysis, oxidation, and polymerization. Tocopherols, essential amino acids, and fatty acids in foods are degraded during deep-fat frying. The reactions in deep-fat frying depend on factors such as replenishment of fresh oil, frying conditions, original quality of frying oil, food materials, type of fryer, antioxidants, and oxygen concentration. High frying temperature, the number of frying, the contents of free fatty acids, polyvalent metals, and unsaturated fatty acids of oil decrease the oxidative stability and flavor quality of oil. Antioxidants decrease the frying oil oxidation, but the effectiveness of antioxidant decreases with high frying temperature. Frying time, food surface area, moisture content of food, types of breading or battering materials, and frying oil influence the amount of absorbed oil to foods [2]. Foods fried at the optimum temperature and time have golden brown color, are properly cooked, crispy, and have optimal oil ab-sorption [3]. However, under-fried foods at lower temperature of shorter frying time than the optimum have white or slightly brown color at the edge, and have un-gelatinized or partially cooked starch at the center. The under-fried foods do not have desirable deep-fat fried flavor, good color, and crispy texture. Over-fried foods at higher temperature and longer frying time than the optimum have darkened and hardened surfaces and a greasy texture due to the excessive oil absorption.The hydrolysis, oxidation, and polymerization of oil are common chemical reactions in frying oil and produce volatile and nonvolatile compounds. Most of volatile compounds evaporate in the atmosphere with steam and the remaining volatile compounds in oil undergo further chemical reactions or are absorbed in fried foods. The nonvolatile compounds in the oil change the physical and chemical properties of oil and fried foods. Nonvolatile compounds affect flavor stability and quality and texture of fried foods during storage. Deep-fat frying decreases the unsaturated fatty acids of oil and increases foaming, color, viscosity, density, specific heat, and contents of free fatty acids, polar materials, and polymeric compounds. The sole objective of the present study was to explore the effect of frying on the physical and chemical characteristics of corn and sunflower oils.
2. Materials and Methods
2.1. Preparation of Raw Materials
- Both refined, bleached and deodorized sunflower and corn oils were purchased from local market. Potatoes used in the frying experiments were of the variety Bintje and brought from the Agricultural Research Corporation.Potato tubers were peeled, sliced to a thickness of 2–4 mm using a manual slicer, dipped in water to reduce browning, then used in frying.
2.2. Frying Process
- Frying process on the two oils were done simultaneously: About 1.5 Kg oils were heated up to 180℃, two hundred grams potato slices (variety Bintje) were fried. The length of frying time was kept constant at 13 minutes. The frying was carried out with sunflower and corn oils for five consecutive days. The same quality and variety of potatoes was used in all five days of experiment. The frying was carried out in a frying pan. At the end of each frying experiment, the oil was allowed to cool; 100 g oils were sampled from it into a clean glass dark container and stored in the deep-freezer until assessment. The deep-frozen sample of oil was prepared for analysis by allowing it to thaw at room temperature and then the oil samples were put in 250 ml conical flasks for further analysis.
2.3. Oil Physical Characteristics
2.3.1. Refractive Index
- The refractive index (RI) was determined by Abbe 60 refractometer as described by the AOAC. method [4]. A double prism was opened by means of screw head and few drops of oil were placed on the prism. The prism was closed firmly by tightening the screw head. The instrument was then left to stand for few minutes before reading in order to equilibrate the sample tem-perature with that of the instrument (32 ± 2℃). The refractometer was cleaned between readings by wipping of the oil with soft cloth, then with cotton moistened with petroleum ether and left to dry.
2.3.2. Colour
- The color intensity of oils was recorded using a Lovibond Tintometer as units of red, yellow and blue according to the AOAC method [4]. Samples of oil were filtered through filter paper immediately before testing. An appropriate cell (2” cell) was filled with oil and placed in the tintomeer nearby the window for light. The instrument was switched on and looked through the eye piece. The yellow colour was adjusted to 25, then slides were adjusted until a colour match was obtained from a combination of red and blue. The values obtained by matching were recorded as red, yellow and blue.
2.3.3. Viscosity
- The viscosity of the oil samples was recorded using an Ostwald-U-tube viscometer according to Cocks and Van Rede [5]. The viscometer was suspended in the constant temperature bath (32 ± 2℃) so that the capillary was vertical. The instrument was filled to the mark at the top of the lower reservoir with the oil by means of pipette inserted into the side arm, so that the tube wall above the mark is not wetted. The instrument was then left to stand for few minutes before reading in order to equilibrate the sample temperature with that of the instrument (32 ± 2℃). By means of the pressure on the respective arm of the tube, the oil moved into the other arm so that the meniscus is 1 cm above the mark at the top of the upper reservoir. The liquid was then allowed to flow freely through the tube and the time required for the meniscus to pass from the mark above the upper reservoir to that at the bottom of the upper reservoir was recorded. The viscosity was calculated using the equation: V = (T ─ T0)/ T0Where:V = Viscosity.T = Flow-time of the oil.T0 = Flow-time of distilled water
2.3.4. Peroxide Value (PV)
- The peroxide value (PV) of the oil samples was determined according to the AOAC method [4]. One gram of the oil was accurately weighed into 250 ml conical flask. Thirty ml of a mixture of glacial acetic acid and chloroform (3:2) were added and the solution was swirled gently to dissolve the oil. A 0.5 ml of 0.1 N KI was added to the flask, and then the contents of the flask were left to stand for one minute then adding 30 ml of distilled water. The contents were titrated with 0.01N sodium thiosulphate until the yellow colour almost disappeared. A 0.5 ml of 1% starch solution was added, and the titration continued with vigorous shaking until the blue colour completely disappeared. Volume of 0.01N sodium thiosulphate required (a) were recorded. The same process was repeated for blanks. Volume of 0.01N sodium thiosulphate required by the blank (b) was recorded. The peroxide value was calculated using the formula:
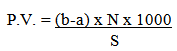 Where:b = Volume of sodium thiosulphate required for blank (ml).a = Volume of sodium thiosulphate required for oil sample (ml).N = Normality of sodium thiosulphate.S = Weight of oil sample used (g).
2.4. Determination of Free Fatty Acids (FFA)
- FFA determination was carried out according to the AOAC method [4]. Five grams of the oil were weighed accurately into 250 ml conical flask. Fifty ml mixture of 95% alcohol and ether solvent (1:1) were added. The contents of the flask were then heated with caution until the oil was completely dissolved, the solution was neutralized after addition of one ml of phenolphthalein indicator. The contents of the flask were then titrated with 0.1N KOH with continuous shaking until a pink colour persisted for 15 seconds. The number of ml of 0.1N KOH required was recorded. The following formula was used in calculation:
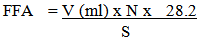 Where:V = Volume of KOH used (ml).N = Normality of KOH.28.2 = Molecular weight of oleic acid S = Weight of oil sample used.
2.5. Statistical Analysis
- Triplicate of each sample was analyzed using statistical analysis system. The analysis of variance was performed to examine the significant effect in all parameters measured. Least significant difference (LSD) was used to separate the means.
3. Results and Discussion
3.1. Physicochemical Properties of Sunflower and Corn Oils
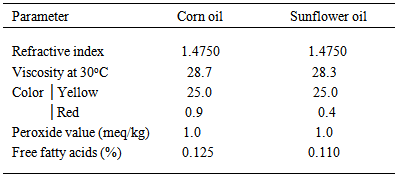
- Table (1) shows the initial values of the physicochemical properties of sun flower and corn oils used in experiments. The general feature of oils reflects good colors, acceptable levels of acidity and peroxides.
|
3.2. Changes in Physical Parameters of Oils during Frying
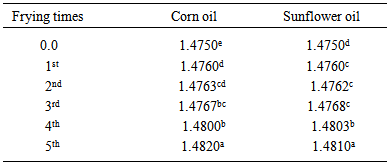
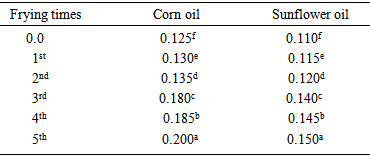
- Table (2) shows changes in refractive index (RI) of both oils during frying of potato chips (corn oil, from 1.4750 in control sample to 1.4820 after the fifth frying process, sunflower oil, from 1.4750 in control sample to 1.4810 after the fifth frying process). The RI exhibited significant increase (p≤0.05) in both oils by frequent frying. Increase of RI of oils by frying was reported also by Tyagi and Vasishtha [6] in soybean oil.
|
|
|
3.3. Changes in Chemical Parameters of Oils during Frying
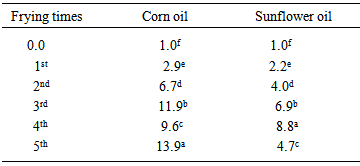
- Table (5) shows changes in peroxide value (PV) of corn and sunflower oils as a result of frequent use in frying of potato chips (corn oil, from 1.0 m.Eq/kg in control sample to 11.9 m.Eq/kg after the third frying process to 9.8 m.Eq/kg after the fourth frying process to 13.9 m.Eq/kg after the fifth frying process. Sunflower oil, from 1.0 m.Eq/kg in control sample to 8.8 m.Eq/kg after the fourth frying process to 4.7 m.Eq/kg after the fifth frying process). The PV increased significantly (p≤0.05) directly after second frying time. Similar increase in peroxide value of sesame oil were observed earlier by deep frying [10].
|
|
4. Conclusions
- Based on the results, all the physicochemical characteristics of corn and sunflower oils were changed due to the five consecutive frying processes. The present study was conducted using one item of food which is potatoes, while so many other items exist and they may give different results if tested, especially in connection with physical characteristics. Therefore, similar studies using other food items are recommended. More research is needed in this field to cover more types of oils other than corn and sunflower oils.
ACKNOWLEDGEMENTS
- The authors express sincere thanks to all who helped execution of the study especially the staff members and technicians of the Department of Food Science and Technology, University of Khartoum.