-
Paper Information
- Paper Submission
-
Journal Information
- About This Journal
- Editorial Board
- Current Issue
- Archive
- Author Guidelines
- Contact Us
Food and Public Health
p-ISSN: 2162-9412 e-ISSN: 2162-8440
2014; 4(3): 151-161
doi:10.5923/j.fph.20140403.10
Main Food Sources of Energy, Nutrients and Dietary Fiber, According to the Purpose and Degree of Processing, for Beneficiary Adolescents of the ‘Bolsa Família’ Program in Brazil
 Abstract
 Reference
 Full-Text PDF
 Full-text HTML
A. G. O. Sartori 1, M. Vieira Da Silva 2
1Department of Agroindustry, Foods and Nutrition, University of São Paulo, Piracicaba, CEP: 13418-260, Brazil (Master in Food Science and Technology)
2Department of Agroindustry, Foods and Nutrition, University of São Paulo, Piracicaba, CEP: 13418-260, Brazil
Correspondence to: A. G. O. Sartori , Department of Agroindustry, Foods and Nutrition, University of São Paulo, Piracicaba, CEP: 13418-260, Brazil (Master in Food Science and Technology).
| Email: |  |
Copyright © 2014 Scientific & Academic Publishing. All Rights Reserved.
The consumption of processed foods has risen since the 1970s in developing countries such as Brazil, mainly among children and adolescents. The aim of this study was to describe the contribution of foods, classified by purpose and degree of processing and inclusion of food additives, to energy, macronutrients, dietary fiber, vitamins, and minerals intake for individuals between 10 and 18 years-old beneficiaries of the ‘Bolsa Família’ Program (BFP) in Brazil. The data is from the personal food consumption module of the National Household Budget Survey (cross-sectional study), conducted by the Brazilian Institute of Geography and Statistics (IBGE), in 2008-2009. Food products were classified into three distinct categories: 1) fresh and minimally processed foods; 2) processed foods (containing food additives, except flavoring and coloring agents); and 3) highly processed foods (containing flavoring and coloring agents).Adolescents from the sample were grouped in two groups: BFP beneficiaries or non-beneficiaries. Average values and standard deviations of energy, dietary fiber, and nutrients ingested during one day were calculated. Beneficiaries of the BFP, in relation to the others, obtain more energy content from fresh and minimally processed foods. However, the sum of energy from processed and highly processed products provided most of the energy. Highly processed foods were highlighted as sources of trans fatty acids, but also contain considerable amounts of calcium and vitamin B1. Fresh and minimally processed foods were the main sources of dietary fiber, minerals (except for manganese), folate, vitamin A (only for boys) and vitamin E. Processed foods were major sources of vitamins of B complex, C, A (only for girls), and D vitamins. Thus, analysis about the purpose and degree of processing that food undergone may help public policy makers to design effective initiatives at improving nutrition status of population.
Keywords: Adolescents, Food processing, Energy intake, Nutrients, ´Bolsa Família’ Program
Cite this paper: A. G. O. Sartori , M. Vieira Da Silva , Main Food Sources of Energy, Nutrients and Dietary Fiber, According to the Purpose and Degree of Processing, for Beneficiary Adolescents of the ‘Bolsa Família’ Program in Brazil, Food and Public Health, Vol. 4 No. 3, 2014, pp. 151-161. doi: 10.5923/j.fph.20140403.10.
Article Outline
1. Introduction
- Poverty can be defined as the lack of permanent supply of basic needs such as food, health, clothing, housing, education and transportation to the population. Poverty is the main cause of food insecurity, which is the deprivation of regular and permanent access to sufficient amount of quality food [15] [34].In Brazil, the ‘Bolsa Família’ Program (BFP), was created in 2003. Studies have shown that this benefit has been used mainly for food purchase [27] [14] [31]. The BFP provides support to low-income families, who hold a salary up to US$ 60.00 per capita [7]. The amount of the benefit granted by the government varies according to the household income, number of children and adolescents, pregnant women and/or breast feeding mothers [9]. In March 2013, the average value of the benefit was US$ 64.54 per month per family and the total number of families benefited from the program amounted to 13,872,243, totaling 49,637,552 people [11].These families are frequently more exposed to deficiency diseases (caused by insufficient intake of micronutrients), obesity and associated comorbidities, due to excessive energy intake [10]. The easy access and, consequently, increased consumption of industrialized and highly processed foods have been observed in samples of this group, especially among the youngsters [27] [31] [45] [1] [44].In 2005, Hawkes [21] stated an issue that was happening mainly from 1980’s on. The author warned that the reduction of diversity of plant and animal species in foods by transnational food companies would bring effects, which would compromise the diet balance and health condition of the population. The possible role of ‘high value foods’, or highly processed food, that are manufactured in different countries in a standardized process was also highlighted. These products have undergone extensive processing, distinguishing them from products known as primarily processed, such as vegetable oils and sugar.In 2009, Monteiro [37] underlined that processing methods are applied to most foods consumed in developed and developing countries. In addition, a system co-written by the Monteiro [38] classified foods into three groups: 1) fresh and minimally processed; 2) foods and cooking ingredients; and 3) ultra-processed foods. The food from group 2 refers to “primarily processed” and food from group 3 have similar concept of highly processed foods described by Hawkes [21].However, considering the technological point of view, the adopted categorization includes in the same group (Group 3 or highly processed), foods subjected to distinct processing levels, such as fresh foods preserved in salt, sugar or oil, and foods consisting of little or no fresh ingredient.Studies on epidemiology show correlations between diets consisting primarily of highly processed foods and weight gain and increased risk of cardiovascular diseases and diabetes during lifetime. On the other hand, dietary patterns composed primarily of fresh or minimally processed foods seem to have a protective effect against these disorders [24] [25] [20] [2] [32] [22] [41] [47].Food processing and preparation can cause enzyme inactivation, eliminate or inactivate toxic substances of natural occurrence, eliminate pathogenic or spoilage microorganisms (especially mesophilics), increase not only shelf life but also the acceptance of consumers by changing sensory aspects, such as color, flavor and aroma [46]. The techniques applied in food manufacture and food storage, as well as food transport can result in significant nutrient loss in foods [39] [33] [53] [46] [19]. Nevertheless, the industry can replace these substances by adding natural or synthetic vitamins, minerals and amino acids. Another feature applied by the industry is food supplementation by adding nutrients, not necessarily found originally in the food, especially in formulations and children-targeted products [46]. Based on current legislations, Brazil has also adopted supplementation in cases of insufficient intake of certain essential nutrients, as it is observed in other countries. Fortified corn and wheat flour (except for the whole wheat flour because of its manufacturing process) with iron and folate, salt with iodine, and margarine with vitamin A are good examples of enriched foods [4].The aim of this study is to describe the contribution of foods, classified according to the purpose and degree of processing, in the energy, nutrients and dietary fiber intake for beneficiary adolescents of the BFP in Brazil.
2. Methods
2.1. Database
- The data used refer to individual dietary intake obtained from the food consumption module of the Household Budget Survey (HBS) from 2008-2009, conducted by the Brazilian Institute of Geography and Statistics (IBGE). The sampling technique used a two- stratified conglomerate (geographical and socioeconomic) of the census sectors from the Demographic Census of 2000. It was selected by probability proportional to the number of households in the sector from each stratum. The households were defined randomly without replacement in each sector. In order to capture seasonal variations of food consumption, the strata were distributed along the 52 weeks of the year [28]. The data were collected in 13,569 households of all Brazilian states and the number of subjects at age 10-18 years was 6,938 [28].Trained interviewers from IBGE applied a questionnaire with 1,500 foods and beverages, 106 measurement units and 15 preparation modes (raw, grilled/broiled/barbecued, fried, braised, in white or red sauce, with butter/oil, stewed, in soup, baked, roasted, breaded/fried, with garlic and oil, vinaigrette and curd) [28].The individuals completed two non-consecutive food diaries on pre-determined days spanning one week, which considered food and beverage ingested inside or outside home. However, only data from the first day, which tend to be more reliable, was analysed [28].The information provided was confirmed in the following situations: a) no registration of consumption in periods greater than three hours; b) whenever fewer than five items were recorded in one day; c) data on food consumption often not included in food consumption surveys, such as candies, snacks and soft drinks; d) diet food or light; e) added sugar [48] [28].The questionnaire and the method for its application were tested previously, and the food diary model used was validated for the energy expenditure estimation by applying the double-labeled water technique. Both stages involved distinct samples that were not part of the sampling used in the survey [28]. The detailed description of the HBS method can be consulted with details in other publications [48] [28].
2.2. Food Classification
- A food classification system was elaborated to evaluate food contribution in energy, nutrients, and dietary fiber intake, according to the purpose and processing degree. The system is similar to the one suggested by Monteiro et al. [38], but it uses the presence of food additives as an additional criterion. These substances may be considered indicators of the technologies used in the food manufacturing process.- Category 1: fresh foods or subjected to minimal processing, in order to ease the conservation and consumption or prevent food borne diseases. Food additives are unusual in these foods. The category comprises fruits, vegetables, cereals, rice, vegetables, bulbs, roots, rhizomes, tubers, stalks, beans, other legumes, mushrooms, nuts, herbs, honey, meat, fish, eggs, herbal teas, infusions, coffee, and milk.- Category 2: processed foods derived from food raw material and/or fresh food, obtained by technological processes, which may contain the majority of food additives, except coloring and flavoring agents. The category consists of pasta, flour, cereal, vegetable oils, canned and processed foods of plant origin, fats of animal origin (butter, milk cream and cream), sweets, sugars and sweeteners, processed meats (e.g., blanquet turkey breast), baked products, juices and vitamins, dairy products, meals, and processed fish.- Category 3: highly processed foods obtained by extensive processes that, in general, mischaracterize the properties of their ingredients. Despite having coloring and flavoring agents in their formulation, these foods also may even contain other food additives. These functional classes – colors and flavors – act exclusively on the sensory characteristics [17] and may emphasize flavors, odors and aromas naturally found or confer new ones, which may have not be related to the chemical composition or ingredients list. Due to these characteristics, the presence of flavoring and coloring agents in the formulation, these foods were characterized as highly processed. This category includes “fantasy or artificial foods”, that is, foods processed to imitate natural foods, although they predominantly contain substances not found in the food they imitate [3]. The category comprises cookies, crackers, carbonated beverages, processed meats (for example: burgers and nuggets), sweets, chocolates, candies, chewing gum, industrialized non-carbonated beverages or powder beverages, instant noodles with sauce, dehydrated soups, dairy products, sandwiches, pizzas, and plant-origin products containing coloring and/or flavoring agents.The identification of the occurrence and the functional classes of food additives found in food products was possible by consulting packaging label information written by manufacturers or enterprises that trend these food products. This step was conducted between December 7, 2012 and February 25, 2013 in two stores from two supermarket chains in Piracicaba and São Paulo cities, both in São Paulo State, Brazil.Additional criteria were established to the classification system:- Food items from Category 1 that were grilled, served with vinaigrette and grilled or broiled were kept in this category. This criterion was based on the amount of soybean oil (Category 2 ingredient) added in these foods (less than 1% of the product final composition, required for consumption), which was considered low;- Food items from Category 1that were prepared with amounts of soybean oil, butter and flour greater than 1% in the product final composition were transferred to Category 2. It consists of fresh and minimally processed foods served sautéed, stew, fried, in red or white sauce, with garlic and oil, with butter, oil, breaded or battered;- Processed foods, whose composition of coloring and flavoring agents varies according to the manufacturer, were included in Category 3 when at least the product of one manufacturer contained these additives in the ingredient list;- Food items with generic descriptions were classified according to similar foods or products. For example, “crackers” and other generic descriptions for cookies and crackers were included in Category 3;- Descriptions that included the brand of the manufacturers, whose labels were not possible to be analyzed, were classified according to similar products;- Polished white rice, widely distributed and marketed in all Brazilian geographic regions [49], with 69.2% of domestic production coming from the State of Rio Grande do Sul [30], was included in Category 1. This classification was chosen due to the polishing, which is a relevant processing step, helps the shelf life extension, and consequently the access to the population to this cereal [46];- Food items classified in the group of “pasta” integrated Category 2 (despite the presence of coloring agents in products of some manufacturers), because the degree of processing of these food items was not considered high and no other additives were identified among the ingredients that compose these products;- Preparations were classified according to their ingredients. For that purpose, we consulted information on the ingredient list in the table of food composition table from IBGE [29]. In the absence of this type of information, specific publication research was consulted [18].
2.3. Nutrients and Dietary Fiber Intake
- The nutrient and dietary fiber contents in the foods consumed by the Brazilian population sample were obtained from the Nutritional Composition List of Foods Consumed in Brazil established by IBGE through HBS of 2008-2009 [29]. In the absence of national data, food compositions adopted are, mostly, from United States [29]. The sodium content corresponded to the sum of sodium contents in foods and added sodium, which was estimated based on data of the NDSR program [51] and considered for vegetables, leafy vegetables, legumes, roots, cereals, rhizomes, tubers, bulbs, pastas, meats, eggs, derivatives of these foods and preparations [29]. The methodology employed by the IBGE in its entirety was recorded in specific publication [29].The total content (average values) of nutrients was described and compared, primarily, with the Estimated Average Requirements (EAR) and, in the absence of these values, with Adequate intakes (AI) and accepted Upper Levels (UL) intake from the National Academy of Sciences (NAS).Regarding the macronutrients and dietary fiber, acceptable ranges for energy participation and maximum contents recommended by WHO and FAO [52] for daily consumption were adopted: 55-75% for carbohydrates, 15-30% for lipids, and 10-15% for proteins, at least 25g of dietary fiber, less than 10% saturated fatty acids, less than 1% of trans fatty acids between 6-10% of polyunsaturated fatty acids and less than 300 mg of cholesterol. In the case of recommendations expressed in the Total Energy Content (TEC), a calculation was done, in which, grams were converted using the results for the total energy consumed and the application of the values of Atwater conversion (4 kcal per gram of carbohydrates and protein and 7 kcal per gram of lipids).The nutrients obtained with supplements and medicines, as well as the mineral water content were not included in this study.
2.4. Statistical Analysis
- Weighted averages and standard deviations were calculated for the group of beneficiaries (22.4% of observations) and the groups of non-beneficiaries of the ‘Bolsa Família’ Program (BFP). For statistical analyzes, it was used the Statistical Analysis System-SAS®, version 9.3.
3. Results and Discussion
3.1. Energy Intake
- The energy intake by beneficiary adolescents of the BFP was lower than the observed for non-beneficiaries in almost all geographic regions/groups of states, except for girls from the Southern and Center-Western regions (Table 1). However, typically, and regardless of participating in social programs, low-income families have less access to food and, consequently, lower energy intake.
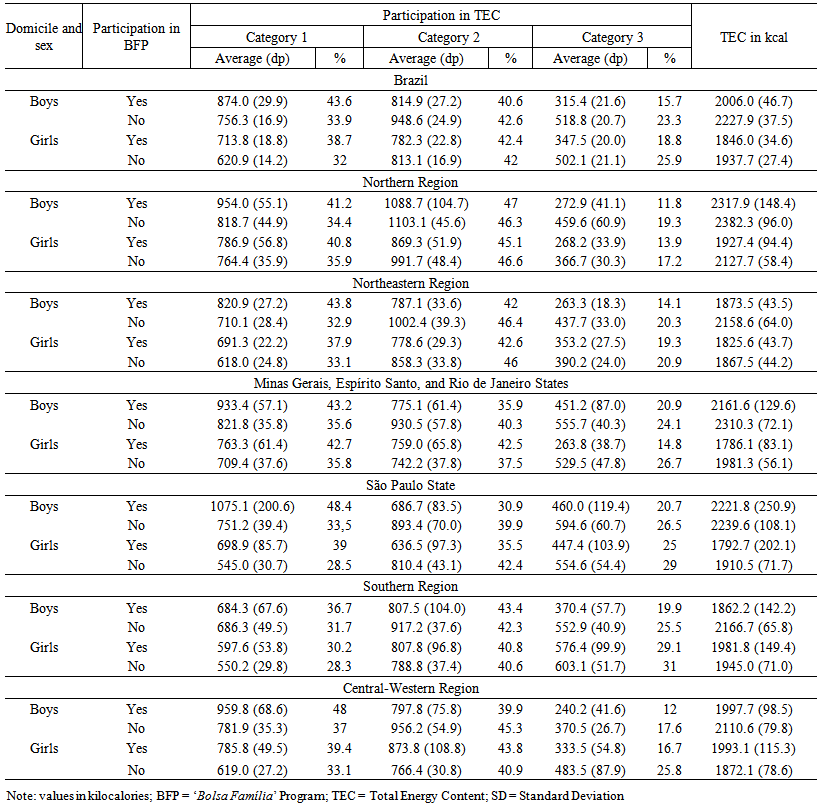 | Table 1. Intake of energy by adolescents, regarding domicile, sex and participation in the Brazilian ‘Bolsa Família’ Program (BFP). 2008-2009 |
3.2. Macronutrients and Dietary Fiber Intake
- Table 2 shows that the carbohydrate and lipid contents (average values) in foods agreed with the acceptable ranges and were slightly higher, in the case of proteins. No group showed the recommended amounts of dietary fiber or polyunsaturated fatty acids. However, there was an excessive intake of trans fatty acids was.
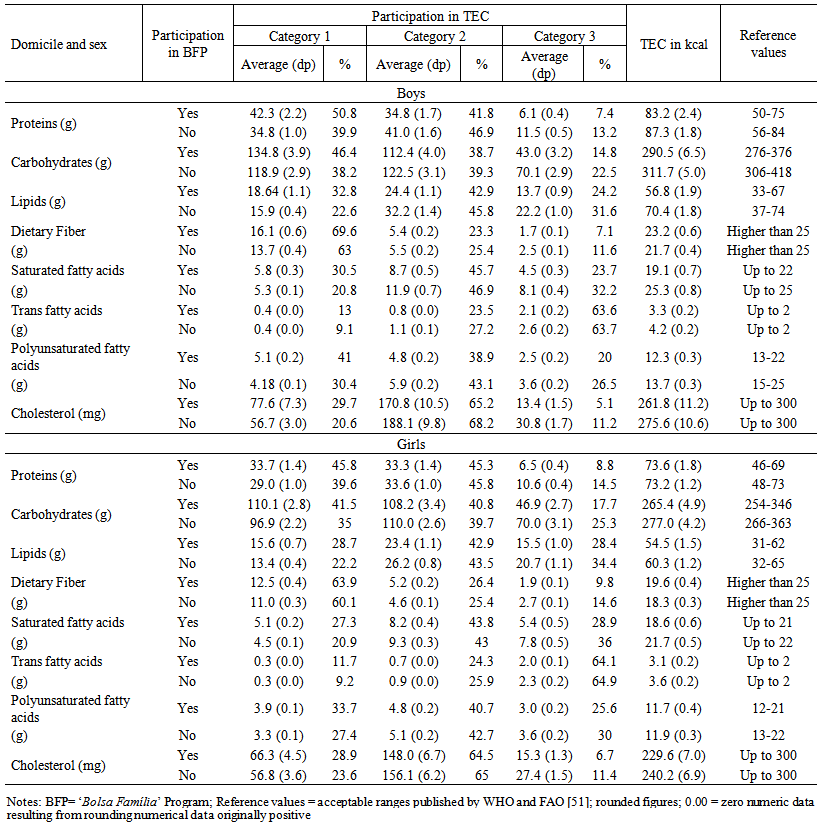 | Table 2. Intake of macronutrients and dietary fiber by adolescents, according to sex and the participation in the Brazilian ‘Bolsa Família’ Program. 2008-2009 |
3.3. Vitamins and Minerals Intake
- Tables 3 and 4 show that the average amounts of vitamins A, E, D and folate ingested (average values) by adolescents in the BFP did not comply with daily recommendations for this age group. On the other hand, non-beneficiaries showed similar needs, exceptgirls, forvitamin A intake.
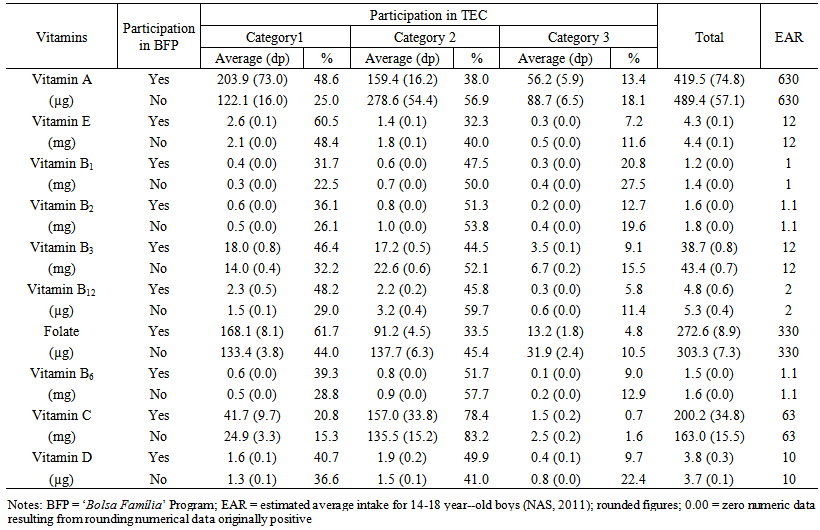 | Table 3. Vitamin intake for boys, according to their participation in the Brazilian ‘Bolsa Família’ Program. 2008-2009 |
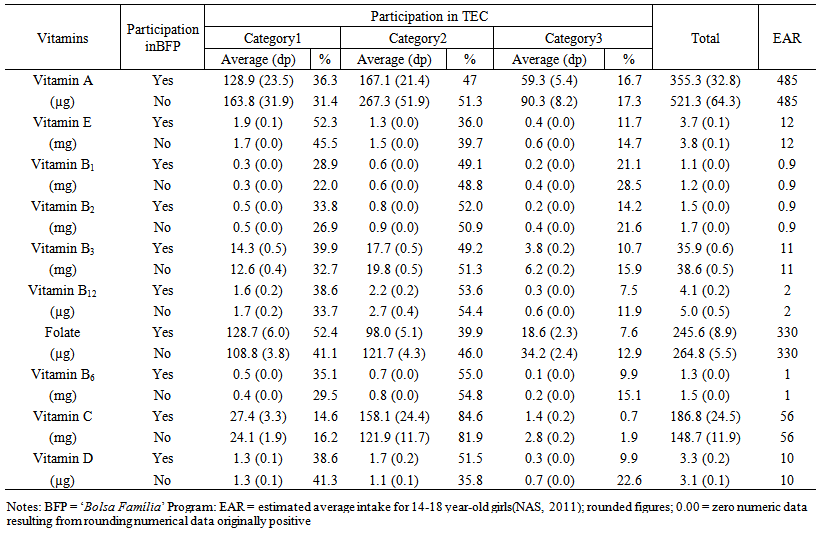 | Table 4. Vitamin intake for girls, according to their participation in the Brazilian ‘Bolsa Família’ Program. 2008-2009 |
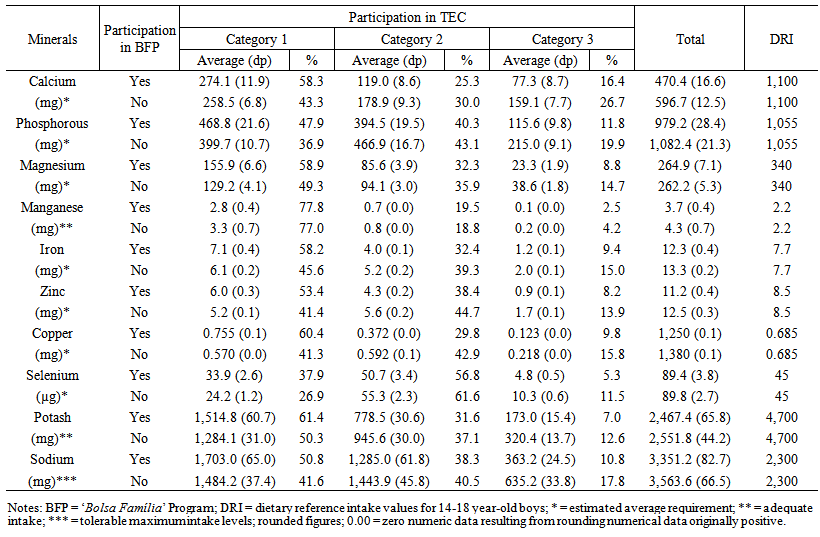 | Table 5. Minerals intake for boys, according to their participation in the Brazilian ‘Bolsa Família’ Program. 2008-2009 |
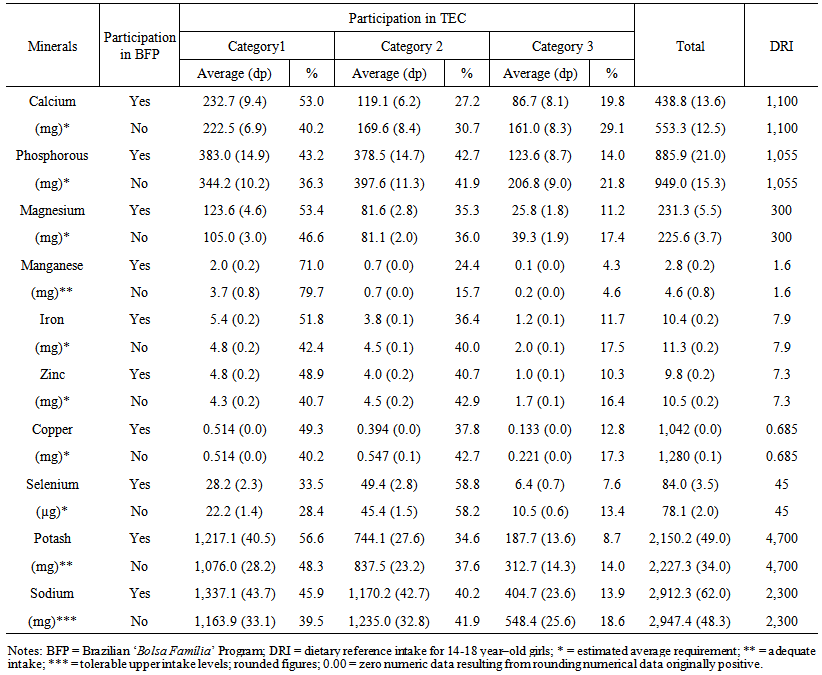 | Table 6. Minerals intake for girls, according to their participation in the Brazilian ‘Bolsa Família’ Program. 2008-2009 |
4. Conclusions
- The analysis of food consumption based on the purpose and degree of processing that foods undergo can assist in regulatory and educational actions for the industry and consumers regarding public health.Beneficiary adolescents of the ‘Bolsa Família’ Program, in general, obtain higher proportions of energy from fresh or minimally processed foods than non-beneficiaries. However, the main source of energy intake is the sum of processed and highly processed foods.Minimally processed and fresh foods are the main sources of dietary fiber, folate, vitamin E, vitamin A (only for boys) and most of the minerals (except manganese). On the other hand, processed foods are the principal sources of complex B vitamins, vitamin C and D.Highly processed foods are important sources of trans fatty acids. These products also contain considerable amounts of calcium and vitamin B1.Regarding to sodium intake, it is recommended special attention to the amount of salt added in fresh, minimally processed, and processed foods.Micronutrient sources in diets are similar for beneficiaries of BFP and other individuals. Thus, National interventions focusing on both beneficiaries and non-beneficiaries can encourage the consumption of fruits, vegetables, leafy vegetables, cereals and legumes. Hence, they can contribute to the fight against hypovitaminosis as well as preventing chronic diseases in adolescents.