-
Paper Information
- Paper Submission
-
Journal Information
- About This Journal
- Editorial Board
- Current Issue
- Archive
- Author Guidelines
- Contact Us
Food and Public Health
p-ISSN: 2162-9412 e-ISSN: 2162-8440
2014; 4(2): 54-59
doi:10.5923/j.fph.20140402.06
Top Tips on Chips: Can Local Fast Food Caterers in England Adopt Healthier Cooking Practices?
 Abstract
 Reference
 Full-Text PDF
 Full-text HTML
Al-alawy Khamis 1, Kitchen Fiona 2
1Public Health Bromley, NHS Bromley, Bromley, BR1 3UH, UK
2Environmental Health Bromley, London Borough of Bromley, BR1 3UH, UK
Correspondence to: Al-alawy Khamis , Public Health Bromley, NHS Bromley, Bromley, BR1 3UH, UK.
| Email: |  |
Copyright © 2014 Scientific & Academic Publishing. All Rights Reserved.
Obesity is now recognised as a growing Public Health epidemic. National Health Service (NHS) costs attributable to overweight and obesity are projected to reach £9.7 billion by 2050 in the UK, with wider costs to society estimated to reach £49.9 billion per year. It is now well recognised that being overweight or obese will soon be the leading cause of premature death and disease in the UK. Obesity is a key risk factor for circulatory disease, cancer and diabetes. Evidence suggests that obesity prevention interventions does raise public awareness and contribute toward the reduction of obesity. We report on an intervention to encourage the adoption of healthier cooking practices among fast food caterers in a London Borough. Our results indicate an average decrease of 52 grams (12.2%) in portion weight of chips, an average decrease in total energy per portion of 144 kcals (14%), an average decrease in total fat per portion of 7.1 grams (15%), an average decrease in total saturated fat 2.84 grams (36%) and an average decrease in salt per portion 0.35 grams (22%). We also report an improvement of caterer’s behaviour toward healthier cooking practices. Local fast-food caterers in England can adopt healthier cooking practices and may play an important role to address the obesity epidemic. The extent of what can be achieved through such intervention remains unclear and requires further investigation. The involvement of more fast food premises and sampling a wider range of fast foods will enhance the opportunity to develop healthier cooking interventions.
Keywords: Obesity, Fast Food Caterers, Healthy Cooking and Fish and Chip Shops
Cite this paper: Al-alawy Khamis , Kitchen Fiona , Top Tips on Chips: Can Local Fast Food Caterers in England Adopt Healthier Cooking Practices?, Food and Public Health, Vol. 4 No. 2, 2014, pp. 54-59. doi: 10.5923/j.fph.20140402.06.
1. Introduction
- It is now well recognised that being overweight or obese is a major public health challenge and will soon be the leading cause of premature death and disease in the UK. [1] Almost two-thirds of adults and a third of children are either overweight or obese, and work by the Government Office for Science’s Foresight programme suggests that, without clear action, these figures will rise to almost nine in ten adults and two-thirds of children by 2050. [1] This matters because being overweight or obese can have a significant impact on an individual’s health – both being associated with an increasing risk of diabetes, cancer, heart and liver disease among others. [1] Social stigma, low self-esteem and a generally poorer quality of life are common experiences for many overweight and obese people. The resulting National Health Service (NHS) costs attributable to overweight and obesity are projected to reach £9.7 billion by 2050, with wider costs to society estimated to reach £49.9 billion per year. [1] The Cabinet Office Report estimates 70,000 premature deaths (more than 10% of current annual mortality) in the UK could be avoided each year if UK diets matched nutritional guidelines. [2] The cost of diet related ill health equates to approximately six billion per annum. [2] The two year Health Profile for Bromley gives a modelled estimate of 21.8% (54,163) of those aged 16 years and above to be obese. [3, 4] Bromley is considered to be an affluent borough with pockets of deprivation with approximately 5% of the population living in the most deprived quintiles of the country [5].What Causes Obesity?Obesity develops when energy intake from food and drink consumption is greater than energy expenditure resulting in the gradual accumulation of excess fat [6].In adults, obesity is commonly defined by a Body Mass Index (BMI) of 30 or more. For children in the UK, the British 1990 growth charts are used to define weight status. [6] The causes of obesity are complex and relate to a wide variety of societal and behavioural factors. The Foresight report identified seven cross-cutting themes (figure 1) [7].a) Biology: an individuals starting point - the influence of genetics and ill health; b) Activity environment: the influence of the environment on an individual’s activity behaviour, for example a decision to cycle to work may be influenced by road safety, air pollution or provision of a cycle shelter and showers; c) Physical Activity: the type, frequency and intensity of activities an individual carries out, such as walking or cycling vigorously to work every day; d) Societal influences: the impact of society, for example the influence of the media, education, peer pressure or culture; e) Individual psychology: for example, a person’s individual psychological drive for particular foods and consumption patterns, or physical activity patterns or preferences; f) Food environment: the influence of the food environment on an individual’s food choices, for example a decision to eat more fruit and vegetables may be influenced by the availability and quality of fruit and vegetables near home; and g) Food consumption: the quality, quantity (portion sizes) and frequency (snacking patterns) of an individual’s diet.Obesity is also not equally experienced across all sections of the population. Some communities have a higher risk of becoming obese, for example: [8] ● Black Caribbean and Pakistani women are more at risk of becoming obese than the rest of the population. ● Children and young people who have at least one obese parent.● People with physical or learning difficulties.● People in lower socio-economic groups, especially women.● People who have recently stopped smoking.
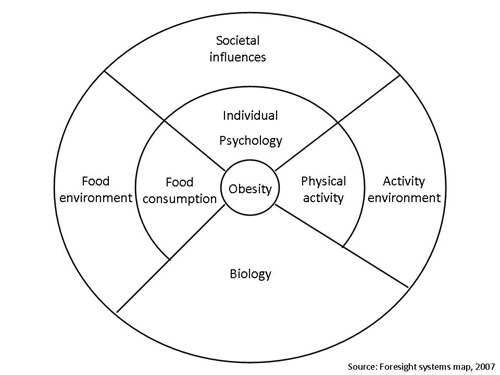 | Figure 1. Factors that influence obesity |
2. Methods
- Fifty fish and chip caterers were identified and invited to participate in the ‘Top Tips on Chips Intervention’. All caterers were offered:● Free nutritional analysis of the chips they sold (baseline) ● Free on-site advice from a nutrition specialist● Free nutritional analysis of the chips they sold post intervention● Free on-site advice from a nutrition specialist post interventionWe received interest from twelve caterers. Twelve portions of chips were purchased (11 anonymously). Eleven of the twelve portions were sold as the smallest weight advertised i.e. small or medium and one sample was advertised as large. Salt was added to all portions by the caterer at the request of the purchaser. All chip samples were sent to the Council’s appointed Nutritional Analyst. Sampling results were then sent to the Environment Health Officer (EHO). The EHO then visited all caterers and issued each caterer their bespoke results along with advice from the Food Standards Agency’s (FSA) “Tips on Chips” guidelines. All visits were ratified with written communication of their sampling results and recommendations. The EHO telephoned all caterers three months post intervention to assess progress. One caterer sold their business and therefore was excluded in the post intervention analysis. Seven caterers claimed to have improved their cooking practices and/or portion size. A follow up food sampling analysis was undertaken anonymously with eleven remaining caterers. The samples were sent for a post intervention nutritional analysis. Due to funding restrictions, four samples were only weighed. Results of the remaining seven analysis were obtained and match to their baseline data. The EHO undertook further follow-up visits with advice and follow up was also ratified in writing. One caterer had left the country and the other proved difficult to contact. Post-intervention satisfaction questionnaires were issued during the post intervention visit or posted to each caterer.
3. Results
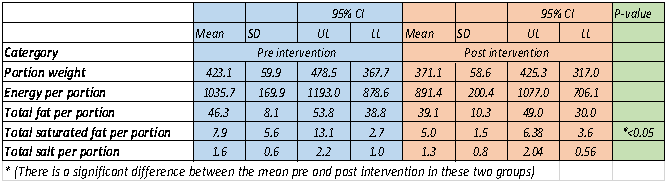
- Portion weight (grams) ○ Baseline portion sizes of 11 portions ranged from 337 g to 497 g with an average weight of 428 g. ○ Post intervention, weights of 11 samples were taken and ranged from 310 g to 662 g with an average weight of 418 g. Of 11 samples (premises) re-sampled, 5 had decreased in weight by 5% or more, 3 had increased in weight by 5% or more and 3 had changed by less than 5%. Portion control at premises 3 was poor, as the second “regular” portion was 25% larger than the first “large” portion. Results for premise 4 may have been skewed as the 1st portion was not taken anonymously. Most caterers were concerned of the impact a reduction of portion size would have on their customers, and felt that reductions should be made on a stepped approach. After the intervention, several caterers (i.e. premise 2, 3 and 4) expressed their interest to reduce portion weight and agreed to use weighing scales in the future. Caterers who had reduced portion size, reported to have not received any complaints or comments from their customers. Two caterers offered smaller portions for children. There was however; reluctance across majority of fish and chip shops to advertise smaller portions for adults due to concerns that this would have on their profit margins.○ For premise 1, 2, 5, 7, 9, 10 &11 the results appeared to be more promising with an average weight decrease of 52 grams (12.2%).The remaining results were compared across seven premises only given the availability of baseline and post intervention data for these premises (2, 5, 7, 9, 10 & 11)Total energy per portion○ Average baseline total calories across seven premises were 1035.71kcals.○ At post the intervention, we report an average of 891.43kcals (144 kcals or 14% decrease). ○ At baseline total energy represented 47% of the Guideline Daily Amount (GDA) of energy for 11-14 year olds. After the intervention this fell to 41% of GDA intake for 11-14 year olds.Total fat per portion (grams)○ Average baseline total fat per portion across seven premises were 46.29 g○ At post the intervention, we report an average of 39.14 g (7.1 g or 15% decrease). These changes are very encouraging and decreases in total fat may reflect changes in portion weight, increases in frying temperatures, increases in banging and shaking chips-claimed by all, decrease in blanching (premise 7) and change of packaging from polystyrene to paper (premise 9). Differences in draining chips in the hot box prior to sale were also noted.Total saturated fat per portion (grams)○ Average baseline total saturated fat per portion for seven premises were 7.87 g.○ At post the intervention, we report an average 5.03 g (2.84 g or 36% decrease). The largest decreases may have resulted largely from changes of oil from palm oil to groundnut oil (premise 5) and from soya oil to rapeseed oil (premise 2). Premises 5 changed oil type in four fish and chips shops in the same ownership, 3 of which were reporting to be in Bromley.Total salt per portion (grams)○ Average baseline total salt per portion for seven premises of 1.61 g.○ At post intervention, we report an average salt per portion of 1.26 g (0.35 g or 22% decrease). Most caterers claimed that they simply tried to add less from the shaker. One added water to dampen the salt inside the shaker. Some were willing to try using a shaker with fewer holes.Other Changes to Practices○ We report an increase in frying temperature between 3-10% (average % increase in frying temperature across 7 food premises was noted as 7%).○ Premise 9 changed packaging from polystyrene trays to paper trays.○ At baseline, 2 caterers advertised smaller portions (cones) of chips and many others offered smaller portions on request. After the intervention, no caterers advertised smaller portions of chips. Two premises (2 and 10), one of which was noted to be in close proximity to a secondary school sold cones of chips to children. There was reluctance to advertise smaller portions because of the possible impact on profit margins.○ Majority of premises were interested in utilising salt shakers with fewer holes. Caterer satisfactionWe received written feedback from 5 of the 11 caterers. All had enjoyed taking part in the intervention, felt their understanding of healthier frying practices had improved and were positive about implementing recommended changes. Caterers were keen to serve chips that were healthier whilst also maximise their profit margins. All expressed a desire to apply for a Healthier Catering Award, as and when the scheme was available at local level.Our intervention suggests improvements in portion weight, total energy per portion, total fat per portion, total saturated fat and total salt across seven premises at follow up (table 1).
|
4. Discussion
- The Consensus Action on Salt and Health (CASH) Survey (2010) found that many kebab shops and burger caterers in London had higher levels of salt compared to those of known fast food brands. [19, 20] The survey indicated that takeaway meals sold near schools could contain one and a half times more salt and three times more saturated fat than an adult’s maximum recommendations per day. [20] The survey highlighted the hidden risks teenagers are exposed to within the immediate vicinity of their schools. The survey also noted a high degree of variability even when the same foods were sampled. Figure 2 illustrates the CASH survey findings for the London Borough of Bromley.
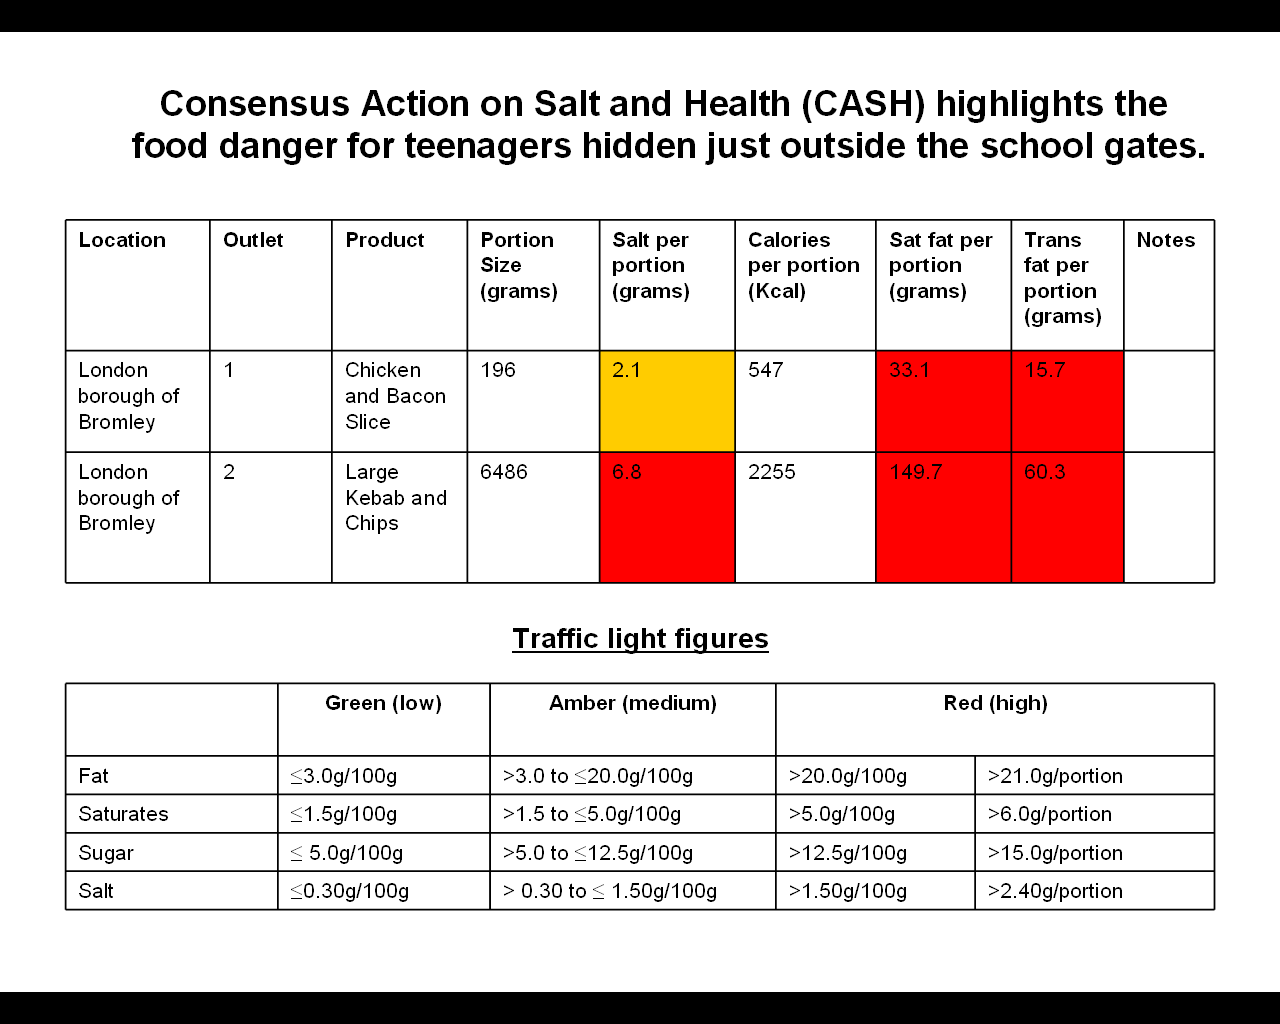 | Figure 2. CASH Survey findings for Bromley (2010) |
5. Conclusions
- Local fast-food caterers in England can adopt healthier cooking practices and may play an important role to address the obesity epidemic. The extent of what can be achieved through such intervention remains unclear and requires further investigation. The involvement of more fast food premises and sampling a wider range of fast foods will enhance the opportunity to develop healthier cooking interventions.
ACKNOWLEDGEMENTS
- We would like to thank the London Borough of Bromley and Members of the Bromley Staying Healthy Group for their support and funding for this intervention.