-
Paper Information
- Next Paper
- Previous Paper
- Paper Submission
-
Journal Information
- About This Journal
- Editorial Board
- Current Issue
- Archive
- Author Guidelines
- Contact Us
Food and Public Health
p-ISSN: 2162-9412 e-ISSN: 2162-8440
2013; 3(4): 215-222
doi:10.5923/j.fph.20130304.05
A Simplified Model to Describe the Kinetic Behavior of Supercritical Fluid Extraction from a Rice Bran Oil Byproduct
 Abstract
 Reference
 Full-Text PDF
 Full-text HTML
Susana P. Jesus1, Maurício N. Calheiros2, Haiko Hense2, M. Angela A. Meireles1
1LASEFI/DEA (Department of Food Engineering), FEA (School of Food Engineering), UNICAMP (University of Campinas), Campinas, 13083-862, Brazil
2LATESC/EQA (Chemical and Food Engineering Department), UFSC (Federal University of Santa Catarina), Florianópolis, 88040-900, Brazil
Correspondence to: M. Angela A. Meireles, LASEFI/DEA (Department of Food Engineering), FEA (School of Food Engineering), UNICAMP (University of Campinas), Campinas, 13083-862, Brazil.
| Email: |  |
Copyright © 2012 Scientific & Academic Publishing. All Rights Reserved.
The mathematical modeling of the overall extraction curve (OEC) was performed using experimental data of supercritical fluid extraction (SFE) from a byproduct of the rice bran oil (RBO) industry. The soapstock derived from the RBO deacidification process was used as raw material because it contains a significant amount of γ-oryzanol, which is a valuable natural antioxidant. The main goal of this work was to describe the OEC by a simplified model using the kinetic data obtained for the SFE from rice bran oil soapstock (RBOS). The global yield isotherms (GYI) were used to select the best operational conditions (temperature and pressure) based on the extraction yield and the γ-oryzanol content of the obtained extract. The OEC was fitted to four simplified models and the kinetic parameters which characterize the constant extraction rate (CER) were estimated. The highest values for the extraction yield (12.5 %, w/w), the γ-oryzanol content (16 %, w/w), and the γ-oryzanol recovery rate (55 %, w/w) were found at 30 MPa/333K. The proposed spline model presented the best fit to experimental data and quantitatively described the OEC. The estimated time span of the CER period (tCER) was 70 min and the corresponding solvent to feed (S/F) ratio and extraction yield were 23 and 9.4 %, respectively.
Keywords: Overall Extraction Curve, Supercritical Carbon Dioxide, Spline Model, Rice Bran Oil Soapstock, Oryzanol
Cite this paper: Susana P. Jesus, Maurício N. Calheiros, Haiko Hense, M. Angela A. Meireles, A Simplified Model to Describe the Kinetic Behavior of Supercritical Fluid Extraction from a Rice Bran Oil Byproduct, Food and Public Health, Vol. 3 No. 4, 2013, pp. 215-222. doi: 10.5923/j.fph.20130304.05.
Article Outline
1. Introduction
- Supercritical fluid extraction (SFE) is a versatile and environmentally friendly alternative to conventionalextraction processes. Carbon dioxide (CO2) is the most used supercritical fluid because it has low critical temperature (304.2 K), mild critical pressure (7.38 MPa), and important characteristics such as non-toxic, non-flammable, non - expensive, and readily available at good purity[1]. Some other well noticed advantages of the SFE are the easily solvent elimination, solvent recycling possibility, low energy consumption, adjustable solvent selectivity, and prevention of oxidation reactions[2, 3].The investigation of the SFE process requires two types of experiments: the global yield isotherms (GYI), and the overall extraction curve (OEC). The GYI are performed in different conditions of temperature (T) and pressure (P) because both parameters are directly related to the adjustable selectivity of supercritical CO2. Therefore the GYI can be used to select the operational conditions of T and P based on the extraction yield and the chemical composition of the obtained extract[4]. After this selection the OEC must be determined because it brings information about the kinetic behaviorof the SFE process. A typical OEC presents three different regions[4 – 6]: (i) a constant extraction rate (CER) period where the solute contained at the surface of the particles is removed by convection; (ii) a falling extraction rate (FER) period where convection in the fluid phase and diffusion in the solid phase are both important mechanisms; (iii) a diffusion-controlled (DC) period in which the mass transfer is controlled only by the diffusion mechanism.The mathematical modeling of the OEC allows the determination of the time of extraction (cycle time), which is important for an optimal utilization of the industrial scale plant[7]. In order to achieve this, mathematical models must be evaluated with respect to their applicability in terms of process design. Many mathematical models have been developed to describe the OEC, from simple equations to very complex ones. Meireles[5] presented a simplified model in which the OEC was described by a family of two or three straight lines, where the first line represented the CER period. According to Pereira and Meireles[8] 50 – 90 % (w/w) of the total amount of extract can be obtained at the end of the CER period, what makes this step the most important one in terms of process design. Therefore, for many industrial applications, the extraction process ends shortly after the CER period because the best operational conditions will be those in which a high amount of extract is obtained in a relatively short process time[8]. The previous affirmation justifies why it is usual and important to determine some kinetic parameters which characterize the CER region of the OEC.Researchers and consumers’ interest in the rice bran oil (RBO) have been increasing due to its great potential as a nutraceutical food. The RBO health benefits are usually associated with natural antioxidant components such as tocopherols, tocotrienols and γ-oryzanol[9, 10]. Attention is usually focused on γ-oryzanol (a group of ferulic acid esters of sterols and triterpene alcohols) since it has a powerful antioxidant action[11]. Improvement of the plasma lipid pattern, hypocholesterolemic activity, and treatment of inflammatory processes are some of the health-promoting effects attributed to γ-oryzanol[10, 12]. The antioxidant action has also been associated with the prevention of some cancers[13, 14].In traditional chemical refining the deacidification is a process step in which the free fat acids are neutralized by addition of an alkali reagent, resulting in neutral oil plus soapstock as a byproduct. The γ-oryzanol content in the crude RBO varies in the range of 1.5 – 2.9 % (w/w)[15]. During deacidification step, however, there is a significant decrease (up to 90 %) in the RBO γ-oryzanol content because it is transferred to the rice bran oil soapstock (RBOS)[10, 16].According to Paucar-Menacho et al.[15] the typical RBOS contains 1.2 – 3.6 % (w/w, dry basis) of γ-oryzanol. The RBOS has been mostly used to produce soap by detergent industries. Nevertheless, this byproduct has a remarkable potential of being financially profitable since it could be used as a raw material for γ-oryzanol recovering processes[17]. The valuable antioxidant activity presented by γ-oryzanol makes it an interesting substance for wide application by food, cosmetic, and pharmaceutical industries. Research works reporting the SFE from rice bran using supercritical CO2 as solvent have already been published, including comparisons between SFE and conventional hexane extraction as well as investigations to optimize the γ-oryzanol content in extracted oil[18 – 21]. There are also reports about the application of conventional extraction techniques for recovering the γ-oryzanol available in the RBOS[22, 23]. However, as far as we know, there are yet no reports about the use of the RBOS as raw material for the supercritical CO2 extraction. The main goal of this work was to investigate the mathematical modeling of the OEC applying simplified models, as well as the determination of the kinetic parameters from the CER period. For that, we used experimental new data about the SFE using the RBOS as raw material. The GYI were evaluated in order to select the operational conditions (T and P) which maximize the γ-oryzanol recovery in the obtained extracts.
2. Materials and Methods
- The experimental assays were performed in the Laboratory of Thermodynamics and Supercritical Technology (LATESC, EQA, UFSC, Florianópolis, Brazil). The details about the applied experimental methodology have been described in the sections 2.1 to 2.4.
2.1. Characterization of the Raw Material
- The raw material was a RBOS obtained from IRGOVEL Ltd. (Pelotas, RS, Brazil). The RBOS initial moisture content was determined gravimetrically using a drying oven at 378 K[24]. The γ-oryzanol content (OC) was quantified by high-performance liquid chromatography with UV detection (HPLC-UV), as detailed in section 2.4.
2.2. Pretreatment of the Raw Material
- The RBOS pretreatment included three sequential steps: saponification, drying, and crushing. The first step was a saponification reaction, which was based on the methodology proposed by Rao and co-workers[25]. The RBOS saponification was carried out using sodium hydroxide (NaOH) at controlled temperature (363 K) and constant stirring over a period of 1 hour. The proportion of reagents was 1:20 relating NaOH amount to RBOS dried matter content. The excess alkali was neutralized by sodium bicarbonate addition in order to adjust the pH between 9 and 10, which is the optimum pH range for γ-oryzanol extraction from the RBOS[26].The resultant soap was allowed to air-dry for 2 hours at room temperature. Then the soap was dried in an oven at 388 K for 4 hours. The dried soap was crushed and particles were fractionated in a vibratory sieve shaker (Bertel Metallurgic Ind. Ltd., SP, Brazil). The obtained solid particles were used as the feed material for the SFE experiments.
2.3. Supercritical Fluid Extraction
- The SFE equipment was a dynamic extraction unit developed by Zetzl and co-workers[27] at the TechnischeUniversität Hamburg-Harburg (Germany). The details about the unit design as well as the experimental procedures have already been well described in previous works[28, 29]. The extraction solvent was CO2 99.9 % pure delivered at pressure up to 6 MPa (White Martins, Brazil). The extract was collected in the separator which was an amber glass vial immersed in an ice bath at ambient pressure.In the GYI assays the operational conditions of pressure and temperature varied according to a 32 factorial design. The levels were: 10, 20, and 30 MPa and 303, 318, and 333 K. The mass of feed material (F), the total extraction time, the CO2 flow rate (QCO2), and the solvent to feed (S/F) ratio were: 30 g, 240 min, 1.67×10⁻⁴ kg/s, and S/F=80, respectively. The assays were all performed in duplicates. In the kinetic experiments the extracted mass was collected and quantified in predetermined time intervals and the accumulated mass of extract was plotted as a function of the extraction time (t) to generate the OEC. The kinetic assays were performed using the following operational conditions: F = 30 g, QCO2 = 1.67×10⁻⁴ kg/s, P = 30 MPa, and T = 333 K.
2.4. Determination of the γ-Oryzanol Content
- The γ-oryzanol quantification was performed by HPLC/UV according to Scavariello[30]. The analysis system was composed by: isocratic pump (Perkin Elmer Series 200); ultraviolet (UV)/visible detector (Perkin Elmer LC 290); column (Thermo Electron Corporation LICHROSORB RP 18; 4.6 × 250 mm, 5 mm coupled to a C18-5 pre-column). The UV detector was set at 315 nm and the mobile phase was composed by acetonitrile/methanol/isopropanol (50:45:5 by vol.) at a flow rate of 1.0 mL/min. The samples were diluted in hexane and a volume of 20 μL was injected into the system.
2.5. Calculation of the Extraction Yield and the γ-Oryzanol Recovery Rate
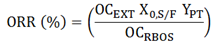
- The extraction yield (X0,S/F) of the GYI assays (S/F = 80) was calculated by the ratio between the mass of extracted matter and the mass of feed material (wet basis) used to fill the extraction cell. The γ-oryzanol recovery rate (ORR) was obtained by the ratio between the mass of γ-oryzanol in the extract and the mass of γ-oryzanol originally present in the raw material (RBOS) which was treated to produce the SFE feed material (according to the pretreatment described in section 2.2). Thus the ORR was calculated by Equation 1 using experimental data obtained for: X0,S/F (%, w/w), γ-oryzanol content in the extract (OCEXT) (%, w/w), γ-oryzanol content in the RBOS (OCRBOS) (%, w/w), and pretreatment yield (YPT) (w/w). The pretreatment yield was defined as the ratio between the final mass of solid particles and the initial mass of crude raw material.
 | (1) |
2.6. Mathematical Modeling
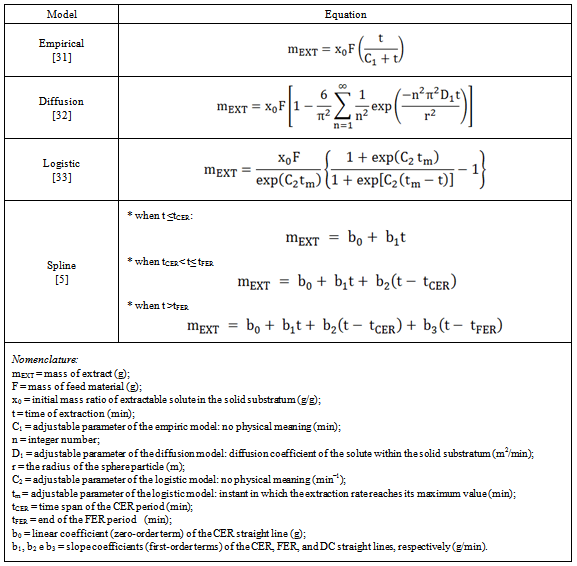
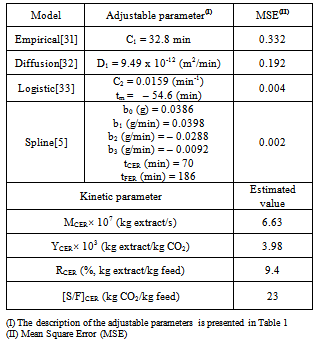
- The extraction curve was obtained by plotting the accumulated mass of extract (or extraction yield) versus the extraction time. The OEC mathematical modeling was evaluated using the following models: empirical model presented by Esquívelet al.[31], diffusion model of Crank[32], logistic model presented by Martínez et al.[33], and spline model described by Meireles[5].The empirical, diffusionand logistic models were fitted to experimental data using the software Mass Transfer (LATESC/EQA/UFSC, Florianópolis, Brazil)[34]. This software was developed in Delphi 7.0 using the maximum likelihood method to minimize the sum of the squares of the residues. The spline modeling was performed by fitting the experimental OEC to a spline containing three straight lines using the procedures PROC REG and PROC NLIN of the SAS software package (version 9.0, SAS Institute Inc., Cary, USA).The adjustable parameters as well as the equations used in the mathematical modeling are detailed in Table 1.
|
2.7. Estimation of the Kinetic Parameters
- The experimental OEC was described by a family of three straight lines using a nonlinear fitting performed in the software SAS (as described in the section 2.6). The fitted lines were associated with three different mass transfer mechanisms following the classic descriptions of the CER, FER and DC periods[6]. Thus the first, second, and third lines were respectively identified as the CER, FER, and DC regions. From the spline model the following parameters for the CER period were estimated: the time span of the CER period (tCER), the extraction rate for the CER period (MCER), the mass ratio of extract in the supercritical phase at the bed outlet (YCER), the extraction yield of the CER period (RCER), and the solvent to feed mass ratio of the CER period (S/FCER). The tCER and MCER (kg extract/s) are both adjustable parameters from the spline model (tCER and b1, respectively, according to Table 1). The YCER (kg extract/kg CO2) was obtained by dividing MCER by the mean solvent flow rate (QCO2, kg CO2/s). The parameters RCER (%, kg extract/kg feed material) and S/FCER (kg CO2/kg feed material) were calculated using modeled data (mEXT) from spline model.
2.8. Statistical Analysis
- The statistical analysis of the experimental data was performed through a one-way Analysis of Variance (ANOVA) and Tukey test using the software STATISTICA for Windows (version 7.0, Statsoft Inc., USA). A calculated p-value< 0.05 was considered to be statistically significant.
3. Resu lts and Discussion
3.1. Characterization of the Raw Material
- The RBOS characterization analyses resulted in a moisture content of 45 ± 1 % (w/w) and a γ-oryzanol content of 2.7 ± 0.1 % (w/w, dry basis). The determined RBOS moisture content is lower than the ones reported by Narayan et al.[17] (65 – 70 %, w/w) and by Kaewboonnum et al.[22] (57 %, w/w). Such differences in the moisture content are understandable since the RBOS composition depends on operational parameters of the RBO refining process, which usually differ from one industry to another. Some variations in the deacidification step, such as centrifugation time and amount of water and alkali added in the process, as well as rice bran initial composition, have direct influence on the RBOS composition. The obtained γ-oryzanol content (2.7 ± 0.1 %, w/w, dry basis) is in accordance with the range (1.2 – 3.6 %, w/w, dry basis) reported by Paucar-Menacho et al.[15].
3.2. Pretreatment of the Raw Material
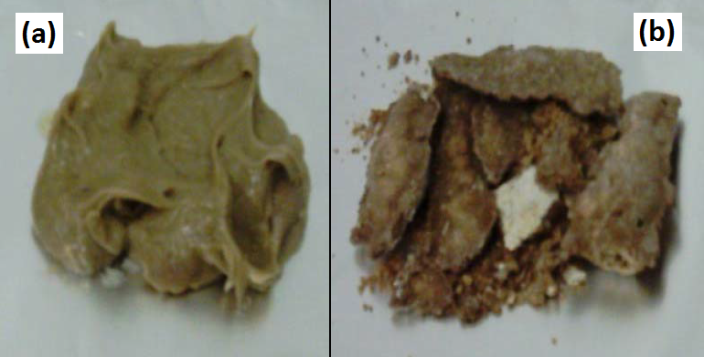 | Figure 1. Raw material pretreatment: (a) crude rice bran oil soapstock (RBOS); (b) RBOS after saponification and drying steps |
3.3. Extraction Yield, γ-Oryzanol Content, and γ-Oryzanol Recovery Rate
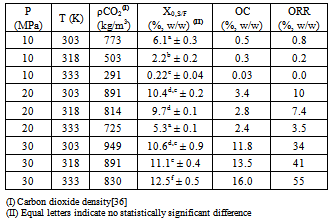
- The interactions between the solvent and the various solutes present in the solid substratum are fundamental to understand the SFE process. However, the solid substratum is a complex multicomponent system and very little information is known about these interactions. The extension of these interactions can be measured through the determination of the solubility of the system (solid substratum + CO2) or through the results of the GYI experiments[35].The results of the GYI assays are presented (Table 2) in terms of extraction yield, γ-oryzanol content and γ-oryzanol recovery rate. Taking into account an isothermal condition a rising operational pressure resulted in the increase of both the extraction yield and the γ-oryzanol content. This effect can be attributed to the increase in CO2 density and therefore the enhancement in the solvation power.
|
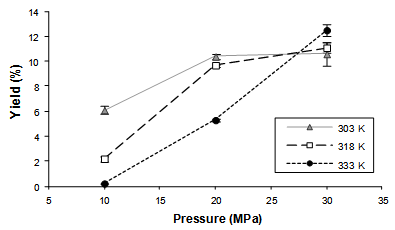 | Figure 2. Global yield isotherms (303, 318, and 333 K) obtained in the SFE process (the experimental points are connected to evidence the isotherms crossover) |
3.4. Mathematical Modeling and Kinetic Parameters
- The experimental and modeled curves are illustrated in Figure 3. The adjustable parameters and the mean square error (MSE) calculated for the applied models are presented in Table 3.The analysis of the lowest MSE values, as well as the visual observation of Figure 3, indicated that both the spline[5] and logistic[33] models could quantitatively describe the OEC. The distribution of the residuals (Figure 4) confirmed the good fits presented by spline and logistic models.
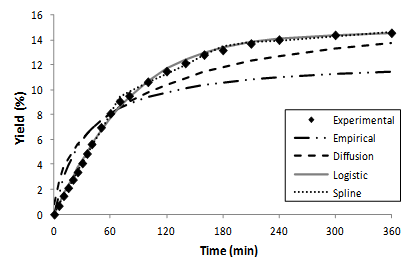 | Figure 3. Experimental data (30 MPa/333 K) and modeled extraction curves obtained by empirical[31], diffusion[32], logistic[33], and spline[5] models |
|
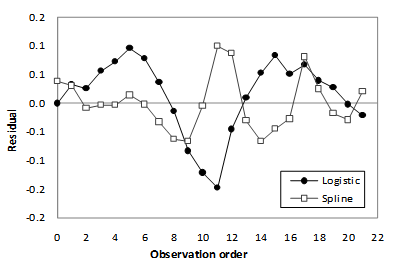 | Figure 4. The distribution of the residuals obtained from mathematical modeling using logistic[33] and spline[5] models |
4. Conclusions
- The high γ-oryzanol content (2.7 %, w/w, dry basis) detected in the RBOS confirmed its potential as a raw material for γ-oryzanol recovering processes. The analysis of the GYI results (Table 2) indicated that the best operational condition was found at 30 MPa/333 K. The spline model presented the best fit to the OEC and the values calculated for the parameters tCER and tFER were, respectively, 70 and 186 min. At the end of the CER and FER periods the extracted mass was 64 % and 93 % of the total mass obtained at the final time of extraction.The spline model presents a very low mathematical complexity, and despite that can describe very well the OEC when only kinetic data about the investigated system are readily available.
ACKNOWLEDGEMENTS
- The authors thank CNPq (477986/2007-2) for the financial support of the experimental work and IRGOVEL Ltd. (Pelotas, RS, Brazil)for the donation of the raw material. Susana P. Jesus thanks CNPq (141828/2010-2) for the doctorate fellowship.