-
Paper Information
- Paper Submission
-
Journal Information
- About This Journal
- Editorial Board
- Current Issue
- Archive
- Author Guidelines
- Contact Us
Food and Public Health
p-ISSN: 2162-9412 e-ISSN: 2162-8440
2013; 3(3): 154-160
doi:10.5923/j.fph.20130303.07
Copper, Cobalt and Chromium in Meat, Liver, Tallow and Bone Marrow from Semi-domesticated Reindeer (Rangifer tarandus tarandus L.) in Northern Norway
 Abstract
 Reference
 Full-Text PDF
 Full-text HTML
Ammar Ali Hassan1, Charlotta Rylander2, Torkjel M. Sandanger2, Magritt Brustad1
1Centre for Sami Health Research, Department of Community Medicine, Faculty of Health Sciences, University of Tromsø,
2N-9037 Tromsø, Norway
Correspondence to: Ammar Ali Hassan, Centre for Sami Health Research, Department of Community Medicine, Faculty of Health Sciences, University of Tromsø,.
| Email: |  |
Copyright © 2012 Scientific & Academic Publishing. All Rights Reserved.
Copper (Cu), cobalt (Co) and chromium (Cr) concentrations were studied in meat (n=29), liver (n=29), tallow (n= 15) and bone marrow (n=9) collected from semi-domesticated reindeer (Rangifer tarandustarandus L.) in Northern Norway.Liver displayed the highest Cu and Co concentrations (10548.3 and 13.2µg/100g ww, respectively), whereas Cr was highest in tallow and bone marrow (7.8and 8.7µg/100g ww, respectively). Significant differences (p< 0.01) were found for Cu concentrations between meat and liver (137.3 and10548.3µg/100g ww, respectively), and tallow and bone marrow (65.9 and 21.6 µg/100g ww, respectively). Furthermore, Co concentrations were significantly (p<0.01) different between meat and liver (0.6 and 13.2µg/100g ww, respectively). Concentrations of Cu, Cr and Co were measured for the first time in tallow and bone marrow from reindeer.Cr concentrations were comparable in tallow and bone marrow. No significant correlations were observed in concentrations of the studied elements within the specific tissue and among the four studied tissues. The risk analysisconducted on Cu concentrations from reindeer liver revealed an intake that was well below the daily safe intake set by WHO/FAO.
Keywords: Copper, Cobalt, Chromium, Arctic Food, Risk Analysis, Reindeer, Sami
Cite this paper: Ammar Ali Hassan, Charlotta Rylander, Torkjel M. Sandanger, Magritt Brustad, Copper, Cobalt and Chromium in Meat, Liver, Tallow and Bone Marrow from Semi-domesticated Reindeer (Rangifer tarandus tarandus L.) in Northern Norway, Food and Public Health, Vol. 3 No. 3, 2013, pp. 154-160. doi: 10.5923/j.fph.20130303.07.
Article Outline
1. Introduction
- Semi-domesticated reindeer (Rangifer tarandustarandus L.)is a fundamentalcultural element in the life ofthe indigenous Sami people in the Fennoscandia. The Sami traditional diet isnot only characterized by consumption of meat from reindeer, but also many other reindeer products such as liver, tallow and bone marrow. The production of reindeer meat and products are mainly locally consumed with the highest consumption among families of reindeer herders[1]. The increasing numberof slaughtered reindeer in Norway during the last 10 years is a clear indication of an increasing consumption and popularity among the ethnic Norwegians, particularly those who live in mid- and northern Norway[2]. The existing data on reindeer as human foodcould clearly document the nutritive value of reindeer meat and liver when compared to similar sources from domestic animals[3-10].Cu is the most studied element in reindeer, particularly in liver and kidneys[11-15]. Data on Co and Cr in tallow and bone marrow from reindeer are completely lacking. The previous studies on the three above mentioned elements in reindeer revealed varied concentrationsand general agreement on the abundance of Cu in reindeer liver which was in most cases higher than those measured in various animalspecies from the same areas (e.g., sheep, moose, red deer) [11, 12, 14-16].Copper (Cu), cobalt (Co) and chromium (Cr) are important essential elements for humans and animals, although excessive intakes have long been associated with toxicity in both species[17]. Cu is a component of enzymes in iron metabolism and deficiency of this element causes anaemia[17]. Co is a major constituent of vitamin B12 and an essential element in the synthesis of this vitamin by bacterial fermentation in ruminant animals[17, 18]. Thus, deficiency of Co causes deficiency of vitamin B12 and hence macrocytic anaemia. Cr helps to maintain normal blood glucose level and is widely used in diabetes medications[19]. Human toxicity of Cu, Co and Cr occurs in both acute and chronic forms in cases of excessive intakes[20-22]. Acute Cu toxicity signs are nausea, vomiting, jaundice and liver necrosis, damage to the proximal tubules of the kidney and haemolytic anaemia[20]. Wilson’s disease in human is a form of chronic Cu toxicity with clinical signs including mental alterations, motor abnormalities, dysphagia, ataxia, haemolytic anaemia, renal dysfunction, renal stones and hepatic failure[20]. Excessive intake of Co in humans reduces thyroid activity and causes goitre due to inhibition of iodination of tyrosine[21]. Cr toxicity is normally due to physical contact with contaminated dust or soil resulting in allergic dermatitis characterized by eczema[22].Recommended dietary allowance (RDA), adequate intake (AI) and tolerable upper intake level (UL)for humans are relevant scientific terms for evaluation of the daily dietary intake of essential nutrients such as Cu, Co and Cr. The RDA is the average daily level of intake sufficient to meet the nutrient requirements of nearly all healthy individuals[23]. The AI is a level assumed to ensure nutritional adequacy and is established when evidence is insufficient to develop a RDA[24]. The UL is the maximum daily intake that is unlikely to cause adverse health effectsfor humans[24].This paper is a part of a bigger project on reindeer as human food and was meant to addnutritional data to what are limited per today, particularly concentration of nutrients in liver, tallow and bone marrow. The main purpose was to study concentrations and differences of Cu, Co and Cr in meat, liver, tallow and bone marrow from semi-domesticated reindeer, and possible element correlationswithin the specific tissue (intra-correlation) and among the four studied tissues (inter-correlation).Additionally, a risk assessment wasconducted in cases where concentrations of the studied elements exceed the tolerable upper intake levels (UL).
2. Sampling and Analysis
2.1. Sample Collection
- Meat (n= 29), liver (n=29), tallow (n=15) and bone marrow (n= 9) samples from semi-domesticated reindeer (Rangifer tarandustarandus L.) were collected from seven districts distributed over two counties (Finnmark and Nordland) in Northern Norway. The samples were collected from September 2004 to January 2005 and the laboratory analyses were performed the same year of sample collection. Meat samples were collected from muscles of the dorsal neck, liverfrom the main loop, tallow from the fat tissues around kidneys and bone marrow from the front and hid legs from the same animals.All samples were collected immediately after slaughter/dressing process. Samples were put on ice (4˚C) and kept frozen at (-20˚C) until analysis.Samples were collected from young animals (1.5 year). However, a limited number of calves (approximately 6-10 months, n=6) and older animals (> 2 years, n= 3) were selected due to scarcity of young animals. Age of the reindeer was obtained directly from the tags attached to the animals’ carcasses when they passed the weighing post in the slaughterhouses. Samples were collected from animals thatwere healthy and had passed the veterinary meat inspection.
2.2. Chemical Analysis
- The samples were separately decomposed using a microwave oven (Ethos Plus, Milestone Inc., Shelton, CT, USA) and concentrated supra-pure HNO3 (5 ml) and H2O2 (3 ml) were added to the sample (0.6 – 0.7 g) before undergoing the microwave oven treatment. Hence, the following temperature regimes were subsequently used in the microwave oven: 20-50°C (5 min.), 50-100°C (10 min), 100-180°C (5 min.) and 180°C (15 min.). After cooling, the solution was diluted to 50 ml. The sample solution was analysed using an inductively coupled plasma high resolution mass spectrometer (ICP-HRMS), Element 2, Thermo Finnigan, Bremen, Germany. All standards and calibration solutions contained 1 ppb Rhenium (Re) as the internal standard, together with 1% nitric acid (HNO3). The calibration curve was verified by standard quality control (QC) sample (Spex Standard, Ultra Scientific, North Kingston, USA) in compliance with ANSI/NCSLZ-540-1 and ISO 90001. The QC material SRM-1566a (Oyster tissue) was obtained from the National Institute of Standards and Technology (NIST), Maryland, USA. The analyses were done by the NILU (Norwegian Institute for Air Research) Laboratory, Kjeller, Norway. The laboratory is accredited for the methods used in the analyses according to NS-EN ISO/IEC 17025, No. TEST008. The limits of detection (LODs) for the studied essential elements were three times standard deviation (SD) of the laboratory blanks, whereas the limits of quantifications (LOQs) were 10 times the SD of the blanks, decomposed simultaneously with the samples.
2.3. Statistical Analysis
- STATA/SE 12.0 for Windows (STATA Corp. College Station, TX, USA) was used for statistical analyses. The results were presented as median and range (min. – max.). Laboratory results for elements below the limit of detection (LOD) were given a numeric value at half the detection limit (LOD/2) according to statistical practice of non-detects data[25]. Samples with detection percentage less than 50% were not included in statistical analysis. Some of the element concentrations were positively skewed (skewed to the right) and log transformation of data did not remove the skewness. Therefore the nonparametric Wilcoxon matched-pairs signed-rank test was used to test for significant differences in element concentrations between meat-liver and tallow-bone marrow. A Spearman’s rank correlation test (Spearman’s rs) was used for determining significant correlation coefficients of elements within the specific tissue and among the different tissues. The significance levels of correlations were Bonferroni-adjusted for pair-wise comparisons. The level of statistical significance was set at p<0.05 in all performed analyses.
2.4. Risk Analysis of Reindeer Consumption
- Estimation of reindeer intake is necessary for evaluation of the risk associated with possible high element concentrationsfor consumers. Data from a food frequency questionnaire fromThe SAMINOR Study was used to estimate reindeer intake. The SAMINOR Study is a population based studyon health and living conditions in areaswith a mixed Sami and Norwegian population carried out during 2003-2004. The study covered the population in all municipalities in Norway where more than 5% of the population reported to be Sami in the 1970 census, with approximately, 16000 participants[26, 27]. The mean consumption frequency of once a month or more was usedto determine high intake (9 g/ day)among the studied population, with reference to liver as the main accumulation tissue for such elements. The proportion of the population with high liver intake was about 2% (total n= 12899).This estimation was then used to determine element exposure on the basis of daily human reindeer liver intake within this population. This was then compared tothe recommended daily safe intakeas set by Food and Agriculture Organization (FAO) and World Health Organization, WHO[28].The estimated daily human Cuintakefrom reindeer liver (EDHI) was calculated according to the following formula:EDHI (mg/kg human body weight/ day) = I x T/ S.Where: (I) is the mount of estimated daily liver intake in gram, (T) is element concentration in the liver givenin mg/100g, and (S) is the standard human body weight equal to 60 kg.
3. Results and Discussion
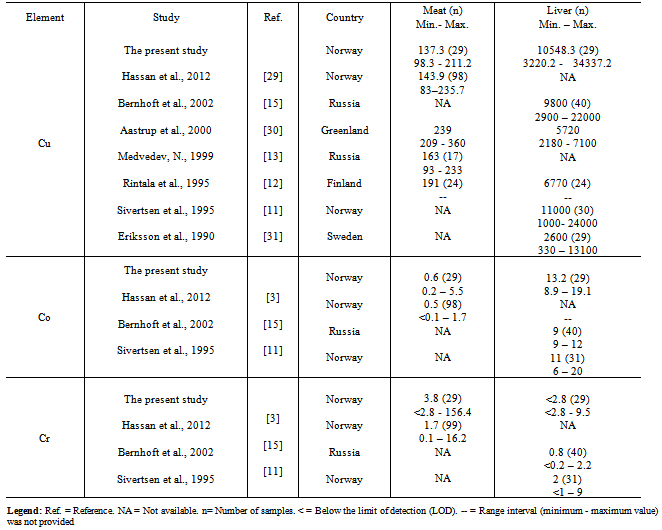
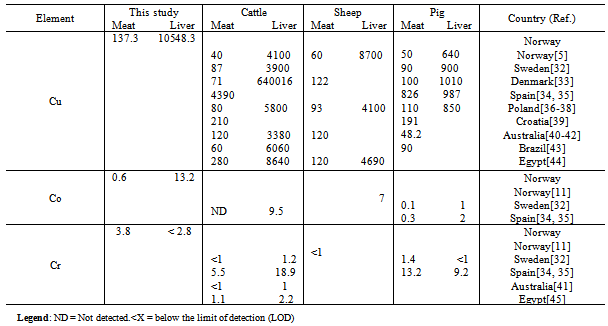
- Concentrations of the Cu, Co and Cr are provided in Table 1.As expected, liver displayed the highest Cu and Co concentrations among the four studied tissues, whereas concentrations of Cr were below the limit of detection (LOD) in 55% of the liver samples (total n= 29). Liver samples had significantly higher concentrations of Cu and Co compared to meat samples. To the best of our knowledge, this is the first study presenting concentrations of Cu, Co and Cr in tallow and bone marrow from reindeer (Table 1). The concentration of Cu in tallow was significantly higher than in bone marrow.No significant correlations were observed in concentrations of Cu, Co and Cr within the specific tissue (intra-correlation) and among the four studied tissues (inter-correlation). Concentrations of Cr were comparable in tallow and bone marrow.Comparison of Cu, Co and Cr concentrations in meat and liver in this studywithprevious studies reported in reindeer, cattle, sheep and pig were presented in Tables 2 and 3.No data were available for Cu, Co and Cr comparison in tallow and bone marrow.
3.1. Copper (Cu)
- Copper was detected in all samples with the highest median concentration found in liver (10548.3µg/100 g ww)followed by meat (137.3µg/100 g ww), tallow (65.9µg/100 g ww)and bone marrow(21.6µg/100 g ww). Cu concentrations were significantly different between meat and liver, and tallow and bone marrow. Cu has most often beenstudied in meat/ liver from reindeer and domestic animals compared to Co and Cr (Tables 2 and 3). Cu concentration in meat from reindeer measured in this study was three times higher than that of Norwegian beef and could be compared to that of Danish mutton and those of Australian beef and mutton (Table 3). Median liver concentration of Cu detected in this study (10548.3µg/100 g ww) was higher than those previously reported in Norwegian moose liver (4800, 5700 and 8700 µg/ 100 g ww), and that in liver from wild red deer (2600 µg/ 100 g ww)[11, 46].Furthermore, liver from reindeer contained considerably higher Cu concentration compared to liver from domestic animals (Table 3). Meat from reindeer in the present study displayed Cu concentration of 137.3 µg/ 100 g that was comparable to those formerly reported in Australian beef and mutton, and Danish mutton as presented in Table 3[33, 40, 41].
|

|
|
- A wide range interval was observed for Cu concentration in liver (3220.2 - 34337.2µg/100 g ww). Cu accumulates mainly in liver and therefore geographical variations are more likelyto be revealed in this organ compared to other animal tissues[17]. Hence, the wide range could be due to geographical variations as samples were collected from 7 different grazing districts distributed over two Norwegian counties. Such a wide range in hepatic Cu concentration has previously been observed in liver from Norwegian and Russian reindeer[11, 15].
3.2. Cobalt (Co)
- Cobalt was detected in all fourtissue samples with the highest concentrations found in liver (Table 1). Significant differences were found in concentrations of Co between meat and liver, and tallow and bonemarrow. No significant differences were found for Co between tallow and bone marrow. Cobalt concentration was considerably higher in liver compared to those measured in meat, tallow and bone marrow. Liver was described as the main store for vitamin B12 in ruminant animals’ body and most of the Co is found as vitamin B12 of which Co is a major constituent[18, 47]. Furthermore, Co concentration in reindeer liver revealed in this study was considerably higher than those reported in liver from sheep and pig, and comparable to those reported in liver from wild Norwegian red deer and moose[11, 32, 35, 46]. Co concentration in reindeer liver from this study(13.2 µg/100 g ww)was found close to that revealed in liver from Spanish cattle(9.5 µg/100 g ww), Table 3.Neither recommended dietary allowance (RDA) nor daily upper intake level (UL) are establishedfor Co [23, 24]. However, Co is often mentioned whenever vitamin B12 is mentioned in literature and an adequate dietary intake of vitamin B12 may possibly indicate an adequate intake of Co[17, 18]. Co is an integral part of vitamin B12 and an essential element in the bacterial synthesis of this vitamin by ruminant animals such as reindeer, cattle and sheep[18].
3.3. Chromium (Cr)
- Chromium was detected in 62% of meat, 45% of liver, 93% of tallow and 78% of bone marrow samples (limit of detection 2.8µg/100 g ww). Tallow and bone marrow displayedthe highest Cr concentrations (Table.1). Moreover, Cr concentrations did not significantly correlate with any of the studied elements. Cr concentration in reindeer meat from this study (3.8 µg/100 g ww) was found close to that measured in Spanish beef (5.5 µg/ 100 g ww), Table 3.Cr concentrations varied in meat (< 2.8 - 156.4µg/100 g ww) and bone marrow (<2.8 -184.7) µg/100 g ww. The wide range interval in Cr concentration from reindeer meat in the present study stood in contradiction toresult from previous study (n= 99) by the same authors in which a range interval of 0.1-16.2 µg/100 g ww was measured[3]. A plausible explanation for the observed wide Cr range in meat and bone marrow could possibly be due to presence of three extreme values. One animal had a meat Cr concentration of 156.4 µg/100 g ww, whereas the next-higheCr concentration measured in meat was 12 µg/100 g ww. Additionally, two different animals had bone marrow Cr concentrations of 162.8 and 184.7 µg/100 g ww whereas the next-highest Cr measured from bone marrow was 34.8 µg/ 100 g ww. The three abovementioned Cr concentrations revealedin meat and bone marrow stood at a large distance from the next-highest concentrations. These extreme values were not removed from our dataset as the results were expressed as median values and non-parametric methods were used for comparisons[48].There is no established RDA or UL for Cr[23, 24]. However, daily adequate intakes (AI) of 25 µg for adult female and 35 µg for male were established by the Food and Nutrition Board (FNB) at the Institute of Medicine (IOM) of the National Academies[24].
3.4. Risk Analysis of Cu Intake from Reindeer Liver
- Risk assessment is an important step in the risk analysis and is defined as the determination of quantitative or qualitative value of risk related to a chemical, biological or physical hazard[49]. Median concentration of Cu in liver (10548.3 µg/100g ww)from reindeer revealed in the present study was nearly 11 times the RDA for adults (900 µg/ day)and slightly higher than the upper daily intake limit (UL) of 10 000 µg/ day for Cu[24]. Cu is an important essential element for both humans and animals, andexcessive intake has long been associated with toxicity[17, 50]. Although liver consumption is generally low compared to meat, it is important to conduct a risk assessment evaluation on the high hepatic Cu concentration from reindeer.Such assessment could ensure high consumers of reindeer liver an intake that considered being safe and in compliance with the established recommendations for daily Cu intake.Estimated daily liver intake from SAMINOR Study was about 9 g. The estimated daily Cu intake from reindeer liver(based on median value)calculated using the equation provided previously in the sampling and analysis section was about 0.02mg/kg body weight/day.This calculated value was well below the daily intake of 0.5 mg/kg body weight/day at which no deleterious effects would be expected in humans[23, 28]. Based on the estimated daily reindeer liver consumption (9 g/ day), Cu concentration revealed in this study could meet 9% of the RDA for adults (900 µg/ day) and constituted9%of the UL (10000 µg/ day) established for Cu[24]. The same procedure on calculation of the daily Cu intake from reindeer liver was done on the maximum value of the range interval for Cu concentration of 34337.2µg/100g ww revealed in this study. The calculated daily intake of Cu based on the maximum value of the range interval was 0.05 mg/kg body weight/day compared to the safe intake value of 0.5 mg/kg body weight/day as set by WHO/FAO[28]. In order to reach the WHO/FAO safe intake of 0.5 mg/kg body weight/day, amounts of 225 and 90 gliver per day are to be consumed based on the Cu median and maximum interval values revealed in this study, respectively.
4. Conclusions
- Liver displayed the highest Cu (10548.3µg/100g ww) and Co (13.2µg/100g ww) concentrations,whereastallow and bone marrow had the highest Cr concentration (7.8and 8.7µg/100g ww, respectively) with quite similar medians. Significant differences (p<0.01) were found for Cu concentrations between meat - liver, and tallow - bone marrow. Furthermore, Co concentrations were significantly different between meat and liver. Cu, Co and Crconcentrations in this study were measured for the first time in tallow and bone marrow from reindeer. No significant correlations were observed in concentrations of the studied elements within the specific tissue and among the four tissues.The risk analysis conducted on the high Cu concentrations from reindeer liver revealed an intake that was well below the daily safe intake of 0.5 mg/kg body weight as set by WHO/FAO.
ACKNOWLEDGEMENTS
- The authors would like to thank the owners and operators of the reindeer slaughterhouses from which the samples were collected for their cooperation. We are also grateful to Elen Kirsten Anti and Håvard Svendsen for their contribution in sample collection. The study was funded by the Reindeer Husbandry Development Fund (RUF), Alta and the Centre for Sami Health Research, Karasjok, Norway.