-
Paper Information
- Previous Paper
- Paper Submission
-
Journal Information
- About This Journal
- Editorial Board
- Current Issue
- Archive
- Author Guidelines
- Contact Us
Food and Public Health
p-ISSN: 2162-9412 e-ISSN: 2162-8440
2013; 3(3): 119-129
doi:10.5923/j.fph.20130303.02
Ultrasound-assisted Extraction of Polyphenols from Jatoba (Hymenaea courbaril L.var stilbocarpa) Bark
 Abstract
 Reference
 Full-Text PDF
 Full-text HTML
Priscilla C. Veggi1, Diego T. Santos1, Anne-Sylvie Fabiano-Tixier2, Carine Le Bourvellec2, M. Angela A. Meireles1, Farid Chemat2
1Department of Food Engineering, University of Campinas, Campinas, SP, 13083-862, Brazil
2Sécurité et Qualité des Produits d’Origine Végétale, Université d’Avignon et des Pays de Vaucluse, Avignon, F-84000, France
Correspondence to: Priscilla C. Veggi, Department of Food Engineering, University of Campinas, Campinas, SP, 13083-862, Brazil.
| Email: |  |
Copyright © 2012 Scientific & Academic Publishing. All Rights Reserved.
Hymenaea courbaril L. var stilbocarpa (jatoba) bark has been reported to be a great natural source of phenolic compounds. The important role of phenolics in human health has been demonstrated, thus increasing the interest in such products and their demand by consumers. Ultrasound-assisted extraction (UAE) was used to improve extraction efficiency in terms of extraction time and total polyphenol content. A preliminary study was first conducted to determine the type of solvent and optimum S/F (solvent volume to feed mass ratio) to be used in subsequent experiments. Water with an S/F of 20 was found to be the best solvent for the extraction of phenolic compounds. The UAE extractions were carried using a maximum and minimum ultrasound power (60 and 20 W) for 40 min at 50 ˚C and compared with conventional agitation extraction (AGE). A statiscally significant (P < 0.05) effect of ultrasound, was observed (approximately 15 % increase in total phenolic compounds content) when using maximum power; moreover, the three-stage and scaled-up ultrasound experiments demonstrated the efficiency of this process. DPPH analysis confirmed the high antioxidant activity of the ultrasound extracts and HPLC analysis demonstrated that besides in terms of quantity ultrasound irradiation alter the extract composition, supporting the suitability of UAE for the preparation of antioxidant-rich plant extracts.
Keywords: Ultrasound-assisted Extraction, jatoba Bark, Water Extraction, Phenolic Compounds
Cite this paper: Priscilla C. Veggi, Diego T. Santos, Anne-Sylvie Fabiano-Tixier, Carine Le Bourvellec, M. Angela A. Meireles, Farid Chemat, Ultrasound-assisted Extraction of Polyphenols from Jatoba (Hymenaea courbaril L.var stilbocarpa) Bark, Food and Public Health, Vol. 3 No. 3, 2013, pp. 119-129. doi: 10.5923/j.fph.20130303.02.
Article Outline
1. Introduction
- The worldwide use of plants for the production of natural extracts has been of crucial importance for human healthcare over the centuries. There are between 215.000 to 500.000 species of plants in the world; the diversity of these plants are important in the discovery and development of new therapeutic agents and bioactive compounds extracted from medicinal plants have demonstrated many functional activities, such as antioxidant, anticancer, anti-HIV, antimicrobial, anti-malarial, and hypoglycemic activities[1]. The Brazilian Hymenaea courbaril L. var. stilbocarpa, commonly known as jatoba, is found all over Brazil. The chemical analysis of jatoba shows that it is rich in biologically active compounds, such as diterpenes, sesquiterpenes, flavonoids, and oligosaccharides[2]. The leaves and bark are rich in terpenes and phenols with various biological activities that protect against infections and insect attacks[3]; they have antimicrobial, antifungal and antibacterial activities and can also act as molluscicides[4]. Jatoba bark yields an extract with high 5-lipoxygenase inhibitory activity; this extract has also been used in the cosmetics industry due to the presence of polycatechin, which has moisturizing and skin-lightening effects[5]. The high content of phenolic compounds in jatoba bark extracts is due to the presence of condensed tannins, oligomers and polymers formed by the condensation of two or more units of flavonoids, also known as polyflavonoides, that are present in most higher plants[6]. Tannins are known to possess general antimicrobial and antioxidant activities and can also act as an astringent and aid in healing[7]. In traditional medicine, tannins are used in the treatment of various diseases, such as diarrhea, hypertension, rheumatism, stomach problems, urinary system diseases and general inflammations[8]. A previous phytochemical study resulted in the isolation of a number of flavonoids with varied structures[5]. Some of these chemicals, such as copalic acid, delta-cadinene, caryophyllene and alpha-humulene, have reportedly been employed as anodynes, antiseptics, astringents, expectorants, laxatives, purgatives, sedatives, stimulants, and tonics in folk medicine[9].Many countries are starting to apply strict environmental regulations in almost every aspect of human life due to the growing environmental concerns of society[10]. Common extraction procedures for the isolation of organic compounds from medicinal plants are hydrodistillation, maceration, and low-pressure solvent extraction (LPSE), among others. However, these techniques usually require long extraction times and have low efficiencies. In addition, the presence of thermolabile compounds requires the use of techniques at low temperatures to prevent hydrolysis, hydrosolubilization and degradation[11]. Recently, ultrasound-assisted extraction (UAE), a clean technology in the food industry, has been the subject of much research and development. This novel technology has also considered for environment sustainability applications. Developments in ultrasound technology and their potential benefits have triggered interests in applying powerful ultrasounds to a wide range of chemistries and processes[12]. This technology can provide an economical alternative to the traditional extraction processes used for expensive raw materials. Ultrasound-assisted leaching is an effective method for the extraction of chemical constituents from plant materials. Extraction can be accomplished in shorter times compared with other extraction techniques, indicating that this method can be potentially used in the extraction of thermally sensitive ingredients used in foods, healthcare products, cosmetics, and pharmaceuticals[13]. The extraction mechanism involves two types of physical phenomena: diffusion through the cell walls and washing out the cell’s content once the walls are broken. Ultrasound waves interact with the plant material to alter its physical and chemical properties; the cavitational effects of these waves facilitate the release of extractable compounds and enhance mass transport by disrupting the plant cell walls[14]. Better swelling improves the rate of mass transfer and results in an increased extraction efficiency and/or reduced extraction time[15].UAE has also been employed in the extraction of tannins, a class of polyphenols also largely present in jatoba bark extracts, from vegetable tanning materials. Alexe et al.[16] reported an increase in the extraction of tanning material under ultrasonic vibration at a frequency of 8000 kHz for 15 min compared with stirring at 1400 rpm for 8 h. Sivakumar et al.[17] also used ultrasound in the extraction of tannins from myrobalan nuts and observed an improvement in yield (3 to 5 times higher), with power levels from 20 to 100 W. Rao et al.[18] studied the influence of ultrasound frequency, time and intensity on the extraction of tannins from deoiled salseed cake using different solvents. Thus far, no reports were found on the extraction of total polyphenols from jatoba bark by UAE. Therefore, the objective of the present work was to determine the feasibility of using UAE to obtain jatoba bark extracts rich in polyphenols and to analyze their chemical compositions and antioxidants activities. The optimized results obtained were compared with those achieved by conventional agitation extraction (AGE).
2. Experimental
2.1. Plant Material
- The jatoba bark was purchased from Superextra (São Paulo, Brazil). The raw materials were comminuted, packed in plastic bags and stored in a freezer at -15ºC.
2.2. Extraction Procedure
2.2.1. Preliminary Study
- A preliminary study was conducted to determine the optimal extraction conditions regarding the solvent nature and the solvent/feed ratio, using total polyphenols content (TPC) as response variable. The extraction efficiency of the solvents (distilled H2O, distilled H2O + EtOH (1:1, v/v), EtOH and buffer (pH 3.0)) and the solvent volume/feed mass ratios (S/F) (20, 10 and 6.7) were evaluated using 1.5-2 g of dry materials in each extraction. Jatoba extracts were obtained by maceration using a RT-10 magnetic stirrer plate (IKAMAG, Germany) equipped with stir bars for 3 hours in the dark. The samples were filtered with a 0.45-µm mesh filter prior to analysis.
2.2.2. Ultrasound-assisted Extraction (UAE)
- For the UAE experiments, the ultrasonic extraction reactor PEX 1 (R.E.U.S., Contes, France) was used. It consisted of an inox jug, with internal dimensions of 14×10 cm and a maximum capacity of 1 L, equipped with a transducer at the base of the jug operating at a frequency of 25 kHz, with a maximum input power (output power of the generator) of 150 W, as shown in Figure1. The double-layered mantle with water circulation allowed for the control of the extraction temperature with cooling/heating systems. For a typical extraction procedure, 300 cm3 of water and 15 g of dried jatoba bark (solvent volume to feed mass ratio (S/F) of 20) were mixed and then extracted at atmospheric pressure. To prevent the degradation of phenolic compounds, all experiments were performed at 50 ºC. Maximum and minimum powers of 60 and 20 W, respectively, were used in the phenolics extraction for 40 min. The extracts were then filtered before being lyophilized, except for the samples that underwent total phenolics content analyses; these samples were filtered with a 0.45-µm mesh filter prior to analyses. All experiments were performed in triplicates. To determine the feasibility of the scale-up of the process, UAE experiments was performed with a PEX 3 Sonifier (R.E.U.S., Contes, France) composed of an inox jug, with internal dimensions of 23×13.7 cm and a maximum capacity of 3 L, and a transducer at the base of jug operating at a frequency of 25 kHz with a maximum input power (output power of the generator) of 150 W. This setup was operated in the same way as described for the 1 L equipment. In order to determine the efficacy of ultrasound to assist the extraction of polyphenols from jatoba barks, the results from UAE were compared to an extraction performed by conventional agitation extraction (AGE), performed under the same conditions but without the use of ultrasound. At the same time, another type of ultrasound equipment was used with comparative purposes. A titanium alloy microprobe of 6 mm tip (Ultrasonic Processor, Fisher Bioblock Scientific, France) operating at 20 kHz (maximum power of 140 W) was used for those experiments. Since this type of equipment is in direct contact with the extraction media, the results from UP (ultrasonic probe) extraction were compared to those from UAE performed in 1 L and 3 L capacity reactors.
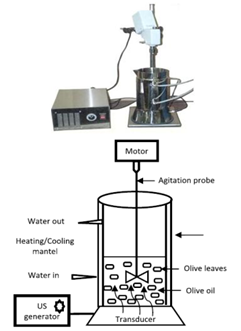 | Figure 1. Laboratory ultrasonic device used for ultrasound-assisted extraction |
 ) in the extraction mixture is not the same as the quoted power and is rarely reported. One of the most common methods of measuring
  is based on calorimetry and assumes that all the power entering the process vessels is dissipated as heat, as shown in the following equation:
 | (1) |
 versus ΔT, we found that the actual power dissipated in the system was 60 W.
 2.2.3. Three-Stage Crosscurrent Extraction
- To determine if it is possible to enrich the jatoba bark extract with the residual by-product of an earlier extraction, a three-stage extraction in series was used. In this extraction, both the feed in stage 1 and the residue in the following stages are treated in successive stages with fresh solvent. In other words, the residue from the previous stage is used as the material for the subsequent extractions.
2.3 Analysis
2.3.1. Total Phenolics Content (TPC)
- TPC was measured with a kit (SEPPAL (Isitec-lab), France) that included reagent A (modified Folin-Ciocalteu reagent), reagent B (alkaline buffer) and a gallic acid solution (3 g/L). A small volume (20 µL) of H2O (blank), gallic acid solution (standard) or extract (sample) was mixed with reagent A (2 cm3). After 1 min, 1 cm3 of reagent B was added to each mixture. The mixtures were allowed to stand for 30 min in the dark at room temperature before their absorbances were measured at 760 nm. The TPCs of the samples were calculated using the following formula:TPC = 3 × (sample absorbance – blank absorbance)/ (standard absorbance – blank absorbance). The TPC measurements were performed three times, and the mean values, expressed as mg gallic acid (GAE)/g of dried jatoba bark, are reported.
2.3.2. Yield Determination
- Ethanol was removed from the extracts by evaporation under vacuum at 50 ºC in a rotary evaporator. The samples with water were frozen and then lyophilized. The yield of each extract was calculated from its weight (dry basis, d.b.) and expressed as a percentage.
2.3.3. Kinetic Studies
- A mathematical model derived from Fick’s second law was used for the kinetic studies. The extraction of polyphenols from jatoba bark follows first-order kinetics, which can be represented as follows:
 | (2) |
 | (3) |
 and
and  are the first-order rate constants for the transfer of the constituent across the interface from raw material to the solution and vice versa, respectively. The last term on the right-hand side of Equation (3) can usually be neglected, as it will almost always be much smaller than the
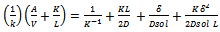
  term. The other three terms correspond to the three rate governing steps of the process: surface-controlled infusion, diffusion of the soluble constituent through the raw material with a diffusion coefficient D, and diffusion of the constituent through the Nernst layer of thickness δ with a diffusion coefficient Dsol. If the second step alone is rate determining, then:
 | (4) |
 | (5) |
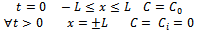 (Constant concentration at the interface)
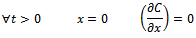 (Symmetry of the system)The general solution of Equation (5), given by Crank[19], is as follows:
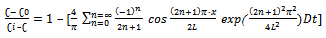 | (6) |
 . By integrating the concentration over the thickness, the mass transferred from the plate at any time (M) can be calculated[20]. The mass transferred at time t relative to the total amount transferred after infinite time
  is expressed as:
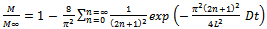 | (7) |
 | (8) |
2.3.4. Antioxidant Activity
- Antioxidant activity was determined using the second DPPH (1,1-diphenyl 2-picrylhdrazil) radical method as described by Kordali[24]. The method is based on the ability of DPPH to react with hydrogen donors. Antioxidants that receive the same H+ are then reduced, resulting in the percentage of antioxidant activity (AA %). The amount necessary to decrease the initial DPPH concentration by 50 % is called the inhibitory concentration (IC50). Therefore, the higher the consumption of DPPH by a sample, the lower its IC50 and the greater its antioxidant activity. The DPPH solution was prepared by dissolving the DPPH radical in methanol at a concentration of 60 μM. The final concentrations of the extracts were prepared in tubes at four different dilutions in ethanol (25, 50, 75 and 100 μg/cm3). BHT was used as a positive control at a concentration of 0.05 g/cm3. Subsequently, aliquots of 0.1 cm3 of each dilution of the extract were transferred to tubes containing 3.9 cm3 of the DPPH solution then mixed in a tube shaker in the dark. A 0.1 cm3 volume of ethanol was used as the control. Pure ethanol was used as a blank to calibrate the spectrophotometer. The readings of the samples were taken immediately at 0 and 30 minutes of reaction in a UV-vis spectrophotometer (Hitachi, model U-3010, Tokyo, Japan) at a wavelength of 517 nm. The antioxidant activities of the extracts were calculated as the percentage of DPPH radical scavenging according to Equation 9:
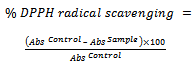 | (9) |
2.3.5. Thin-layer Chromatography (TLC)
- TLC was used to verify the existence of antioxidant compounds and tannins in the jatoba bark extracts. Aluminum chromatographic plates with UV sensitive silica gel (TLC aluminum plates, 20×20 cm, Silica gel 60 F254, 0.25 mm thick, Merck, lot OB 522724, Darmstadt, Germany) were used. The mobile phase was made up of chloroform, methanol, n-propanol and water at a ratio of 5:6:1:4 (v/v). The standards rutin (Sigma Aldrich Inc., lot 086K1245, St. Louis, EUA) and gallic acid (Sigma Aldrich Inc., lot 023K01171, St. Louis, EUA) were used to perform a semi-quantitative analysis. The chromatographic plates were sprayed with a specific color reagent for the detection of DPPH (2 mg/cm3 in methanol) and tannins (ferric chloride 1% in methanol). The appearance of yellow spots on the plates within 30 minutes, in contrast to the purple color of DPPH, indicates antioxidant activity. Dark blue-colored spots indicate the presence of tannins.
2.3.6. Characterization and Quantification of Phenolic Compounds
- Polyphenols were measured by HPLC after thioacidolysis, as described by Guyot[25]. The average degree of polymerization was measured by calculating the molar ratio of all the flavan-3-ol units (thioether adducts plus terminal units) to (-)-epicatechin and (+)-catechin corresponding to terminal units. Polyphenols were separated in an Agilent 1050 separation system (Agilent Technologies) that included a quaternary pump coupled to a diode array detector and controlled by the Agilent Chemstation A.10.02 software. The separations were achieved using a Licrospher PR-18 5-μm column (250 × 4 mm i.d.; Merck, Darmstadt, Germany) with a guard column (Licrospher PR-18 5 μm column, Merck, Darmstadt, Germany) at 30 °C. The mobile phase consisted of a water/acetic acid mixture (97.5:2.5, v/v) (eluent A) and acetonitrile (eluent B). The flow rate was 1 ml/min. The elution program was as follows: 3-9% B (0-5 min); 9-16% B (5-15 min); 16-50% B (15-45 min); 50-90% B (45-48 min); 90-90% B (48-52 min); 90-3% B (52-55 min); 3-3% B (55-60 min). The jatoba bark extracts, obtained by ultrasound assisted extraction for the 1 L equipment (UAE), conventional agitation extraction (AGE), ultrasound assisted extraction for the 3 L equipment - scale-up (E/US), and ultrasound assisted extraction with using ultrasonic probe (UP), as well as jatoba bark, were analyzed. Samples with a volume of 20 µl were injected to the system. The column effluent was monitored at 280, 320 and 350 nm. Quantification was achieved using standard solutions of known concentrations.
2.3.7. Statistical Analysis
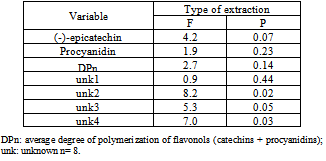
- The results are presented as the mean values, and the reproducibility of the results is expressed as the pooled standard deviation. Pooled standard deviations were calculated for each series of replicates using the sum of the individual variances weighted by the individual degrees of freedom. The variability of the composition between extracts was expressed by the average of the mean values for each extract and the standard deviation of the mean.The ANOVA procedures were performed and mean comparisons were carried out using Tukey’s test. Results were considered significantly different at P < 0.05.
3. Results and Discussion
3.1. Preliminary Study
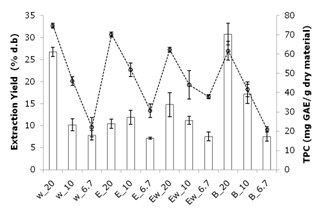 | Figure 2. Extraction yield (% d.b) (bars/left y-axis) and total phenolic compounds (mg GAE/g dry material) of jatoba bark extracts obtained by maceration extraction using: w (H2O), E (ethanol), Ew (ethanol+H2O) and B (buffer, pH 3.0) at 20, 10 and 6.7 S/F ratios |
3.2. Comparison between UAE and AGE Extractions
- The UAE extractions were carried using a maximum and minimum ultrasound power (60 and 20 W) for 40 min at 50˚C and compared with conventional agitation extraction (AGE). According to the results, the amount of total phenolic compounds extracted under 60 W was significantly higher according to Tukey’s Test (P < 0.05) (the value was approximately 20 % higher than when 20 W was used). Therefore, according to the conditions studied for UAE, the temperature of 50 °C, power of 60 W were selected for further experiments. These same conditions were applied to conventional agitation extraction (AGE) without ultrasonic assistance during the extraction process (Figure 3). The maximum power dissipated in the medium, measured by calorimetry, was approximately 60 W.
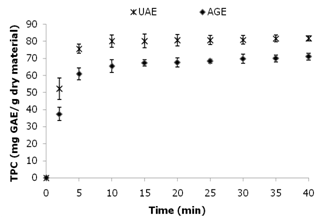 | Figure 3. Kinetic study of UAE and AGE. The total phenolic content (mg GAE/g dry material) of the jatoba bark extracts and their yield (%) are plotted against time |
3.3. Three-stage Crosscurrent Extraction
- To determine the effect of sequential extraction steps on the polyphenol extraction yield of jatoba extracts, three extraction steps were used for both UAE and AGE. The conditions selected previously were kept constant for these experiments, and the consecutive extractions were performed with the same plant material by re-extracting the solid after filtration using fresh solvent and the same extraction conditions in each step. The polyphenols content and yield were evaluated after each step. In Figure 4, it can be observed that three steps yield phenolic compounds from jatoba bark extracts through UAE and AGE. Comparing the processes, the differences in the TPC between the two extracts in the first and second steps were 15 % and 10 %, respectively, while the TPC of the extracts from the two processes were similar in the third step. The extraction yield also varied in the same way; there was a 12 % difference between the extracts from the two processes in the first step, proving the reproducibility of the extractions, while the yield of the two processes in the second and third steps were similar. Jerman et al.[26] studied the effect of sequential extraction steps on the extraction yields of olive fruit phenols. They found that a three-step extraction was sufficient for the quantitative recovery of main olive fruit phenolics because only rutin (2% of the total amount) was detected in the fourth extraction step. Aspé and Fernández[28] used a three-stage extraction to extract tannins from Pinus radiate. According to their results, there was a very small increase in yield at the second and third stages of extraction.
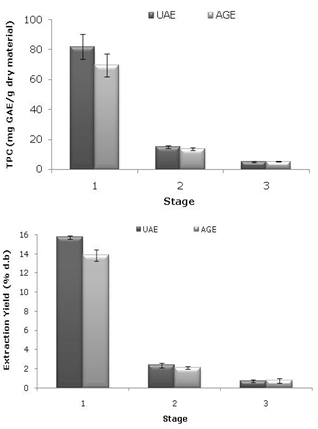 | Figure 4. Three-stage sequential extraction of jatoba bark extracts by UAE and AGE: (a) total phenolic content (mg GAE/g dry material) and (b) extraction yield (% d.b) |
3.4. Scale-up
- The conditions selected in the previous experiments (60 W, 40 min, 50°C) were also used for the UAE scale-up studies in a 3 L bath. Figure 5 shows the TPC (81 ± 2 mg GAE/g dry material) and yield (15.5 ± 0.5 %) obtained from the UAE scale-up. The three times increase in volume (1 L to 3 L) to a semi-pilot plant scale produced a similar yield (15.8 ± 0.7 and 15.5 ± 0.5 %) for the laboratory and scaled-up processes, respectively) and polyphenolic content (81 ± 2 and 82 ± 2 mg GAE/g dry material) in the extracts; the means have no statistically significant difference between them, according to Tukey’s Test (P < 0.05). In addition, the TPC of the extract from the scaled-up process was 15 % higher than that from the conventional procedure using agitation (AGE). Studying a scaled-up process (30 L) for apple pomace, Pingret et al.[27] found that the polyphenol yield from the ultrasound extraction were comparable to the results from lab scale experiments and 15 % higher when compared with the conventional maceration extraction. This same behavior was observed by Achat et al.[29], who performed studies using the same scaled-up reactor (30 L). The authors found a similar polyphenol yield from the UAE pilot-scale and lab-scale experiments corroborating our findings.
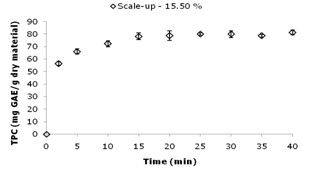 | Figure 5. Kinetic study of the scaled-up extraction. Total phenolics content (mg GAE/g dry material) of the jatoba bark extracts and their yield (%) are plotted against time |
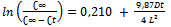
3.5. Kinetics Study
- Generally, the kinetic extraction curves are characterized by two time periods: (1) a constant-reaction rate period, called also by fast stage; (2) a falling-reaction rate period, called also by slow stage. The equivalent plots of the function ln (C∞/[C∞ - Ct]) against the extraction time for the fast and slow stages of the UAE and AGE processes are shown in Figure 6. The concentration of extractable compounds increased with time for both processes due to enrichment of water with solute over time.
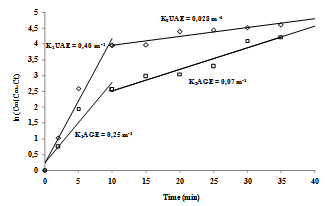 | Figure 6. Kinetics and the constants of the agitation (KAGE) and ultrasound (KUAE) extractions |
3.6. Antioxidant Activity (AA)
- The antioxidant potentials of the extracts from UAE and AGE are shown in Figure 7. The DPPH tests provided information about the activities of the compounds with stable free radicals; DPPH effect is assumed to be due to their hydrogen donating ability. Higher IC50 values signify less antioxidant activity and vice versa.
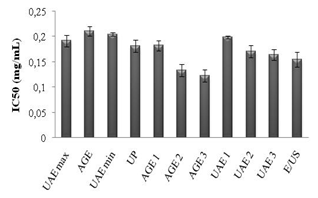 | Figure 7. IC50 values determined by the DPPH assay for jatoba bark extracts obtained by: UAE max (maximum power, 60 W) and UAE min (minimum power, 20 W); AGE (agitation extraction); UP (ultrasound probe); UAE1, UAE2, UAE3 and AGE1, AGE2, AGE3 (three-stage extraction) and E/US (scale-up) |
3.7. Thin-layer Chromatography
- Thin-layer chromatography (TLC) was conducted to identify the antioxidant compounds and tannins in the extracts. According to Figure 8 (b), plates sprayed with 1% ferric chloride in methanol confirmed the presence of phenolic substances derived from the class of tannins through the appearance of a dark blue color typical of gallic acid (AG), a tannin standard. When the plates were sprayed with DPPH (Figure 8 (a)), yellow spots appeared on the violet background in the same way that the gallic acid and rutin (A) standards reacted. This antioxidant activity is probably due to the presence of the phenolic compounds, of which tannins are present in all the extracts because the bands correspond to the polar extracts and are the same bands related to derivatives of tannins. This same behavior was confirmed by Souza et al.[32].
3.8. HPLC (High-Performance Liquid Chromatography)
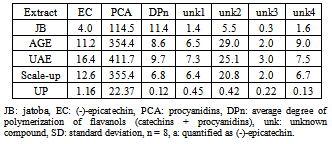
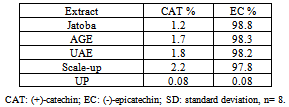
- Thioacidolysis, the acid-catalyzed cleavage of the interflavanyl linkages of procyanidins in the presence of a nucleophile reagent such as toluene-α-thiol, followed by reverse-phase HPLC was used to calculate the average degree of polymerization of the procyanidins and to characterize and quantify the phenolic compounds in the extracts[22]. The composition and concentrations of the major phenolics found in the jatoba bark and in the different extracts are shown in Table 1. The phenolic profile of jatoba bark was extremely simple: two major phenolic groups with a total of two identified compounds were quantified. At the end of the jatoba bark chromatogram, four unknown compounds were observed. These components were assigned to the flavonoid group because of their UV-spectra, with a maximum absorbance at 280 nm, and were quantified as (-)-epicatechin equivalents. Representative HPLC chromatograms of jatoba bark are displayed in Figure 9.
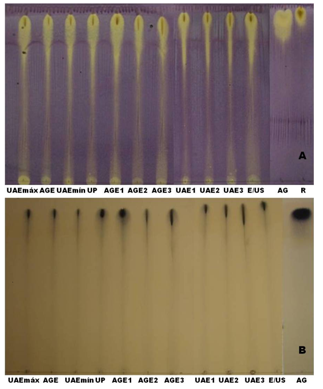 | Figure 8. TLC results of (A) DPPH and (B) tannins in jatoba bark extracts obtained by: UAE max (maximum power) and UAE min (minimum power); AGE (agitation extraction); UP (ultrasound probe); UAE1, UAE2, UAE3 and AGE1, AGE2, AGE3 (tree-stage extraction) and E/US (scale-up) with standard AG (gallic acid) and R (rutin) |
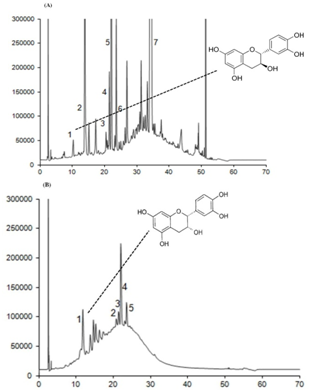 | Figure 9. HPLC profiles of the polyphenols in the water extracts of jatoba bark obtained by ultrasound-assisted extraction at 280 nm. A: (1) (+)-catechin; (2) (-)-epicatechin; (3) unk1; (4) unk2; (5) unk3; (6) unk4; (7) (-)-epicatechin benzylthioether; B: (1) (-)-epicatechin; (2) unk1; (3) unk2; (4) unk3; (5) unk4 |
|
|
|
4. Conclusions
- Ultrasound-assisted extraction considerably improved both the kinetics and the quantitative extraction of phenolic compounds present in jatoba (Hymenaea courbaril L.var stilbocarpa) bark when compared to conventional extraction method. The optimal extraction conditions were achieved when 40 min (total extraction time), 50 ºC (extraction temperature) using ultrasound at 60 W of power (25 kHz) with an S/F equal 20 (solvent mass/feed volume ratio) of water are employed. The three-stage and large-scale experiments confirmed the efficiency of ultrasound power, providing an efficient method to produce antioxidant-rich extracts, with reduced time and energy, that has potential applications in various industries.
ACKNOWLEDGEMENTS
- Priscilla C. Veggi and Diego T. Santos would like to thank Fundação de Amparo à Pesquisa do Estado de São Paulo (FAPESP) for the doctoral (08/10986-2) and postdoctoral (processes 10/16485-5; 12/19304-7) fellowships, respectively. The jatoba bark sample was taken to France with permission from IBAMA (5.125.535).