-
Paper Information
- Next Paper
- Paper Submission
-
Journal Information
- About This Journal
- Editorial Board
- Current Issue
- Archive
- Author Guidelines
- Contact Us
Food and Public Health
p-ISSN: 2162-9412 e-ISSN: 2162-8440
2013; 3(3): 111-118
doi:10.5923/j.fph.20130303.01
The Rural Food Environment: A Survey of Food Price, Availability, and Quality in a Rural Florida Community
Melissa J. Vilaro, Tracey E. Barnett
Department of Social and Behavioral Sciences, College of Public Health & Health Professions, University of Florida, Gainesville, FL, USA
Correspondence to: Melissa J. Vilaro, Department of Social and Behavioral Sciences, College of Public Health & Health Professions, University of Florida, Gainesville, FL, USA.
| Email: |  |
Copyright © 2012 Scientific & Academic Publishing. All Rights Reserved.
This study describes a rural food environment, identifying positive and negative determinants of diet. Eleven food stores in a rural Florida community were mapped using Geographic Information Systems (GIS) and surveyed for price, availability, and quality of food items using the Nutrition Environment Measurement Survey-stores (NEMS-S). Findings reveal that convenience stores comprise 72% of food stores in this rural town. Availability, the presence or absence of specified healthy items, differs by store type withsupermarkets selling a variety of fresh produce and other healthy items. Convenience stores demonstrate poor availability of many healthful options including low-fat milk, low-fat baked goods and lean meats. Regarding price, baked chips, the healthier version item, are more expensive compared to regular chips and healthy baked goods cost less than regular baked goods. Beverages and cereals are more expensive at convenience stores.Supermarkets have high quality produce and convenience stores provide quality produce when it is available. Convenience stores make up a large percentage of the available food sources in this small rural town and mediocre to poor composite scores (price + availability + quality= composite) for each store indicate that all stores that make up this rural food environment have room for improvement.
Keywords: Rural, Food Environment, Access, Diet Quality, NEMS-s
Cite this paper: Melissa J. Vilaro, Tracey E. Barnett, The Rural Food Environment: A Survey of Food Price, Availability, and Quality in a Rural Florida Community, Food and Public Health, Vol. 3 No. 3, 2013, pp. 111-118. doi: 10.5923/j.fph.20130303.01.
Article Outline
1. Introduction
1.1. Food Environment Research
- The food environment is often conceptualized as the presence or absence of supportive structures that dictate dietary intake. The study of food environments, including how to define and measure them, is commanding attention among nutrition and public health researchers. A review of 137 food environment studies published between 1990 and 2007 reveals 70.8% of food environment studies have been published since 2002, indicating a growing interest in the field.1 Part of the growing interest in food environments is due to the fact that 33% of US adults are considered obese (BMI 30 and above) and 68% of US adults are either overweight or obese (BMI 25 or above).2 It is projected that if trends continue at this rate, by the year 2015, 75% of US adults will be considered overweight or obese and 41% will be obese.3High rates of overweight and obesity can be found in many populations, spanning various racial and ethnic groups2, ages4, and socio-economic statuses.5Additionally, obesity is a risk factor for many chronic diseases including heart disease, cancer, stroke, and diabetes.6,7 Obesity also places an economic burden on our health care system with an estimated $147 billion spent on obesity related expenses in 2008.8Considering the burden of high-calorie diets and poor adherence to recommended amounts of physical activity the continued study of food environments as one part of this complicated health issue is important for addressing determinants of poor diet and obesity.
1.2. The Issue of Access, Diet, and Obesity
- Healthier diets and lower obesity rates are associated with neighborhood residents who have better access to supermarkets and limited access to convenience stores. 9,10 For urban dwelling adults the presence of small food outlets is positively and significantly associated with obesity status and BMI.11 While links between access and weight status are demonstrated for urban adults, the lack of research within rural areas presents a gap in our knowledge concerning the factors related to obesity and poor diet for rural adults. Researchers have suggested that particular populations, including those with low-income, minorities, and those living in rural areas, may be disproportionately affected by a food environments influence, as these populations present with high rates of obesity, diabetes, and other diet-related health outcomes.1,9,12,13Specific to rural adults, recent findings confirm that rural residents experience disproportionally high rates of obesity compared to their urban counterparts with about 40 percent of rural adults experiencing a body mass index (BMI) at or above 30 compared to 33 percent of urban adults with a similar BMI.14 Considering the paucity of research concerning rural food environments and high rates of obesity in rural populations, research in this area is warranted. Focusing research within rural communities will allow for improved understanding and identification of important determinants of diet for this population.15
1.3. Rural Adults and Diet
- Twenty percent of people living in the US, reside in rural areas, a number that increases to 25% in the South and Midwest.12,16 Concerning the diet quality of rural adults, Savoca and colleagues found that less than 2% of rural adults achieved an adequate score of 80/100 on the 2005 version of the Healthy Eating Index, a tool that evaluates the overall quality of diet with scores ranging from 0 (low quality) to 100 (high quality) . Additionally, rural adults in this study had a mean score of 61, five points lower than the national average of adults of similar age.17Given the fact that rural populations adhere poorly to dietary guidelines compared to national averages,18and experience higher rates of obesity compared to urban counterparts14, understanding rural food environments including access to retail food outlets selling quality and affordable healthy food may shed light on important determinants of diet for this population. Additionally, considering the high burden of diet related illnesses associated with poor diet (hypertension, type II diabetes, metabolic syndrome, cardiovascular disease, various cancers, osteoporosis, and poor pregnancy outcomes) that function as risks for rural populations by way of poor diet quality, a rural population is worthy of more focused study concerning food environments, BMI, and diet.19
1.4. GIS and Mapping Access
- Mapping food stores in neighborhoods composed of vulnerable populations allows one to visualize the spatial distribution of food stores and the goods they sell. Spatial measures of access are an important tool given research among rural adults showing rural areas have less food stores compared to urban or suburban areas.20 Limited number of food stores overall is clearly an issue of access, however the type of food stores available and distances that residents have to travel to access them are also important for diet. Shopping at supermarkets (as opposed to convenience stores) is associated with greater fruit and vegetable intake among rural adults.21Intake may be related to the size of stores by way of price as findings indicate that healthy items are cost less in larger stores.22Additionally, greater distance to a food outlet, measured in perceived walking time greater than 30 vs. less than 10 minutes, nearly doubled the odds of obesity in one study conducted in a rural community. 12 Many of these findings demonstrate how understanding access to food stores by way of mapping out locations can lead to insight regarding dietary behaviors. Measuring and mapping attributes of food environments can highlight areas of need and facilitate changes that positively influence health. As previous research has documented, some aspects of the food environment appear to influence food choice and healthy eating, therefore a first step in modifying a food environment is adequately describing it. 23,24
1.5. Study Aims
- As few studies have documented the retail food environment of rural areas, this work contributes to understanding the types of retail food stores, as well as the price and quality of food items available in a rural area. The purpose of this research is to describe the spatial and physical components of retail food stores in a rural food environment to highlight attributes that may influence dietary behaviors among rural residents including geographic distribution of food stores as well as price, quality, and availability of food items within the stores.
2. Methods
2.1. Measure
- The Nutrition Environment Measurement Survey-Store (NEMS-S) was used to collect information about price, availability, and quality of food items in supermarket and convenience stores in the data collection area during July 2010. NEMS-S is a survey that allows for comparisons between healthy and regular (less healthy) versions of items; for example “healthy” skim or 1% milk vs. “regular” whole milk, “healthy” 100% whole grain vs. “regular” bread with refined flour, and “healthy” baked chips containing less than or equal to 3 grams of fat per 1 oz. serving vs. “regular” chips with greater than 3 grams of fat per one ounce serving.Other items from NEMS-S in this study include fresh fruits, vegetables, and healthy and regular versions of fruit juice (100% fruit juice vs. fruit drink), hot dogs (0-6g fat/serving vs. >12g fat/serving), baked goods (0-3g fat/portion vs. >3 g fat/portion), soda (diet vs. sugared), cereal (0-6 g sugar vs. > 6 g sugar), and ground beef (90% lean vs. 80% lean).25NEMS-S scores high on reliability; percent agreement (92-100%), inter-rater reliability kappas (.84-1.00) and test-retest (.73-1.00).18 An online NEMS training course was completed prior to data collection.26
2.2. Design
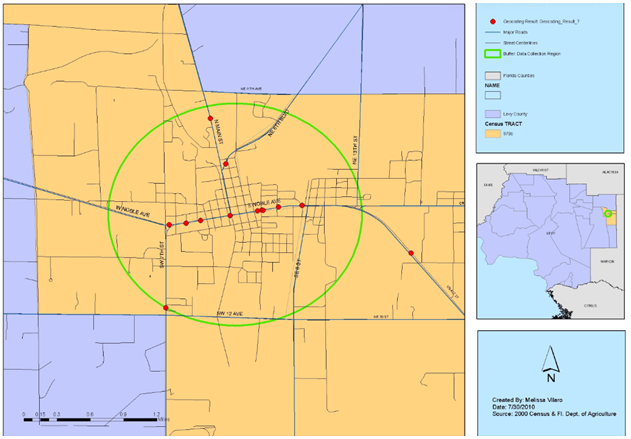
- Consistent with methods used in similar studies that describe characteristics of retail food stores, the names and addresses of all food stores in Levy County, a rural county in North Central Florida, were obtained from the Florida Department of Agriculture (FDOA). Addresses and store names were confirmed with an internet search. The internet was also used to confirm information about store type (supermarket vs. convenience), and to identify additional food stores that were not listed on the original FDOA list. Ground-truthing, a direct method where in-person observations supplement the use of secondary data, allowed researchers to confirm locations of stores within census tract 9706 in Levy CountyFlorida.27
 | Figure 1. Data collection area shown with GIS map of food stores in census tract 9706 Williston, Florida |
2.3. Sample
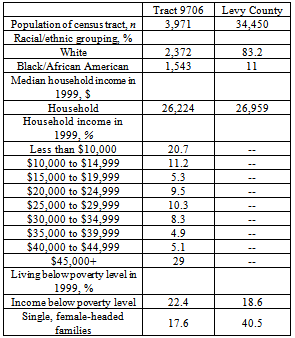
- Eleven stores including two supermarkets, one deep-discount grocery store, and eight convenience stores were included in the sample. Supermarkets are defined as food stores that offer a full variety of foods and have annual gross sales more than $2 million, grocery stores gross less than $2 million annually and convenience stores are defined as stores that offer a limited range of foods, aimed at supplementing larger food stores and provide convenience via proximity to shoppers and hours.30 The two supermarkets are major chains found in the southeast, while the discount food store operates by placing bids on surplus food items from larger chain food stores, selling products at deep discounts to low-income residents in the area. The discount food store was included in the supermarket category as all of the products sold were made available through the local chain supermarkets. The study area located in census tract 9706 is in a rural neighborhood, where the median household income in 1999 was $26,224, and 20 percent of residents reported household incomes of less than $10,000 (Table 1). In comparison, the state of Florida reported a median household income of $38,665 and the median household income for the United States totaled $41,851during the same time period. Additionally,22 percent of residents living within rural census tract 9706 had incomes below the federal poverty line compared to 12.5 percent for the state of Florida and 12.4 percent for the United States.31
|
2.4. Analysis
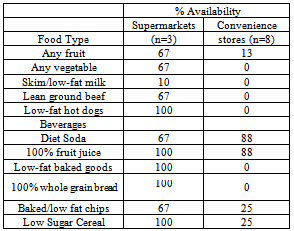
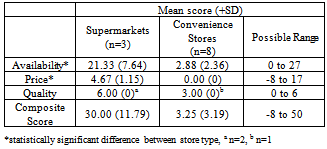
- SAS v9.232 was used to provide descriptive statistics about availability of healthy items by store (Table 2) and to compare NEMS-S scores on price, availability, and quality by store type (Table 3). Nonparametric, Wilcoxon Rank-Sum tests were conducted to assess differences between prices of healthy food items and regular food items and to compare prices of food items sold at supermarkets and convenience stores.
|
|
3. Results
3.1. Price
- Price is evaluated by assessing how prices of healthy items compare to the prices of their less healthy counterparts. The price differences for same-type food items are also compared between convenience stores and supermarkets. Each store is also given an overall score for price.
3.1.1. Healthy vs. Regular
3.1.2. Convenience vs. Supermarket
- Comparing food item prices between convenience and supermarket indicated that convenience stores were priced significantly higher than supermarket for a majority of items including: milk price per half gallon(M (SD) =$3.29 (0.27) /$2.55 (0), Ws=10, p=0.008), baked goods price per item(M (SD) =$1.17 (0.36) /$0.53 (0.32), Ws=26, p=0.021), soda price per ounce (M (SD) =$0.07 (0.01) / $0.04 (0.00), Ws=15, P = .000), juice price per ounce (M (SD)=$0.11 (0.01)/ $0.04 (0.01), Ws=21, P = .000), and cereal price per ounce (M (SD) =$0.96 (0.39) /$0.30 (0.12), Ws=45, P = .004). No significant differences were found for the price of hot dogs, beef, or bread by store type.
3.1.3. Overall Price Score
- Each store can earn between -8 and 17 points for an overall price score based on how healthy items compare to less healthy items. A higher score indicates that healthy items cost less than unhealthy items. Overall scores are reported as means and standard deviations with supermarkets scoring 4.67 (1.15) out of 17 possible points and convenience stores scoring 0 (0) out of 17 possible points.
3.2. Availability
- Two of the three supermarkets that sold any fruit and vegetables scored 100% availability (all of the possible items on the survey were available). Only one out of the eight convenience stores had any fruit available and zero had any vegetables available. Convenience stores have low availability of healthful options such as low-fat milk, low-fat baked goods as well as lean meats compared to supermarkets which generally demonstrate good availability (table 2).
3.2.1. Overall Availability Score
- Each store can earn between zero and 30 points for availability with a higher score indicating high availability of healthy items. Overall scores are obtained by combining individual store scores. Overall scores are reported as means and standard deviations with supermarkets scoring 21.33 (7.64) out of a possible 27 availability points and convenience stores scoring 2.88 (2.36) out of a total of 27 availability points.
3.3. Quality
- Quality points are earned based on the percentage of acceptable ratings for the total available varieties of fruits and vegetables. Stores selling fruits or vegetables in this rural town all score 100% on quality.
3.3.1. Overall Quality Score
- Stores selling fruits and/or vegetables can earn from zero to six quality points with a higher score indicating a high percentage of quality fresh fruits and vegetables. Scores are reported as means and standard deviations with supermarkets scoring 6.00(0)out of a total of 6 quality points and convenience stores scoring 3.00 (0) out of a possible 6 quality points. Stores cannot earn points for quality if availability is zero.
3.4. Composite Score
- The composite scores are calculated by adding up each stores price, quality, and availability scores. The composite score indicates each stores overall food environment quality and healthfulness (price + availability + quality = composite score). Stores can earn between -8 and 50 points as a composite score. The mean composite score for Supermarkets is 30.00 (11.79) compared to convenience stores who have a mean composite score of 3.25 (3.19). Based on Composite scores all stores have room for improvement when it comes to the quality of this rural food environment.
4. Discussion
4.1. Summary
- This study describes the availability of healthy food options as well as price and quality of healthy food items in a populated rural community. Availability of fresh produce in this rural community is limited depending on store type with convenience stores offering very limited availability of fresh fruit and zero availability of fresh vegetables. The complete absence of any fresh fruit or vegetables from the deep discount supermarket has implications for low-income rural residents who may rely on this particular discount food store for healthy food options. Issues of health and access for the rural residents in this area are highlighted by the absence of fresh produce and limited availability of healthy options in convenience stores which comprise a high percentage of the food stores in this small area.Findings on low availability of healthy food items in convenience stores can inform community or policy level action to lobby for provisions of particular healthy food items found to be scarce. The majority of the food stores in this rural townare convenience stores (72%) which is consistent with a previous study of retail food stores in rural environments finding convenience stores comprised 74 % of a rural food environment.33 The implication of living in an area where 72 % of the stores are convenience stores is important as previous literature shows that supermarkets are an important source for healthful eating due to the options they provide.21,33This study shows that convenience stores in this rural area provide limited availability of items such as skim/low-fat milk, whole wheat bread, fruits, and vegetables. Convenience stores also have higher prices compared to supermarkets. It is important to identify the burden on the community and impact of a food environment characterized by a majority of its food outlets existing as convenience stores. Obesity has been found to be more common in areas with a high density of small corner grocery stores and conveniences stores.34The composite scores which indicate overall food environment quality of each store were markedly different by store type. The mean composite score for supermarkets was 30 out of a possible 50 compared to 3.25 out of 50 for convenience stores, indicating that while the supermarkets did fairly well, convenience stores scored poorly on price, quality, and availability of healthy items.
4.2. Limitations
- The limitations of the study include the lack of external validity of the findings concerning distribution of store type, prices, quality, and availability to other rural food environments. The study area represents only one rural area and we cannot be certain that these trends will be consistent across all rural areas. These findings shed light on possible determinants of rural diet-related health which is important as information about availability and variety of healthy foods in rural food stores is needed as we make strides to adequately define what comprises a good quality rural food environment. While our study was thorough in identifying and surveying food outlets in the data collection area, the number of stores surveyed makes it difficult to generalize findings to other rural environments. The use of NEMS-S, one of only a few valid and reliable measures of spatial access to retail food stores, also highlights a limitation of using spatial measures of food environments in rural areas. Namely, rural food environments are diverse and may be more commonly defined by an absence of food stores all together. In addition, the use of NEMS-S focuses on retail food stores and may obscure the presence of other sources of fresh fruits and vegetables that may be available through alternative sources such as farmers markets, produce stands, or gardens which may be an important part of rural food environments.33 Lastly, use of spatial survey measures provide good descriptive summaries of local food environments, however rural adults may be more likely to travel further distances to acquire low-cost quality food.15Studies that build on this design should be conducted to determine if results from this study are a part of a general trend for rural settings. In addition, future work should focus on finding ways to supplement measures of spatial access such as NEMS-S with measures that incorporate other aspects of rural food environments. Future work that assesses multiple sources of food can help capture the impact that alternative food sources may have on food selection for rural residents.There are also difficulties in determining what constitutes an appropriate study area for food environment studies. This study used a relatively small spatial area consisting of a high density of food stores to ensure variability in data; however rural environments in general may have lower density of food outlets requiring even larger data collection areas, or different methods. Another important issue to keep in mind is that while using a direct method of assessment (ground-truthing) for identifying and surveying retail food stores gives a true picture of this food environment at a given point in time, food environments are subject to rapid change with stores opening and closing frequently, which is a limitation of this type of study. As exampled by the closing of an identified retail food store in the middle of this study, the food environment is always changing and researchers should consider how to address measurement and assessment in the face of dynamic food environments.
5. Conclusions
- Describing the attributes of food environments, with special emphasis on food environments of vulnerable, understudied populations including low income, minority and rural residents, highlights potential points of intervention and targeted health promotion efforts. This study highlights the spatial distribution of food stores within a small area of a rural food environment in North Central Florida. A high proportion of convenience stores compared to supermarkets and higher prices for food items in convenience stores compared to supermarkets characterize this town. These findings in a rural area are important because rural residents regardless of racial group are at higher risk of obesity compared to urban whites.35Of particular importance is the low availability of healthy options in convenience stores. However, a promising discovery is the finding that the few fruit items that were available for purchase in convenience stores were actually of high quality, indicating that these smaller stores have the ability to provide good quality fresh items. Action regarding this finding could improve access and serve as a possible route for increasing access to fresh produce and improving food selection in rural areas via convenience stores.Another important implication comes from the presence of the deep discount food store among the food stores surveyed. While this store can be identified as an important food source that improves access for low-income residents in this population, the lack of any fresh produce is an obvious limitation of this retail food source and provides another viable point of intervention that could drastically improve access for low-income rural residents who rely on this store as a source of healthy affordable food. Findings such as this provide proof of the high importance of food environment studies which identify attributes of food environments that may be leverage points for promoting healthy diets among rural residents.
 Abstract
 Reference
 Full-Text PDF
 Full-text HTML

