-
Paper Information
- Next Paper
- Paper Submission
-
Journal Information
- About This Journal
- Editorial Board
- Current Issue
- Archive
- Author Guidelines
- Contact Us
Food and Public Health
p-ISSN: 2162-9412 e-ISSN: 2162-8440
2013; 3(1): 1-11
doi:10.5923/j.fph.20130301.01
Aflatoxigenic Aspergillus flavus Outgrows Aspergillus niger in Perturbation Induced Competitive Interaction in Corn Kernels
 Abstract
 Reference
 Full-Text PDF
 Full-text HTML
Pratiti Ghosh 1, Paulomi Sarkar 2, Dilip Chatterjee 2, 3
1Department of Physiology, West Bengal State University, Kolkata, India
2Department of Food & Nutrition, West Bengal State University, Kolkata, India
3Centre for Agri-Business Science & Knowledge Transfer, Kolkata, India
Correspondence to: Dilip Chatterjee , Department of Food & Nutrition, West Bengal State University, Kolkata, India.
| Email: |  |
Copyright © 2012 Scientific & Academic Publishing. All Rights Reserved.
Contamination of food grains by carcinogenic Aspergillus flavus continues to pose a serious public health threat. Principle of Competitive Exclusion states that any two species competing for the same and limited nutrient resource typically cannot coexist. We have investigated the phenomenon of competitive conflict between carcinogenic Aspergillus flavus and nontoxic Aspergillus niger within corn kernel with and without perturbation experimentally and theoretically. Here we show that perturbation breaks down the Lotka-Volterra model based principle of competitive exclusion. We have found that A. niger competitively prevents the growth of A. flavus and consumes more corn protein reaching a higher growth level as shown in phase-plane where its values dive above the stable manifold in the stable node on Y-axis rather than on the X-axis. In contrast, when both grow in the presence of small perturbation, Lotka-Volterra model breaks down and A. flavus prevents the proliferation of A. niger, consuming more nutrient resource and reaching a higher growth level, diving below the stable manifold in the stable node on X-axis. Also, perturbation induces deviations from “Principle of Competitive Exclusion”, generating fluctuations and heterogeneity, changing the structural stability of phase-plane diagram and reflecting the typical second order phase transition. Thus the deterministic competitive interaction broadens into distribution of levels revealing intrinsic heterogeneity, which has hitherto been unexplored in the competitive conflict. This rigorous perturbation scheme with their equilibrium values and vibrational levels may help nullify natural perturbative effect in ecosystem and food industry. The experimental data fit well with the perturbation approach and offers to design effective strategy to free food grains from A. flavus and carcinogenic aflatoxin.
Keywords: Grains, Perturbation, Competitive Exclusion, A. niger, A. flavus, Lotka-Volterra Model
Cite this paper: Pratiti Ghosh , Paulomi Sarkar , Dilip Chatterjee , Aflatoxigenic Aspergillus flavus Outgrows Aspergillus niger in Perturbation Induced Competitive Interaction in Corn Kernels, Food and Public Health, Vol. 3 No. 1, 2013, pp. 1-11. doi: 10.5923/j.fph.20130301.01.
Article Outline
1. Introduction
- Aflatoxin Production in Food Grains:Aflatoxins are highly toxic, carcinogenic, mutagenic, teratogenic and immunosuppressive compounds and their presence in the food chain causes health hazard to humans and animals. Aflatoxins B1, B2, G1 and G2 are classified as Group I human carcinogens (1). Aspergillus flavus, A. parasiticus, and a few other Aspergilli which produce aflatoxins are microfungi that invade seeds and food grains of several crops in the field during harvest, storage, and processing. Aflatoxin production during storage can be prevented by reducing growth of Aspergillus flavus and by application of several synthetic chemical, natural phytochemical and physico-control methods (2), which are not significantly efficient and cost-effective. An alternative The two most important environmental factors that should be present for infection and aflatoxin contamination to occur are drought stress and temperature. There is higher incidence of aflatoxin in standing maize crops during monsoons and summers than in winters. In greenhouse experiment silk inoculation of corn grown between 32 and 35℃ had 73% infected kernels[10], whereas corn grown between 21 and 26℃ had only 2.5% kernels infected. The critical time required for high temperature to favor infection was between 16 and 24 days after inoculation at silking stage[11], when kernel moisture was approximately 30%. Interregional experiments showed that the highest aflatoxin levels were associated with the highest 3 months average temperature. Although damage is not a prerequisite for aflatoxin formation, the incidence of A. flavus and aflatoxin contamination were high in damaged kernels. Insect-damaged kernels provide an opportunity for the fungus to circumvent the natural protection of the integument and establish infection sites in vulnerable interior[12]. Under conditions of high temperature and low water activity, A. flavus and A. niger become very competitive and may become dominant fungal species in the soil or seeds. A. niger is more aggressive than A. flavus[6] when co-habiting in food commodities. Under favorable environmental conditions, these fungi compete with each other, as well as with other soil microorganisms and produce large amount of inoculum. They outcompete other microflora on seeds of corn, peanut, cotton and nuts. A. flavus is commonly found on corn ears during the growing season and aflatoxin contamination is a severe as well as chronic problem. Corn kernels become colonized with A. flavus, A. niger and others early after silking[3]. Spores of the fungus are brought to the kernel surfaces by insects. It is also found that extensive growth A.flavus occurs over the germ and growth in the endosperm occurs only in severely infected kernels. Lotka-Volterra Model and Perturbation:The serious implications of food grain contamination by carcinogenic fungi including Aspergillus flavus (13) continue to evoke interest in the present authors since the significant observations (14-17) that aflatoxigenic Aspergillus flavus and non-aflatoxigenic Aspergillus niger (A. niger) invade, grow and reproduce competitively within the grain.In such cases, persistent presence of A. flavus was found even when the latter is co-existing with A. niger in corn (18) kernel,deviating from the Principle ofCompetitive Exclusion which is based on 2-dimensional Lotka-Volterra growth Model and resultant Phase-Plane Diagram (22). This model entails that inter-specific competition may profoundly affect the population dynamics (23-25) of the competing species, A. flavus (26) by A. niger (27) and occurs when two species experience a depressed growth rate or a depressed equilibrium-population level because of their mutual presence in the same space and dependence for same and limited food resource. Hence, competence between two species is reciprocal causing observable decrease in growth, fecundity or survival of each species. Nevertheless, one species is more negatively affected than the other. However, the α (competition coefficient) of each species is not reciprocal. Moreover, competitive interaction does not take place unless the nutrient resource is limited, even if two species overlap completely in resource utilization. Hence such inter-specific competition is density dependent (28,29). This type of competition is termed indirect “Exploitative Competition” in which one species utilizes more quantity of the resource more efficiently than another species. The exploitative competition results in depletion of the nutrient resource by only one species (22).The present authors speculate that aforesaid phenomenon of persistence and promotion of greater incidence of A. flavus (30) might be the effect of natural introduction of perturbation in the food ecosystem changing the functioning of the competitive interaction. In fact, we assume that Lotka-Volterra model (22,31) thus breaks down and perturbation theory overrides and culminate in the persistent growth of A. flavus in the corn kernels with the resultant elaboration of carcinogenic aflatoxin posing a threat to public health (32).In the present paper, we addressed the presumption of breakdown of Lotka-Volterra model and introduced perturbation theory in the food system in terms of a very small increase in temperature as a useful approximation scheme, which consists in expanding the physical quantities that has been studied in powers of the coupling parameter of the problem. This perturbative expansion includes that the coupling parameter is small and dimensionless (33,34). Also perturbation mediated topology of phase plane diagram is studied to determine the nature of the competitive growth patterns of Aspergillus niger and Aspergillus flavus.
2. Materials and Methods
2.1. Experimental Analyses on Competition between A. niger and A. flavus following Lotka-Volterra Model, before and after Perturbation
2.1.1. Corn Kernels
- The corn kernels, e.g., maize grains (Zea mays L. cv. Ganga), initially free of fungal infection, were used in the present experiments.Inoculum: The inoculum was prepared by growing the organisms on potato-dextrose agar (PDA) slants (pH 5.6) for 10 days at 25℃ until well sporulated. The conidia of A. niger and A. flavus were harvested aseptically by dislodging the conidia from the surface of the slants with a sterile, inoculating loop and suspended them in 10 ml of sterile phosphate buffer solution containing 0.01% Tween-80. The conidial suspension of each test fungus thus obtained was further adjusted with sterile 0.05% Tween-80 to a final concentration of approximately 106 conidia/ml. The mycelial fragments remaining in the spore suspension were removed by filtering through four layers of sterile cheese cloth.
2.1.2. Artificial Co-inoculation of Corn Kernels with A. niger and A. flavus
- Corn kernels were distributed in several lots of 50 g quantities in perforated sterile polythene packets. 20 ml of conidial suspension of each test fungus (A. niger and A. flavus) was added into the packets. The inoculum was uniformly mixed with the grains using a rotary mixer. The final inoculum per gram of grain was then calculated. The final moisture content of the grains was reconstituted to 18% by adding the requisite quantity of sterile distilled water and mixing thoroughly for 1 hour. The inoculated grains in the packets were incubated under equilibrium relative humidity of 85% at ambient temperature (28-30℃) for 2 days to allow the fungi to penetrate the kernels.
2.1.3. Detection of A. niger and A. flavus Infection in Grains
- Detection of grains having internal growing fungi was done after every 10 days of interval till the experimental period of 90 days following the agar plate method. Approximately 100 kernels, cleaned, surface sterilized (by rinsing with 2% sodium hypochlorite for 1 min) and washed thrice with sterile distilled water, were placed aseptically on malt-salt-agar (10% NaCl in 2% malt agar, pH 6.5) in petridishes to detect and isolate the internal A. niger and A. flavus fungi. After 10 days of incubation at 30 ±1℃, fungi that grew out of kernels were isolated and identified as well as the percentage of infected kernels was calculated. The fungi isolated from the grains were maintained on PDA as stock cultures.
2.1.4. Effect of Temperature on Competitive Growth of A. flavus and A. niger
- The fungi were together incubated in corn kernel for 10 days at temperatures from 20 to 35℃ and their growth were recorded.
2.1.5. Estimation of Total Protein Content in Corn Kernel with Co-existing A. niger and A. flavus
- Crude protein in the dry matter of the grain samples was determined by Lowry’s method, every 10 days interval till the experimental period of 90 days (35).
2.1.6. Estimation of Fungal Growth (A. niger and A. flavus) by Measuring Fungal Cell Wall Chitin
- Chitin was estimated colorimetrically after every 10 days of interval till the experimental period of 90 days (36). The method is based on partial depolymerisation and extensive deacetylation of chitin by concentrated alkali at high temperature.
2.1.7. Moisture Content and Temperature
- In the present experiment, moisture content of the corn kernels was kept at 18%, in equilibrium with 85% relative humidity at 30℃ temperature till the experimental period of 90 days and was monitored regularly.All experiments were done in triplicate sets.
2.1.8. Experimental Analyses after Perturbation
- The persistent presence of A. flavus even when co-existing with A. niger in corn kernel, despite inter-specific competition between them (18), is addressed by giving perturbation in the system in terms of a slightly increased temperature in the corn kernels. Thereafter, the effect of this perturbation on the changes of the growth patterns of the competing A. niger and A. flavus within grain and the resultant change on the topology of the Phase Plane portrait is determined. We applied perturbation as a useful approximation scheme which consists in expanding the physical quantities in powers of the coupling parameters (small and dimensionless) of the problem (33,34).The temperature of the corn kernels was raised from the previously maintained 30℃ to slightly higher 35℃, 36℃ and 37℃, thus introducing a small perturbation in the system, as only small disturbance causes perturbation, which was maintained and monitored till the above mentioned experimental period. The results depicted here are in accordance with the perturbation at 35℃, the others being almost similar, their individual discussion is redundant.
2.2. Mathematical Model Description (Lotka-Volterra Phase Plane Diagram) and Competition between A. niger and A. flavus
- The experimental results obtained regarding the outcome of competition between A. niger and A. flavus within corn kernel, are studied by using a 2-dimensional Lotka-Volterra Logistic Population Growth Model and Phase-Plane Diagram (without Perturbation) having two species (A. niger and A. flavus) competing for the same and limited nutrient resource and same space (22,31). It is assumed that Lotka-Volterra competition model is a logistic growth model and the effect of one species on the other species is linear, the environment is stable and carrying capacities are constant. Modeling the effect of A. niger on the population growth of A. flavus (coefficient of competition) and vice versa is done by modifying the logistic growth model.In the present experiment, the competition between two species namely A. niger and A. flavus has been studied by beginning with the classic Lotka-Volterra model of competition. It has been assumed that both species are inoculated into food grain (corn kernel) and that they are competing for the same space and limited food supply (grain protein). All other complications like predators, seasonal effects, other environmental conditions and other sources of food were ignored. Moreover, the environmental conditions are considered to be stable and the carrying capacities are supposed to be constant. Then the main effect that has been considered is: when one particular species (A. niger) and another species (A. flavus) competitively grow and hence encounter each other within the corn grain, troubles begins. Sometimes one species (A. flavus) gets to eat the protein food within the corn grain, but more usually and most often, the another particular species (A. niger) competitively prevents the growth of the other species (A. flavus)) and begins to consume the limited food (corn protein). It is examined that these conflicts occur at a rate proportional to the size of each population. The specific theoretical model that incorporates these assumptions is written as:
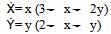 Where, x(t)= population of A. flavusy(t)=population of A. nigerThe basic equations that give rise to the above mentioned model is
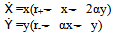 Where, α (competition co-efficient) = 1r+= Growth rate = 3r_= Growth rate = 2x= popularities size of A. flavusy= popularities size of A. niger and x ,y > 0If there were twice as much A. niger, the odds of A. flavus encountering A. niger would be twice as great. Furthermore, we assume that the conflicts reduce the growth rate for each species, but the effect is more severe for A. flavus.The coefficients have been chosen to reflect this scenario but are otherwise arbitrary. To find the fixed points for the system, one needs to solve x = 0 and y = 0 simultaneously and four fixed points are obtained following the equation and illustration by Strogatz: (0,0), (0,2), (3,0) and (1,1). To classify them, earlier workers computed the Jacobian:
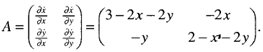 Now the four fixed points were considered in turn by earlier workers:
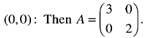 The eigen values are A = 3, 2 so (0,0) is an unstable node. Trajectories leave the origin parallel to the eigenvector for A = 2, i.e. tangential to v = (0,1), which spans the y-axis. (the general rule is: at a node, trajectories are tangential to the slow eigendirection, which is the eigendirection with the smallest. Thus, the phase portrait near (0,0) looks like Fig. 1.
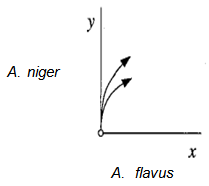 | Figure 1. Phase portrait near the unstable node at fixed point (0,0) |
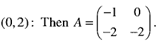 This matrix has eigenvalues A = -l,-2 as can be seen from inspection, since the matrix is triangular. Hence the fixed point is a stable node. Trajectories approach along the eigendirection associated with A = -1; one can check that this direction is spanned by v = (1,-2). Fig. 2 shows the phase portrait near the fixed point (0,2).
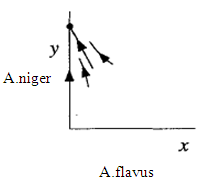 | Figure 2. Phase portrait near the stable node at the fixed point (0,2) |
 This is also a stable node. The trajectories approach along the slow eigendirection spanned by v = (3,-l), as shown in Fig. 3
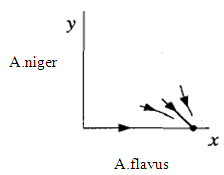 | Figure 3. Phase portrait near the stable node at the fixed point (3,0) |
 Hence this is a saddle point. The phase portrait near (1,1) is as shown in Fig. 4.
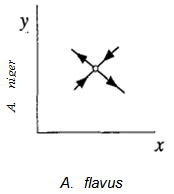 | Figure 4. Phase portrait at the saddle point near the fixed point (0,0) |
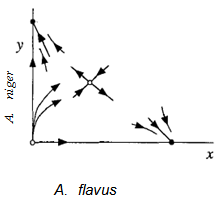 | Figure 5. Entire phase portrait combining Figures 1-4 |
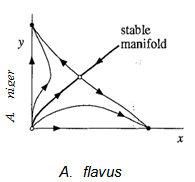 | Figure 6. Series of filled-up phase portrait depicting trajectories on the stable node on X-axis and Y-axis along with the stable manifold |
3. Results
3.1. Experimental Results in Agreement with the “Principle of Competitive Exclusion” based on Lotka-Volterra Model
3.1.1. Increase in Percentage Kernel Infection
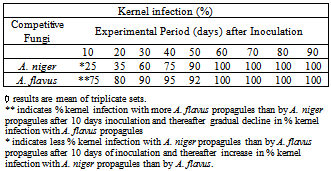
- The results shown indicate that when A. niger and A. flavus are within the corn kernel after co-inoculation, they start competing with each other to colonize the interior of the kernel. As shown in Table 1, 75% kernels are found to be infected more by A. flavus, than A. niger and 25% kernels showed more infection by A. niger than A. flavus after 10 days of the experimental period. The percentage kernel infection, (Table 1) more by A. niger propagules than by A. flavus propagules, increased significantly with the period of time and increased to 100% after 60 days, remained so thereafter till the end of test period of 90 days. Results shown in Table 1 indicate that A. niger competitively prevented colonization of A. flavus. (19,20)
|
3.1.2. Reduction in Protein Content in the Corn Grain
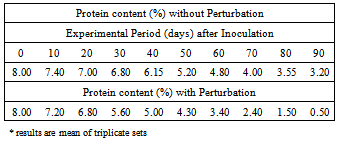
- A. niger starts competition with A. flavus for consumption of grain protein, and this competition increases with the period of time. The grain at the onset of experiment (0 day) has an initial protein content of 8.00%.The amount depletes gradually with the progress of time as well as with the increase of fungal growth, (more pronouncedly with the growth of A. niger) and depletes to 3.20% at the end of experimental period (Table 2). Thus A. niger, when co-existing with A. flavus within corn grain, wins the struggle and competitively consumes more grain protein.
|
3.1.3. Extent of Fungal Growth (Bistable) in the Grain
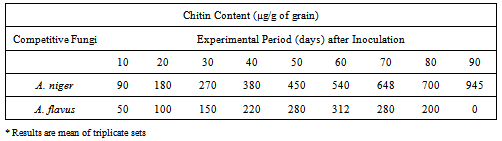
- To determine whether more protein resource consumed competitively by A. niger promoted more growth of A. niger and to ascertain whether this consumption of more nutrient by A. niger is due to the increased competition as well as increased aggressiveness of A. niger to compete with the aflatoxigenic A. flavus, the internal growth of A. niger and A. flavus within corn kernel (in terms of their cell wall-chitin content) is studied and quantified. Table 3 indicates progressively higher growth of A. niger (than that of A. flavus) in terms of its chitin content which continuously increases with time when co-existing with A. flavus within grain. It rises to 90 µg/g grain after 10 days of inoculation and finally increases to the level of 945 µg/g of grain at end of the experimental period of 90 days, indicating continued mycelial growth of A. niger within the grains. In contrast, A. flavus growth increases much slower than that of A. niger and from 50 ug chitin per gram of grain (after 10 days of inoculation), it finally reduces to 0 µg/g of grain (Table 3). These results confirm that the profound and gradual rise in the growth of A. niger by competitively inhibiting the protein consumption (Table 2) culminate in the competitive exclusion of A. flavus from corn kernel by A. niger (Table 3).
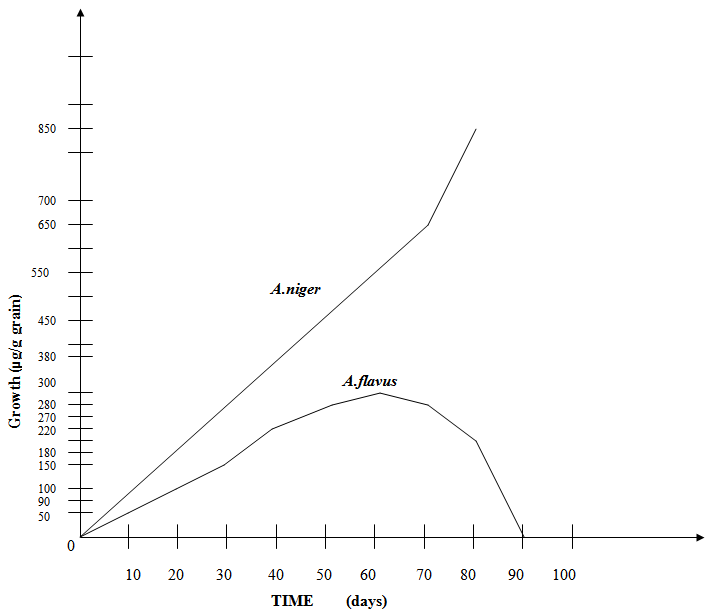
3.1.4. A. flavus Outgrows A. niger at Higher Incubation Temperature
- The line graph in Fig. 7 shows that at 20℃, A. niger is more proliferative than A. flavus, but its growth reaches a plateau at 30-35℃ whereas there is an abrupt phenomenal growth of A. flavus.
3.1.5. Nature of Competition between A. niger and A. flavus follows Proportional Increase and Subsequent Competitive Exclusion of A. flavus
- As illustrated in Table 3, the competitive conflict occurs at a rate proportional to the size of each population of A. niger and A. flavus. When the population size of A. niger became twice as large increasing its growth in terms of chitin from 90 µg/g of grain to 180 µg/g of grain, the corresponding odds of A. flavus encountering A. niger becomes twice as large as is shown by its two-fold increase in growth from 50 µg/g of grain to 100 µg/g of grain. Similarly, when growth of A. niger within grain rises 1.5 times from 180 µg/g to 270 µg/g of grain, A. flavus also correspondingly grows 1.5 times from 100 µg/g to 150 µg/g of grain. In the same principle of proportional increase, the population size of A. niger increases 1.2 times showing a rise from 450 µg/g to 540 µg/g with the consequence of corresponding 1.2 times increase of chitin growth of A. flavus from 260 µg/g to 312 µg/g of grain. However, after 60 days of experiment, with the 1.2 times increase in chitin growth of A. niger (from 540 µg/g to 648 µg/g), there is a consequent proportional 1.2 times decrease in chitin growth (312 µg/g to 260 µg/g). This phenomenon may be attributed to the gradual depletion of grain protein due to the competitive growth of both the species leading to the competitive exclusion of A. flavus by A. niger from corn grain. (26,27,30)
3.2. Experimental Results Revealed Breakdown of Lotka-Volterra Model with Perturbation
3.2.1. Reduction in Protein Content in the Corn Grain
- The amount of protein depletes progressively with the increase of growth of A. flavus in sharp contrast with the non-perturbative Lotka-Volterra approach, indicating that perturbation alters the nature of competitive growth causing Aspergillus flavus to win the struggle against A. niger.
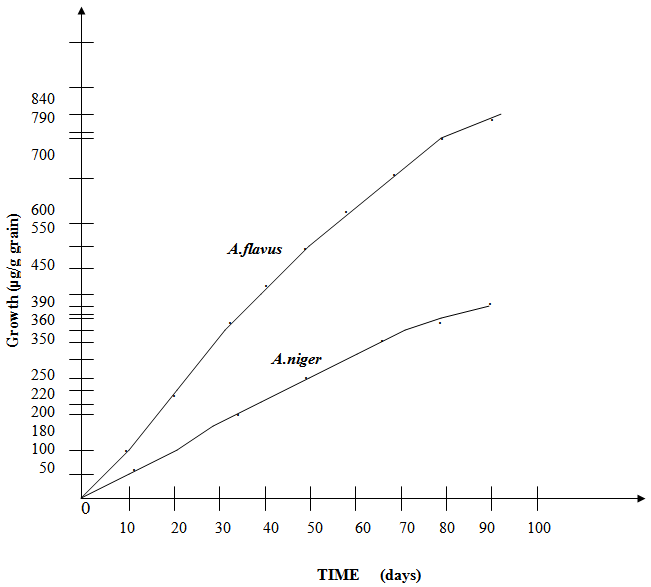
3.2.2. Extent of Fungal Growth in the Grain
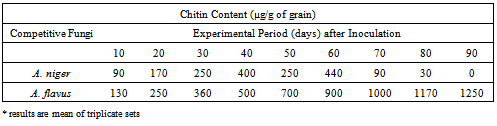
- More protein resource consumed competitively by A. flavus promotes its growth more and this higher consumption by A. flavus is due to the increased competition as well as increased aggressiveness to compete with A. niger (Table 3 & 4) showing that perturbation has increased the competitiveness of A. flavus which outgrows and excludes A. niger. This is in correlation with higher competitive consumption of protein by A. flavus (Table 2) and higher competitive growth of A. flavus (Table 4).
3.2.3. Nature of Competition between A. niger and A. flavus does not Follow Proportional Increase and cause Subsequent Competitive Exclusion of A. niger
- As illustrated in Table 4, the nature of competitive conflict does not occur at a rate proportional to the size of each population of A. niger and A. flavus.
|
|
3.3. Theoretical Analyses is in Agreement with “Lotka-Volterra Model Equations”
- Phase Plane Portrait of Lotka-Volterra Model system and Competitive Exclusion of A. flavus by A. niger: The obtained phase plane portrait (Fig.8) reveals a remarkable biological phenomenon and interpretation of competition between A. niger and A. flavus, suggesting that A. niger drives A. flavus to extinction since the trajectories or growth values starting above the stable manifold lead to eventual extinction of A. flavus. If those trajectories were below the stable manifold, it would have led to the eventual extinction of A. niger which however did not happen. This dichotomy confirms the Principle of Competitive Exclusion, because A. niger and A. flavus competing for the same and limited corn protein resource typically could not co-exist (Fig. 8) (28,29).Hence, the phase-plane diagram based Lotka-Volterra model fits very well with the present experimental results. Moreover, the comparison between the theoretical modeling and the experimental values is quite satisfactory.
3.3.1. Competitive Conflict and Growth of A. niger and A. flavus is Proportional to the Size of Population of each Species
- These conflicts occur at a rate proportional to the size of population of each species namely A. niger and A. flavus. When there are twice as much A. niger, the chances of A. flavus encountering A. niger is twice as great (Fig. 8).
3.3.2. Growth Rates of Both Species become Reduced during Competitive Interaction
- This competitive conflict reduces the growth rate of both A. niger and A. flavus (Fig. 9), as compared to the individual species without competitive interaction (Guo et al, 1995) (24). The growth rate of A. flavus is affected much more than that of A. niger (Fig. 9) when in competitive conflict. (Duarte et al, 1998; Goh, 1976).
3.4. Perturbation by Theoretical and Experimental Approach Breaks Down the Lotka-Volterra Model and Changes the Nature of Principle of Competitive Exclusion
- Perturbation changes the nature of Lotka-Volterra based Topology of Phase-Plane Diagram as well as competitive interaction and resultant growth pattern of A. niger and A. flavus, (Fig. 10) confirming that perturbation induces break-down of the said model.
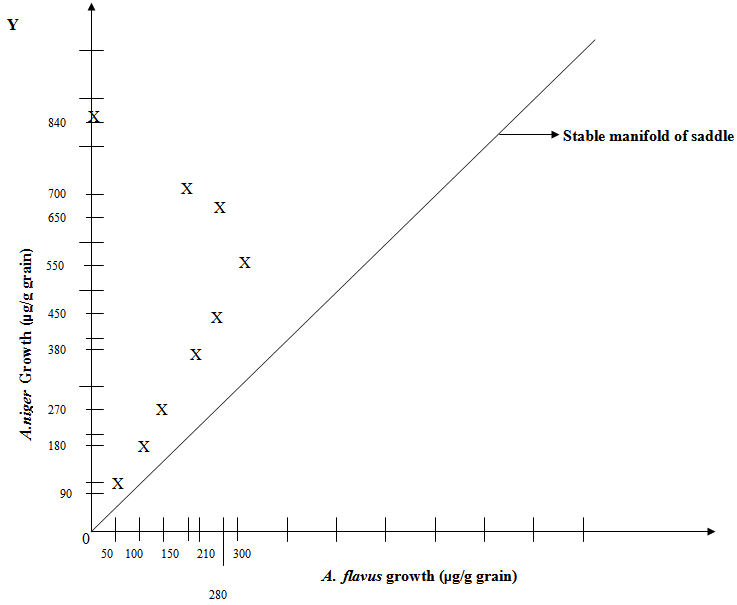 | Figure 8. Phase-Plane Diagram of Growth Competition between A. flavus and A. niger (within Corn Kernel), where A. niger Competitively Excludes A. flavus (without Perturbation) |
 | Figure 9. Competitive Interaction shows Reduced Growth Rate of Two Fungi |
 | Figure 10. Growth Rate of Two Individual Fungi without Competitive Interaction |
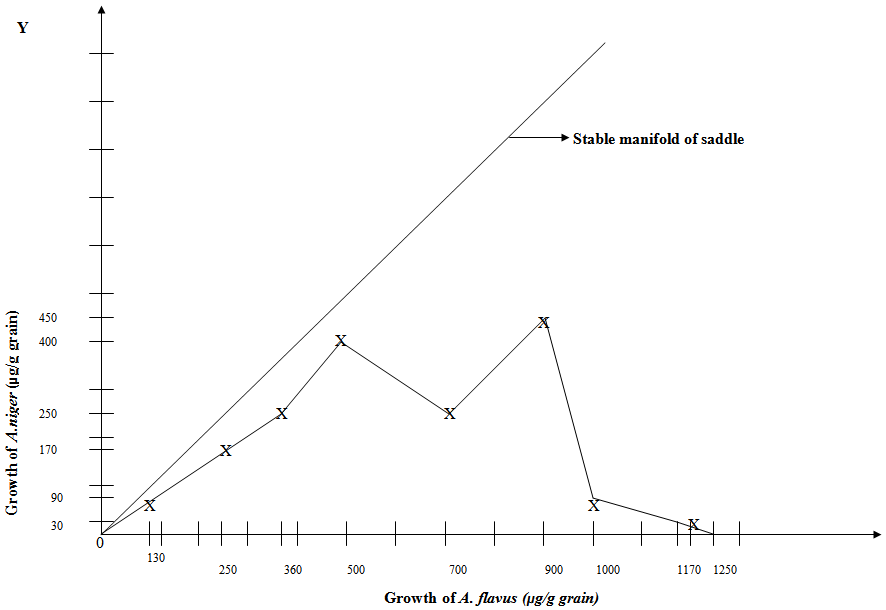 | Figure 11. Phase-plane Diagram of Competition between A. flavus and A. niger (within Corn Kernel) Competitively excluding A. flavus when given Perturbation |
- It is evident that A. flavus competitively outgrows and excludes A. niger with perturbation. The results reveal the insidious aspect of perturbative approach that makes A. niger incapable of competitively inhibiting and excluding carcinogenic A. flavus (in contrast to the normal Lotka-Volterra model) from the corn grain (Table 4 and Fig. 11). From the experimental data obtained after perturbation (Table 4) and the common sense of the theoretical model character, the rest of the phase portrait only partially take the shape as is shown in Fig.11. Some of the trajectories (A. flavus) starting near the origin, approach the stable node on the X-axis, while others (A. niger) approach the stable node on the Y-axis, showing the cause of the inversion. When both fungi grow in the presence of small perturbation, the phenomenon of inversion due to perturbation leads to the breakdown of Lotka-Volterra model and A. flavus prevents the proliferation of A. niger. The former consumes more nutrient resource and reaches a higher growth level and the trajectories dive in below the stable manifold in the stable node in the X-axis and the A. niger experience a more depressed growth rate and a more depressed equilibrium population level. This exploitative competition in which A. flavus utilizes more of the resource more efficiently than A. niger, results in depletion of the nutrient resource by A. flavus. More protein resource consumed competitively by A. flavus promotes its growth and this higher consumption by A. flavus is due to the increased competition as well as increased aggressiveness to compete with A. niger, showing that perturbation has increased the competitiveness of A. flavus which cause inversion and thus outgrows and excludes A. niger.
3.4.1. Perturbation Causes Heterogeneity (Peaks), Fluctuations and Changes in Topology and Stability of Phase-Plane Diagram
- Interestingly, the perturbation introduces some fluctuations and heterogeneity (peaks) and changes the structural stability of Phase-Plane Diagram (Fig. 11). The deterministic competitive interaction broadens into a distribution of levels when perturbation is introduced into the system. This unravels the intrinsic heterogeneity in the competitive conflict between these two species, (Fig. 11) which was invisible in Lotka-Volterra model. This has important bearing on the understanding of the perturbation technique apart from Lotka-Volterra model in perspective of competitive interaction between A. niger and A. flavus co-existing in a same space with limited nutrient resource (37,38).
3.4.2. Changed Dynamics of Perturbative Competitive Conflict
- With perturbative approach, the competitive growth of either A. niger or A. flavus is not found to be proportional to the size of population of each species (Fig. 11) which is in sharp contrast to the hallmark of Lotka-Volterra model (Fig. 10 and Table 3).
3.4.3. Dichotomy
- After perturbation, the trajectories or values starting below the stable manifold lead to eventual extinction of A. niger (Fig.11) while those trajectories or values above the stable manifold occurring without perturbation, lead to the eventual extinction of A. flavus (Fig. 8) showing a dichotomy that confirms again the “Principle of Competitive Exclusion” of either A. niger or A. flavus.
4. Discussion
- In well agreement with Lotka-Volterra model, A. niger competitively prevents the growth of A. flavus and consumes the more of the limited corn protein as well as reaches a higher growth as shown in Phase Plane diagram, which depicts that the values dive above the stable manifold in the stable node on Y-axis indicating the higher growth of A. niger than that of A. flavus on the X-axis. However, when perturbation is applied, A. niger and A. flavus competitively grow and hence encounter each other, A. flavus competitively preventing the growth of A. niger, breaking down the Lotka-Volterra model nature of competitive exclusion. A. flavus consumes more of the limited corn protein as well as reaches a higher growth level, causing accumulation of carcinogenic aflatoxin in corn kernels as shown in Phase Plane which depicts that the values dive below the stable manifold in the stable node on X-axis. This indicates the higher growth of A. flavus than that of A. niger on Y-axis and eventual competitive exclusion of A. niger (22,28,29) posing a serious threat to human consumers, as aflatoxin in food grains is destroyed only beyond 300°C approximately.The perturbative expansion completely gains its credibility because the coupling constant cannot be scaled out of the theory. The essence of the perturbation in Lotka-Volterra model lies in assuming this parameter to be significantly small, which then entails a dramatic deviation in the nature of competitive exclusion of one of the co-existing fungi, in contrast to what our commonplace notions would justify in case of non-perturbative Lotka-Volterra model. The emerging solution by perturbative approach turns out to be quite impressive since a simple trick to perturb the “Principle of Competitive Exclusion” yields remarkable transformation. The delicate issue emanating from the use of perturbation theory is encountered by A. flavus in the form of fluctuations and heterogeneity in their growth, which reminds us the typical second-order phase transitions that involve fluctuations in their order parameters. This perturbative approximation is trustworthy since the fluctuations are small which implies that the fluctuations are not correlated over a long range and hence the correlation length does not diverge, as well as the perturbation approach does not break down. This perturbation causes deviations from the typical competitive exclusion principle based on Lotka-Volterra model and excludes A. niger but promotes A. flavus because the expansion parameter such as spatial dimensionality provides exact solutions for the critical components in Lotka-Volterra equations. Thus our present work has introduced perturbation in the field of “Principle of Competitive Exclusion” where it serves a novel purpose and hence will evoke interest in this infant subject. The results reported here are sufficiently encouraging and attention should be paid particularly to developing a systematic rigorous perturbation scheme for solving strong potential where fluctuations below the stable manifold occur around their well-defined equilibrium values with accompanying vibrational and rotational levels. Biocontrol of aflatoxin production by using such bio-competitive agents might serve as agricultural or storage facilitator (39). This biocontrol strategy significantly reduces the growth of A. flavus and aflatoxin contamination in food grains by applying non-aflatoxin-producing strains of the same species that competitively exclude aflatoxin producers (40). Such prevention may result from competition for space and nutrients in general and also competition for nutrients needed for aflatoxin production, but not for growth and also synthesis of anti-aflatoxigenic metabolites by co-habiting microorganisms. The experimental data fit well with the perturbation approach and offers to design effective strategy to free A. flavus and carcinogenic aflatoxin from food grains.