-
Paper Information
- Next Paper
- Previous Paper
- Paper Submission
-
Journal Information
- About This Journal
- Editorial Board
- Current Issue
- Archive
- Author Guidelines
- Contact Us
Food and Public Health
p-ISSN: 2162-9412 e-ISSN: 2162-8440
2012; 2(6): 219-227
doi: 10.5923/j.fph.20120206.06
Nutrition Knowledge, Diet Quality and Nutritional Status of People Living with HIV (PLHIV) in Ghana
 Abstract
 Reference
 Full-Text PDF
 Full-Text HTML
Christina A. Nti , Jane Hayford , Clara Opare-Obisaw
Department of Family and Consumer Sciences, University of Ghana, Legon, Ghana
Correspondence to: Christina A. Nti , Department of Family and Consumer Sciences, University of Ghana, Legon, Ghana.
| Email: |  |
Copyright © 2012 Scientific & Academic Publishing. All Rights Reserved.
The study aimed at investigating the influence of nutrition knowledge and dietary practices on the nutritional status of people living with HIV (PLHIV). In a cross-sectional survey, one hundred and ten adults, comprising 60 females and 50 males infected with HIV were purposively selected and studied using a combination of methods. The study was conducted at the Koforidua Central Hospital in Ghana. The instruments used for data collection included a standardized questionnaire close and open-ended questions, a Food Frequency Questionnaire and a 24-hour-recall dietary assessment method. Weights and heights measurements were used to derive BMIs to assess the nutritional status of the respondents. The Statistical Package for Social Sciences (version 11) and ESHA-FPRO software (version 6.2) were used to analyze the data. The results showed that most of the respondents (91%) had fair to adequate knowledge of nutrition. Ninety-five percent (95%) of the respondents ate three or more times a day and most (85%) of them were not on any special diet. The diet quality of most (91.8%) respondents was rated fair to poor, with 50% having poor diets. The diets of the respondents were generally low in calories and folate. Two-thirds of the respondents had normal BMIs. A negative correlation, although not statistically significant, existed between nutrition knowledge and diet quality. There was also a positive correlation between nutrition knowledge and nutritional status. A significant negative correlation was observed between the quality of diets of respondents and their nutritional status. Based on the findings, it was concluded that nutrition knowledge did not influence the quality of respondents’ diets to a large extent but diet quality determined nutritional status.
Keywords: PLHIV, Diet Quality, Nutrition Knowledge, Food Consumption Patterns, Nutritional Status, Ghana
Cite this paper: Christina A. Nti , Jane Hayford , Clara Opare-Obisaw , "Nutrition Knowledge, Diet Quality and Nutritional Status of People Living with HIV (PLHIV) in Ghana", Food and Public Health, Vol. 2 No. 6, 2012, pp. 219-227. doi: 10.5923/j.fph.20120206.06.
Article Outline
1. Introduction
- Human Immunodeficiency Virus and Acquired Immunodeficiency Syndrome (HIV /AIDS) is an infectious disease that presents a global problem. HIV is a virus that attacks the immune system and leaves its victims defenseless against opportunistic infections and disorders from which most people not affected are protected. The virus gradually destroys CD4+ T-cells in the human body. These cells are part of the body’s immune system which fight infections and various cancers[1-3]. The estimated number of persons living with HIV worldwide in 2007 was 33.2 million, a reduction of 16%, compared with the estimate published in 2006 in which 39.5 million persons worldwide were living with HIV and AIDS[4, 5]. Both HIV prevalence rates and the numbers of people dying from AIDS vary greatly between African countries. Ghana’s national HIV prevalence rate dropped from 3.6% in 1998 to 3.1% in 2003. However, the infection rate increased by 50% between 2003 and 2007. The 2007 HIV Sentinel Survey (HSS) concluded that prevalence was highest in the Eastern Region (4.9%) followed by the Western Region with 4.3%. Northern region had the lowest rate of 1.3%. Nearly 90% of the estimated 400,000 Ghanaians living with HIV/AIDS were between the ages of 15 and 49 years[6, 7].HIV causes changes in nutritional status, including loss of appetite, weight loss and malnutrition. Thus, HIV can compromise the nutritional status of infected individuals and consequently worsen the effects of the disease (8). Good nutrition is necessary for good health and development, and the interaction of infection and malnutrition is well-documented[8]. Better nutrition means stronger immune system, less illness and better health. Healthy people are stronger, more productive and more able to create opportunities to gradually break the cycles of poverty and hunger in a sustainable way[9]. Individual nutritional status influences the impact of morbidity and mortality irrespective of the disease progress[3]. Adequate nutrition is vital for the health and survival of all individuals regardless of HIV status. Therefore, all people regardless of their level of education, social and economic status or geographical location need nutrition education for improved nutrition[10].Providing sufficient food to meet people’s basic needs for health, growth and development has been a long-standing challenge for African countries. This challenge is further exacerbated by the emergence of HIV/AIDS. In Ghana, the Ministry of Health (MOH) in collaboration with WHO, UNAIDS and USAID, has set up an implementing policy regarding the monitoring and evaluation of food consumed by HIV/AIDS patients. These bodies have developed modules including nutrition, care, treatment and support for HIV-infected people in resource constraint settings. The impact of these policies is yet to be evaluated. Prior empirical evidence supports the proposition that there exists a strong relationship between nutrition knowledge, dietary practices and nutritional status. People with HIV/AIDS frequently experience malnutrition and underweight irrespective of nutrition knowledge and good dietary practices[8]. This study, therefore, sought to investigate the relationships between nutrition knowledge, dietary practices and nutritional status of PLHIV in Ghana. The findings would help the Ministry of Health, National Aids Control Programme (NACP) and other NGOs in Ghana concerned with HIV and AIDS issues to overcome some of the challenges they face in meeting the nutritional needs of PLHIV and controlling weight loss or wasting in HIV patients.
2. Materials and Methods
2.1. Study Area, Population and Design
- The study, which was a cross-sectional survey, was conducted in Koforidua, the Eastern Regional capital in Ghana. Koforidua has a population of 87,315 as at 2000 National Census and it is a commercial center for the region. It was selected for the study because it has been documented to have the highest rate of HIV/AIDS prevalence since the emergence of the disease in Ghana. The target population comprised all adults living with HIV who attended clinic at the Koforidua Central Hospital so all HIV infected persons aged 18 years and above reporting for regular clinic visits within the survey period were eligible for inclusion. The minimum age selected was 18 years because it is the official age of attaining adult status in Ghana. HIV adults attending clinic for the first time during the study period, those who were too weak to speak, stand or sit for long and those with full blown Aids were ineligible to participate in the study.
2.2. Sample Size and Sampling Procedure
- An expected sample size for the study was 200 adults infected with HIV with an acceptable minimum of 91. The expected sample size was based on 600, the estimated HIV prevalence among Koforidua population (from hospital records). The purposive sampling procedure was used to select participants who were willing to take part in the study. Therefore those attending the Clinic who met the eligible and inclusion criteria were selected until the sampling period spanning five week days for three months was over. Although a sample size of 200 was targeted only one hundred and ten HIV infected adults consented to participate in the study.
2.3. Instrument for Data Collection
2.3.1. Nutrition Knowledge
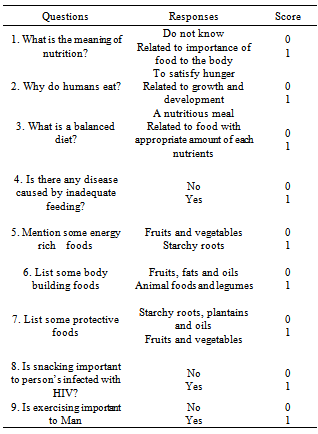
- A standardized questionnaire with both close and open-ended questions was designed to collect information on respondents’ demographic characteristics, nutrition knowledge and dietary practices. Nutrition knowledge was assessed using a scoring system based on responses to 9 nutrition-related questions as shown in Table 1. A rating scale of adequate and inadequate knowledge of nutrition was obtained using the scores 0 and 1. The maximum attainable score was 9 and the minimum was 0. The scores obtained were divided into terciles. Individuals with scores between 0-3 were classified as having poor nutrition knowledge, those with scores between 4-6 had fair knowledge and those with scores of 7-9 had adequate nutrition knowledge.
|
2.3.2. Dietary Intakes, Quality and Diversity
- A food frequency questionnaire and the 24-hr dietary recall method were used to assess food consumption patterns and quality of diets. The food frequency questionnaire was used to assess the frequency of consumption of various Ghanaian foods organized under the Ghana six food groups. The frequency of use category included daily, weekly, monthly, occasionally or never. This was to provide descriptive information about the respondents’ usual food consumption patterns. The 24-hour dietary recall was used to derive an estimate of the energy and nutrient intakes of the respondents. Each respondent was asked to recall all the foods and beverages consumed within the previous 24 hours. The recall included main meals, snacks, beverages as well as vitamin and mineral supplements consumed from rising up to going to bed.
2.3.3. Nutritional Status
- Heights and weights of respondents were used to calculate their Body Mass Indices (BMIs) to determine their nutritional status. Respondents were classified as underweight (18.50 kg/m2), normal (18.50-24.99 kg/m2), overweight (≥25.00-29.99 kg/m2) and obese (≥30.00 kg/m2) according to WHO[11] classification.
2.3.4. Data Analysis
- The energy and nutrient contents of the foods consumed were calculated using the Ghana Food Composition Tables[12] and ESHA-FPRO software (version 6.2). The Recommended Nutrient Intakes (RNIs) by FAO/ WHO[13] was used as the reference data. Mean nutrient intakes and percentages of RNI were generated to evaluate the adequacy of the diets. The data from the Food Frequency Questionnaire and the standard were analyzed using Statistical Package for Social Sciences (SPSS 11.0). The Pearson’s Correlation Coefficient was used to determine the correlations between nutrition knowledge, dietary practices and nutritional status at 5% level of significance.
2.3.5. Ethical Approval
- Permission was sought from the Eastern Regional HIV coordinator and the Doctor-in-charge of the HIV Unit to use the HIV patients for the study. Ethical clearance was also obtained from the Ethical Review Board of the School of Allied Health Sciences, University of Ghana (Ethical Identification Number: NMIMR-IRB CPN 031/07/08). Patients consented to be part of the study after the study objectives had been explained to them in a language they understood. They agreed to be interviewed and measured for anthropometric data.
3. Results and Discussion
3.1. Socio-demographic Characteristics of Study Sample
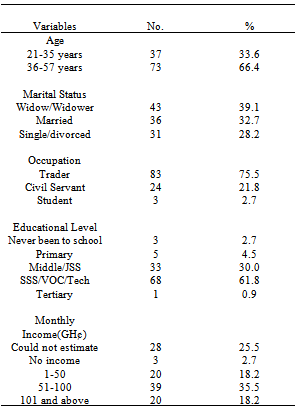
- Of the 110 participants, 54.5% were females and 45.5% were males. Most of the respondents (87.3%) were Christians and the rest were Moslems and Traditionalists. About a third of the respondents (35.5%) were Akans and the rest included Ga/Adangbes (30%), Ewes (26.4%) and Hausas (8.2%). Respondents were aged between 21 and 57years with about two-thirds (66.4%) aged 36 years and above. The results of this study imply that the HIV prevalence was higher among 36-57years age group in the study area, slightly older than what was suggested by NACP[7]. The reason for this could be due to the fact that the older people may have accepted their HIV status and thereby presented themselves for registration at the clinics. The younger people on the other hand, may not have fully accepted their status so they have been reluctant to register at the clinics hence the lower prevalence among this group in the study sample. About a third of the respondents were married (32.7%) and widowed (39.1%) respectively and 22.7% were single. Over two-thirds of the married respondents were living alone because their spouses ran away from home due to the stigmatization associated with the disease. With the exception of 3 respondents who were students, the rest were employed with majority (75.5%) of them in the informal sector. Trading was the main occupation of the respondents. Almost all the respondents had some form of education, with 62% having vocational, technical or secondary education. The average monthly income of the respondents was GH¢ 74.7 as shown in Table 2 (1.2 GH¢ is equivalent to 1USD).
|
3.2. Nutrition Knowledge of Respondents
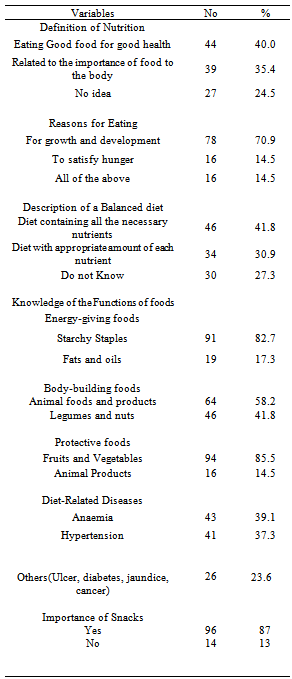
- Most of the respondents (91%) had fair to adequate knowledge of nutrition. Seventy five percent (75%) defined nutrition as either the consumption of good food for the proper functioning of the body or related it to an expression of the importance of food to the body. Again, majority of the respondents (70.9%) indicated that people eat for growth and development. These responses were indicators that most respondents actually knew why food was eaten or had a fair knowledge about the primary functions of food in humans. The general description of a balanced diet by the respondents was also fairly good, with 72.7% giving a good description of a balanced diet (Figure 1 and Table 3).
|
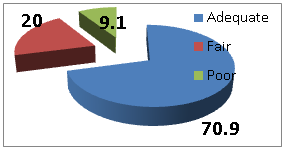 | Figure 1. Respondents’ Nutrition Knowledge |
3.3. Dietary Practices of Respondents
|
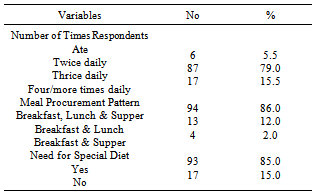
|
|
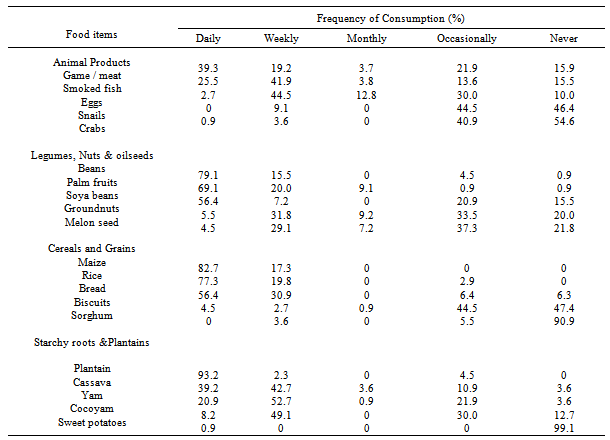
3.4. Consumption of Foods from the six Food Groups
- The main foods that are available in the area and which dictate consumption patterns are shown in Tables 5 and 6 using the Ghana six food groups namely: starchy roots and plantain, cereals and grains, animal products, legumes, nuts and oil seeds, fruits and vegetables, fats and oils.
3.4.1. Animal Products; Legumes, Nuts and Oil seeds and Staples
- The responses revealed that meat and smoked fish were the main sources of animal protein consumed daily by most respondents. These were mainly consumed in soups and stews as well as hot pepper sauces as an accompaniment to the major staples. The most frequently consumed legumes were cowpeas and soybeans. Beans/cowpeas were consumed mainly in stews and as waakye (boiled rice with beans), whereas soya beans were mostly consumed as flour mixed in cereal meals. A third consumed groundnuts on daily and weekly basis in soups and in the roasted form as snacks. Beans, groundnuts and soya beans are good vegetable sources of protein and cheaper than animal products. Maize and rice were the most frequently consumed cereals on a daily basis. Maize was consumed primarily in the form of kenkey (fermented maize dough dumpling), banku (cooked fermented maize and cassava dough) and as porridge. Rice was consumed mainly boiled and served with stew or as waakye, omotuo (cooked rice balls) and rice porridge. Bread which now features very much in the Ghanaian diet was frequently consumed by 56.4% as wheat bread daily. Sorghum was less frequently consumed probably because it was not cultivated in the study location. Maize, unpolished rice and wheat are examples of fibre-rich carbohydrate-rich foods that reduce the risk of gastrointestinal diseases such as colon cancer and prevent hemorrhoids and constipation (Table 5).Almost all the respondents (93.2%) consumed plantain on daily basis. This is not surprising because plantain is generally cheaper than other staple foods and common in the study area. Cassava, yam and cocoyam were consumed on weekly and daily basis. These are mainly carbohydrate-rich foods which provide energy to the body. The root and tuber crops as well as plantain were eaten mainly in the form of fufu (pounded mixture of cooked cassava with plantain or cocoyam), as ampesi (boiled root, tuber or plantain), gari (roasted fermented cassava meal) and as kokonte (cooked dried cassava flour). Sweet potatoes do not form a major part of the normal diet of most respondents in the area.
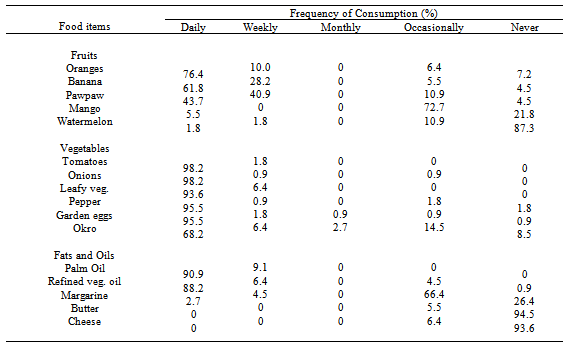
3.4.2. Fruits and Vegetables; Fats and Oil
- Orange, banana and pawpaw were consumed by respondents on daily and weekly basis. Because some fruits are seasonal, mangoes, avocado pear and watermelon were consumed occasionally. The respondents did not consume lime and lemon because it interfered with their medications and enhanced diarrhoea. With respect to vegetables, tomatoes, onion, pepper, green leafy vegetable, garden eggs and okro were consumed on a daily basis by almost all the respondents mainly in soups, stews and sauces as accompaniments to staple dishes like kenkey, banku or gari, cooked cereals, tubers and plantains. Fruits and vegetables are good sources of vitamins, minerals and fiber. Vitamins help to build the body’s immune system in order to fight diseases and infections.Among the fats and oils, palm oil and refined vegetable oils were the most frequently consumed. Palm oil was used mainly in stews and also served as an accompaniment to cooked beans and gari. This is encouraging since palm oil is a rich source of pro-vitamin A which is crucial for vision and maintaining healthy cells, especially skin cells. Refined vegetable oils though very expensive, were consumed on daily basis by 88.2% of the respondents (Table 6).
3.5. Diet Quality of Respondents
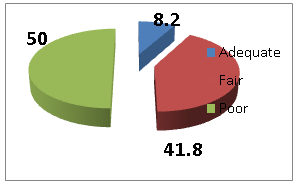 | Figure 2. Diet Quality of Respondents |
|
3.6. Energy and Nutrient intakes of Respondents
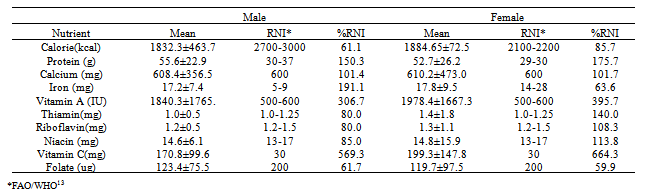
- The mean energy and nutrient intakes of the respondents by sex are presented in Table 7. The energy needs were not met by both sexes with the males having lower energy intakes than the females. The calorie intakes for males and female were 61.1% and 85.7% respectively of the RNI. These intakes are far below what was recommended by WHO[8] which suggested that energy intake be increased by 20% to 30% above RNI for adults to help maintain body weight in HIV persons. It was surprising that the respondents could not meet the recommended energy requirements since most Ghanaian diets are carbohydrate-based[18]. The low energy intakes give cause for concern because the respondents’ HIV status requires energy enough to support weight recovery and to maintain weight.With respect to protein intakes, no significant differences were observed between male intakes (55.6g/day) and female intakes (52.7g/day). Both groups exceeded the RNI. It is possible that most of their proteins were from plant sources namely legumes, nuts and oil seeds as these were consumed on regular basis. At the time of the study, there was no document specifying protein intakes for PLHIV. It is however important to note that when energy intake is insufficient, protein is used to provide the body with energy which probably was the case in this study sample.Calcium intakes for both the males and females slightly exceeded the RNI with a mean intake of 610.2mg for females and 608.4mg for males. Consumption of legumes and small whole fishes, which are good sources of calcium, might have contributed to the high intake of the mineral. Iron intakes of the males (191.1%) far exceeded the RNI but that of the females (63.6%) was lower than the recommended. This is a problem that must be addressed because females are vulnerable to anaemia and other iron deficiency disorders. Female respondents must be encouraged to consume more iron-rich foods to improve their iron intakes. Low intakes of iron could lead to increased viral load, reduced physical growth, impaired mental coordination and increased fatigue among HIV-infected persons[19]. Intakes of vitamin A for both sexes far exceeded the RNI. Vitamin A is good for maintenance of vision, skin, the digestive tracts and immune function. Although it is satisfying to note that all the respondents met and exceeded their Vitamin A intakes, an observational study by Tang et al.[20] found that very high intakes of vitamin A (>20,000 IU/Day) were associated with increased mortality in HIV adults. While it may be advisable that the respondents reduce their vitamin A intakes to the required levels, it is important to note that the sources of vitamin A for the study sample were mainly from precursors in palm oil and vegetables consumed daily. Again both the males and the females exceeded their Vitamin C requirements. Vitamin C is vital for maintenance and repair of connective tissues and promotion of good health. The B-vitamins intakes for the males were lower than recommended. Females however, exceeded the RNI. Folate intake for both males (61.7%) and females (59.8%) were low. Generally, the overall nutrient intakes of the respondents were adequate except for folate and energy.
3.7. Nutritional Status of Respondents
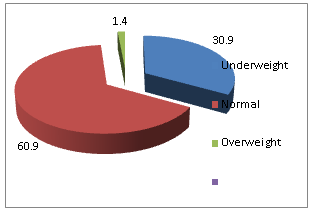 | Figure 3. Nutritional Status of Respondents |
3.8. Relationships between Nutrition Knowledge, Diet Quality and Nutritional Status
- A negative correlation, although not statistically significant, existed between nutrition knowledge and diet quality of the respondents (r = -0.04; 0.681), an indication that in this study sample nutrition knowledge is independent of the quality of diet. This finding is consistent with the work of Zifferblaft and Wilbur[21] who observed in their study in Mexico that nutrition knowledge and dietary practices were not strongly correlated. Therefore, nutrition knowledge per se does not seem to lead to direct action when individuals are unable to apply the knowledge for several reasons. For instance, diet quality of individuals has been reported to be highly influenced by their income levels[22-24]. Again, there was a positive correlation between nutrition knowledge and nutritional status although it was not statistically significant (r = 0.043; 0.659), suggesting that the nutrition knowledge of respondents did not affect their nutritional status. It is believed that education entails changing peoples’ paradigms in the way they eat. It entails teaching to use the foods that are available to them locally, and to use them in a balanced way. The respondents through nutrition counseling and education might have been encouraged to eat new foods available locally in nutritionally balanced combinations. This is usually done to help them increase their food intakes so they can meet their energy and nutrient needs. However, as pointed out by Schlenke[25], knowledge of nutrition does not necessarily lead to improvement in dietary habits but only through constant motivation and good attitude. A number of factors might have influenced this. It is possible that the nutrition counseling given at the hospitals did not address their specific levels of needs, or it is possible that they failed to understand or grasp what was taught hence their inability to implement it. On the contrary, the respondents might have received the requisite education alright but failed to put it into practice, due to financial constraints.However, there was a negative correlation between the quality of diet of respondents and their nutritional status which was statistically significant (r = - 0.242; p = 0.011). This relationship suggests that the quality of diets of respondents somehow determined their nutritional status. The negative correlation between diet quality and nutritional status is very surprising since high quality diets play an important role in the nutritional status of people. It is possible that at the time of the study, some of them might have gone through crisis which could have affected their nutritional status.
4. Conclusions and Recommendations
- Based on the findings of the study it was concluded that although most respondents had fair to adequate nutrition knowledge, this knowledge did not affect the quality of diets and nutritional status of the respondents to a large extent. The quality of diets of respondents however influenced their nutritional status. It is therefore recommended that the Ministry of Health (MOH) in collaboration with the Ghana AIDS Commission (GAC) and the various NGOs interested in the plight of PLHIV must emphasize nutrition education intervention programs aimed at improving energy intakes especially by the inclusion of the consumption of snacks. It is also crucial to address the low folate intakes and shortfalls in iron intakes among females. Interventions should find ways of addressing low incomes among PLHIV so diets they require would be affordable. In this way, nutrition education as a component of modules designed to manage patients becomes beneficial. Again, dietary guidelines should target the cheaper varieties among food groups and foods familiar to the people. Furthermore, baseline nutrition and dietary assessments should be carried out as soon as one is diagnosed with HIV to identify those who need special or immediate assistance in managing their diets.
ACKNOWLEDGEMENTS
- This research was supported by a sponsorship from the Ghana Aids Commission. The authors are grateful to Dr. S. B. Ofori, the Doctor-in-charge of the HIV/AIDS clinic, and the HIV patients who participated in the study.