-
Paper Information
- Next Paper
- Previous Paper
- Paper Submission
-
Journal Information
- About This Journal
- Editorial Board
- Current Issue
- Archive
- Author Guidelines
- Contact Us
Food and Public Health
p-ISSN: 2162-9412 e-ISSN: 2162-8440
2012; 2(5): 168-177
doi: 10.5923/j.fph.20120205.08
Kidney and Liver Functions and Stress Oxidative Markers of Monosodium Glutamate-Induced Obese Rats
 Abstract
 Reference
 Full-Text PDF
 Full-Text HTML
María Del Carmen Contini , Néstor Millen , Luisina Riera , Stella Mahieu
Laboratorio de Investigaciones Fisiológicas Experimentales (LIFE). Facultad de Bioquímica y Ciencias Biológicas. Universidad Nacional del Litoral. Ciudad Universitaria. Paraje El Pozo. CC 242. Santa Fe. (3000). Argentina
Correspondence to: María Del Carmen Contini , Laboratorio de Investigaciones Fisiológicas Experimentales (LIFE). Facultad de Bioquímica y Ciencias Biológicas. Universidad Nacional del Litoral. Ciudad Universitaria. Paraje El Pozo. CC 242. Santa Fe. (3000). Argentina.
| Email: |  |
Copyright © 2012 Scientific & Academic Publishing. All Rights Reserved.
The purpose of the present study was to determine the function and oxidative status in kidney and liver using a model of obesity induced by neonatal treatment of rats with monosodium glutamate, and to investigate the association of these metabolic changes with antioxidant enzymes, oxidative stress and NO generation. Methods: neonate male Wistar rats were subcutaneously injected, with monosodium L-glutamate (MSG), at a dose of 4 g/kg body weight at days 2, 4, 6, 8 and 10 of life. We evaluated: anthropometrical parameters and obesity markers, intravenous glucose and insulin tolerance tests, liver function, bile flow and pharmacokinetic parameters, biochemical and histological studies in renal and hepatic tissues, measurement of oxidative stress markers and histopathological examination. Results: glutathione decreased in kidney; glutathione peroxidase (GPx), glutathione reductase and superoxide dismutase (SOD) increased activities. These suggest that the oxidative defences of kidney reacts positively giving to such tissue more resistance against to the oxidative stress. There may be a ROS mediate inactivation of NO and as a result reduced renal plasma flow and glomerular filtration rate. In liver redox status induces decrease in SOD and increase in GPx activity. Changes in redox status would be responsible of the functional and histological alterations observed both in kidney and liver.
Keywords: Monosodium Glutamate, Oxidative Stress, Obesity, Kidney, Liver
Article Outline
1. Introduction
- Obesity is an increasing problem in several countries, leading to health problems. Several experimental models have been proposed in order to induce obesity in animals according to its etiology, some of which have been widely characterized. During the last decade, there has been increasing evidence that MSG-treated animals develop central obesity, altered glucose tolerance and hyperinsulinaemia, which may appear as early as 12 weeks[1],[2]. Aerobic exercise was able to improve the glucose intolerance, with greater tissue uptake of glucose in response to insulin[3], and this was associated with an improvement in the release of insulin from β-cells[4]. Hypothalamic obesity is frequently used and can be induced in the neonatal period through the systemic administration of monosodium glutamate (MSG)[3],[5]. This model shows chemical lesions in arcuate nucleus structure, which results in endocrine disorders, such as obesity and glucose intolerance, thus leading to experimental diabetes. These lesions cause stunting of growth without any increase of food intake[6-9]. Moreover, it has been reported voracity and impaired GH secretion induced by parenterally administered MSG[10]. It is well established that oxidative stress status is enhanced in the animal model of diet induced obesity[11-13] and in MSG treated rats[14]. Obesity and hypertension are risk factors for the development of chronic kidney disease, and it has been suggested that obesity, even in the absence of diabetes, contributes significantly to the development and progression of chronic kidney disease[15-17]. In tissues, antioxidant defence, mainly made up of glutathione (GSH) and antioxidant enzymes opposes the toxic actions of reactive oxygen species (ROS). The primary antioxidant enzymes responsible for protection from ROS are superoxide dismutase (SOD), catalase (CAT), and glutathione peroxidase (GPx). Thus, oxidative stress is present in case of an imbalance between ROS production and antioxidant defences. Studies in which rats were fed an antioxidant-deficient, pro-oxidant diet have demonstrated the significance of an adequate antioxidant defence in both normal and injured kidneys[18],[19]. Oxidant injury is now recognized as playing a key role in the pathophysiologic pathways of a wide variety of progressive clinical and experimental renal diseases[20]. Nitric oxide (NO), an important mediator of vascular tone and renal function, regulates glomerular, vascular, and tubular function in the kidney[21]. An increase in renal and vascular oxidative stress can be effectively counteracted by NO via its rapid inactivation of superoxide[22]. It is believed that any condition that leads to an increase in ROS production and/or a decrease in NO generation shifts the balance towards oxidative stress and influences renal and vascular function[23]. Thus, the major purpose of the present study was to determine the function and oxidative status in kidney and liver using a model of obesity induced by neonatal treatment of rats with MSG. We also investigated the association of these metabolic changes with antioxidant enzymes, oxidative stress and NO generation.
2. Materials and Methods
2.1. Animals and Obesity
- Neonate male Wistar rats were subcutaneously injected, with monosodium L-glutamate (MSG), at a dose of 4 g/kg body weight at days 2, 4, 6, 8 and 10 of life, while the other male group (Control rats) were injected with physiological saline[24-27]. The injection volume was 8 μl/g body weight. The pups were left with their own mothers and were weaned at 4 wk of age. All animals were housed, under control conditions, in a 12-h light–dark cycle luminosity and temperature (21± 2℃). Animals were allowed free access to tap water and a standard diet containing approximately 130 mmol/kg sodium, 160 mmol/kg potassium, 23% protein and 5 % fat. The experimental protocol was approved by the Human and Animal Research Committee of the School of Biochemistry, University of Litoral, Santa Fe, Argentina.
2.2. Anthropometrical Parameters and Obesity Markers
- Body weights (BW) and lengths (nose-tail and nose-anal) were measured at 4 weeks of age initially and then once a week up to 7 months of age. The body weight and body length were used to determine the following anthropometrical parameter: the Lee index[28][the cube root of body weight (g) divided by the nose anal length (cm)], employed as a predictor of obesity, was calculated at 4, 5, 6,and 7 months of age.
2.3. Intravenous glucose tolerance test (IGTT)
- IGTT was performed in MSG-treated and untreated rats at seven months of age, under anesthesia by injection of pentobarbital (50 mg/kg b.w., i.p.). After an overnight fasting of 8 h, a glucose load (1 g/kg body weight) was infused in the animals through femoral vein. Blood samples were obtained from a cut tip tail for glycemic determinations immediately before glucose load (zero time) and at 10, 20, 30, 40, 50 y 60 min. Thereafter, the constant rate for plasma glucose disappearance (Km) was calculated based on linear regression of the neperian logarithm of glucose concentrations.
2.4. Insulin Tolerance Test (ITT)
- Seven months old MSG-treated and control rats, after an overnight fasting of 8 h, underwent an intraperitoneal insulin tolerance test (1 U/kg body weight of insulin), and samples for blood glucose measurements were collected at 0 (basal), 5, 10, 15, 20, 25 and 30 min after injection from a cut tip tail. There after, the rate constant for plasma glucose disappearance (Km) was calculated by formula 0.693/(t1/2). The plasma glucose t1/2 was calculated from the slope of the least square analysis of the plasma glucose concentrations during the linear phase of decline[27].
2.5. Experiments in Metabolic Cages
- After 7 months of age, rats (n = 6, each group) were housed in metabolic cages to determine urine volume and food and water intake. Animals received demineralized water and standard diet that contained 129 mmol Na/kg. Daily sodium balance was calculated as sodium intake minus sodium excretion. After two days of adaptation, daily water and sodium balance were measured during the last one day. Potassium, creatinine and protein excretion and urine osmolality were analysed in urine collected during the last 24 hours. Then twelve-hour urine samples were collected and were analysed NOx metabolites. To eliminate contamination of urine samples, animals received only water during the 12 h collection period. Then, another experiment was performed to assess the urinary concentration ability. Rats (n = 6, each group) were deprived of food and water for 18 hours and then were given an im injection of 1- deamino –[8-D-arginine] – vasopressin (DDAVP, 1 nmol/100 g body weight; Ferring Pharmaceuticals), a V2 receptor-selective vasopressin agonist. Spontaneously voided urine was collected 120 minutes after DDAVP injection for osmolality determination.
2.6. Renal Function Measurements
- At the end of the above experiment control (n = 6) and MSG-treated rats (n = 6) were anesthetized by injection of pentobarbital (50 mg/kg b.w., i.p.) and were prepared for renal clearance studies as previously reported[29]. The femoral vein and the femoral artery were cannulated. The bladder was exposed through a small abdominal incision and cannulated with a catheter (internal diameter: 3mm) for urine collection. A solution containing inulin (1 g/100 ml), sodium p-aminohippurate (PAH, 0.3 g/100 ml) and isotonic saline was infused through the femoral vein catheter at a rate of 1 ml/h.100g wb using a constant infusion pump (Sage Instruments, model 341-B-syringe pump). After equilibration for 60 min, urine samples were obtained during two periods of 30 min. Blood samples were obtained from the femoral artery at the midpoint of each collection period. Urinary volume was measured. Glomerular filtration rate (GFR) was determined by inulin clearance and renal plasma flow was estimated by PAH clearance. Creatinine, inulin, PAH, sodium, potassium and osmolality were measured in serum and urine samples. Urea and aldosterone were determined in serum samples. Fractional excretion of water (FEH2O), sodium (FENa) and potassium (FEK) were calculated by conventional formulae.
2.7. Liver Function Bile Flow and Pharmacokinetic Parameters
- Bile flow and biliary excretion of cholephilic xenobiotic (bromosulphophthalein - BSP) were determined by the ability of the hepatocyte to transport solutes. For this purpose, seven months old rats from both groups received a BSP injection (6 mg/100 g wb, iv). Blood samples were collected every 2 min over a 30 min time period and bile samples were collected every 10 min over a 60 min time period. Plasma and bile BSP concentrations were determined spectrophotometrically at 580 nm, after the addition of 0.5 M NaOH. The percentage of biliary BSP recovery was estimated by the percentage ratio between the dye excreted in bile samples throughout the experimental period and the amount of BSP injected. In vivo pharmacokinetic studies BSP decay were carried out to assess the fractional transfer rates for the transport of the dye from plasma to liver (hepatic uptake, r12), liver to plasma (sinusoidal efflux, r21) and liver to bile (canalicular excretion, r3). For this purpose, the plasma dye concentration data, plotted against time were fitted by a least-squares curve-fitting technique to the bi-exponential equation, according to standard formulas for a bicompartmental open model[30].
2.8. Biochemical and Histological Studies in Renal and Hepatic Tissues
- In another set of two different groups of rats (control and MSG treated), at seven months of age, (n = 6 for each group) were fasted overnight (10-12 h) weighed and anesthetized by ip injection of sodium pentobarbital (50 mg/kg b.w., ip). Blood was collected by cardiac puncture and kidneys and liver were removed. Kidney was weighed. One part was processed for histology, and the rest were frozen and stored in liquid nitrogen. Then, the epididymal and retroperitoneal fat pads were isolated and weighed to estimate obesity induced by MSG treatment. Triglyceride, total cholesterol, Aspartate aminotransferase (ASAT), alanine aminotransferase (ALAT) and alkaline phosphatase (ALP) were measured in plasma.Different sets of renal cortex and liver samples were homogenized with a Polytron homogenizer in different buffers as follows: 1) in buffered sucrose medium (0.25 M sucrose, 10 mM Tris-HCl, (pH 7.0) for superoxide dismutase (SOD) activity measurement; 2) in 50 mM phosphate buffer (pH 7.0) containing 1 mM EDTA, for glutathione peroxidase (G-Px), glutathione reductase (GR) and catalase (CAT) activity measurements; 3) in cold 1,15% KCl for thiobarbituric acid reactive substances (TBARS) measurement; and 4) in cold 5% trichloroacetic acid in 0.01 M HCl for non-protein sulfhydryl (NPSH) pool (principally glutathione – GSH) measurement.
2.9. Measurement of Oxidative Stress Markers
- SOD activity was assayed according to the method of Misra and Fridovich[31]. G-Px activity was determined according to the method of Lawrence and Burk[32]. GR activity was assayed according to the method of Horn[33] and CAT activity was determined following the method of Aebi[34]. Determination of renal GSH was carried out in homogenates as described by Ellman[35]. TBARS was assayed according to the method of Okhawa et al.[36]. Protein concentration in renal homogenates was determined by the method of Lowry et al.[37] with bovine serum albumin as standard.
2.10. Histopathological Examination
- Portions of the tissues from kidney and liver were used for histopathological examination. Tissues were fixed in 10% buffered formalin (pH 7,2) and dehydrated through a series of ethanol solutions, embedded in paraffin, and routinely processed for histological analysis. Sections of 5 μm thickness were cut and stained with hematoxylin-eosin and PAS and examined by light microscopy.
2.11. Analytical Methods
- Determination of creatinine in serum and urine, total cholesterol, triglycerides, and urea nitrogen (BUN), ASAT, ALAT and ALP concentrations were determined in plasma with an automatic analyser (Selectra-2, Vitalab). Plasma glucose concentration was determined by glucose oxidase kit. Serum and urine osmolality were determined using a vapor pressure osmometer (model 5100 C, Wescor). Sodium and potassium were determined by flame photometry. Aldosterone in serum was measured by RIA using a commercial kit (Coat-A-Count Aldosterone, DPC, Los Angeles, CA). Urinary protein excretion was measured by precipitation with 3% sulphosalicylic acid[38]. NOx (nitrate and nitrite) metabolites detection kit was purchased from Cayman Chemical.
2.12. Statistical Analysis
- Results are expressed as mean ± S.E.M (standard error of the mean). Data were analysed using the one-way analysis of variance followed by Scheffe contrast. The 0.05 level of probability was used as the criterion of significance in all cases. The statistical analysis was made with SPSS - PASW Statistics 18.0.
3. Results
3.1. Effects of MSG Neonatal Treatment in Anthropometrical Parameters and Fat Accumulation of Adult Rats
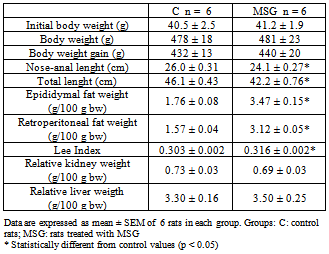
- Physiological parameters of the two groups of Wistar rats at the end of the study are presented in Table 1. Body weight did not differ significantly between the control and MSG-treated group at 7 months of age, and had almost the same weight gain. Nose anal length was significantly shorter in the MSG-treated groups than in control. The MSG-treated rats generally appeared shorter and stunted in growth compared with control rats. Thus the Lee Index and retroperitoneal and epididymal fat depositions were markedly higher in MSG-treated than control. Absolute and normalized kidney and liver weights were not significantly different among groups.
|
3.2. Effects of MSG neonatal treatment biochemical determinations, fasting plasma glucose, peripheral insulin resistance of adult rats
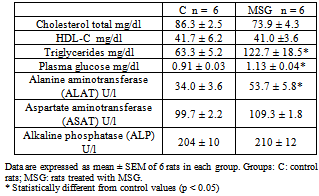
- As shown in Table 2 plasma total cholesterol and HDL cholesterol did not differ significantly among groups. Plasma triglycerides, fasting levels of glucose and ALAT were higher in MSG rats compared with controls.
|
3.3. Effects of MSG-neonatal administration on renal water excretion and on the sodium balance in adults rats at 7 months of age
- The food intake was almost the same in MSG-rats and the controls (g/day) (Control: 18.2± 1.3; MSG: 18.6 ± 1.5). Daily water intake was higher in MSG (33.6±2.6*) rats than in Control (26.3±2.3, p<0.05), however, daily urine excretion, daily sodium intake and daily sodium excretion were similar in both groups.Neonatal MSG treatment increased the degree of proteinuria, which was significantly elevated compared with the control group. Control: 12 ± 2.2; MSG: 21± 0.8* mg/day, p<0.05 at seven months of life. Urinary excretion of NOx metabolites (nitrates + nitrites) was significantly lower in the MSG-treated rats than in control group: Control: 1721.7 ± 124.8; MSG: 1064.4 ± 122.5* nmol/12 h, p<0.05.Urinary osmolarity were measured in both groups after 18 hours of water deprivation and administration of Desmopressin to asses concentrating capacity. MSG treatment had no effect on urinary concentrating capacity. (Control: 2219 ± 68; MSG: 2338 ± 60, mOs/Kg).
3.4. Effects of MSG-neonatal Administration on Renal Function, Using Clearance Techniques
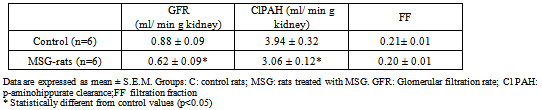
- Glomerular filtration rate (GFR), estimated by inulin clearance and cortical renal plasma flow, estimated by PAH clearance (ClPAH), were measured by conventional clearance techniques (Table 3). Both GFR and Cl PAH were significantly reduced in MSG rats, without change in filtration fraction (FF). The fractional excretion of sodium, potassium and water were not different between the two groups of rats.Neither the levels of urea, creatinine, sodium, potassium, osmolality nor aldosterone in serum were different between both groups (Aldosterone: Control n=6, 187± 28.5; MSG n= 6, 182 ± 34.5).
|
|
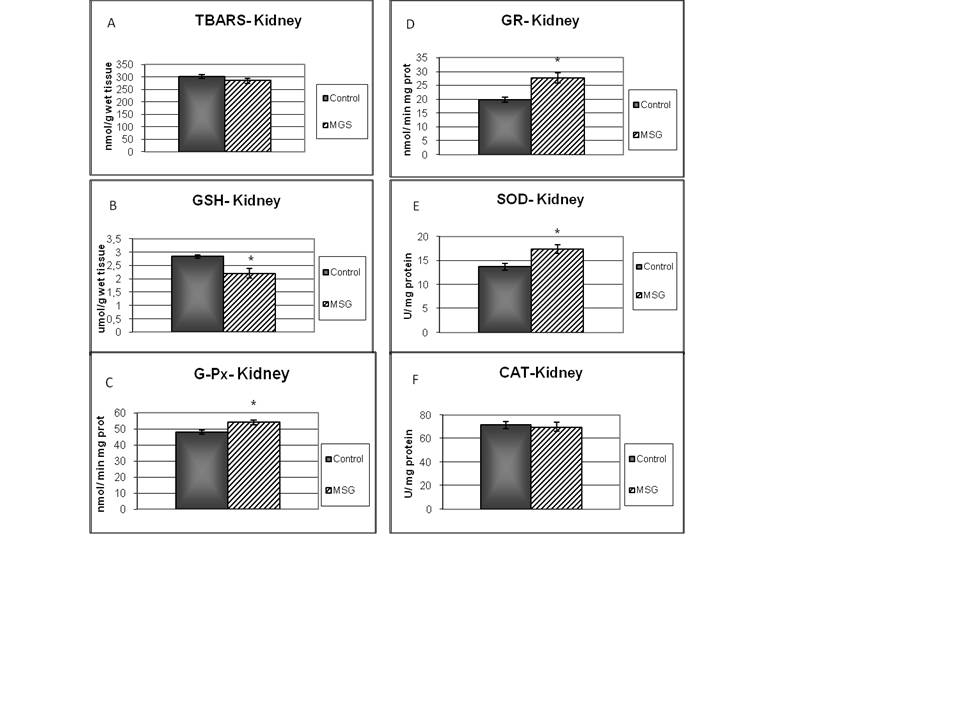 | Figure 1. Oxidative stress markers in kidney. Superoxide dismutase (SOD), catalase (CAT), glutathione peroxidase (G-Px) glutathione (GSH), glutathione reductase (GR) and thiobarbituric acid reactive substances (TBARS). Data are expressed as mean ± SEM of 6 rats in each group. Groups: C: control rats; MSG: rats treated with MSG. * statistically different from control values (p < 0.05) |
3.5. Effects of MSG-neonatal administration on bile flow and biliary excretion of BSP
- No difference was observed in the bile flow and plasma clearance of BSP between both groups, which were accompanied by an unchanged fractional rate of hepatic BSF uptake and fractional rate of the dye biliary excretion.
3.5.1. Lipid peroxidation and cellular defences enzymes in kidney
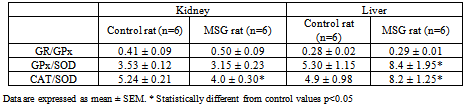
- TBARS levels were measured as an index of malondialdehyde production and hence lipid peroxidation. Results of TBARS did not show any difference between groups (Fig. 1-A). Further, evaluations of enzymes and chemicals associated with the antioxidant system were done. Fig. 1-B shows that GSH levels were significantly decreased in MSG-group compared with the control. On the other hand, MSG treated rats increased significantly the G-Px and GR activities (Fig 1-C; 1-D). The kidney activity of SOD was higher (Fig 1-E) and there was no change in CAT activity in MSG-rats (Fig 1-F). The GR/GPx and GPx/SOD ratios did not show any difference between groups, but CAT/SOD ratio decreased. (Table 4).
3.5.2. Lipid peroxidation and cellular defences enzymes in liver
- There were not changes in neither TBARS or GSH level in liver on MSG-rats (Fig 2-A and 2-B). MSG treated rats increased G-Px activity, with a decreased SOD activity (Fig 2-C, 2-D). Examination of other enzyme associated with oxidative stress (GR, and CAT) did not show any difference between groups (Fig. 2-E, 2-F). The GR/GPx ratio showed not difference when compared to the control group. The GPx/SOD and CAT/SOD ratios increased significantly respect to control group (Table 4).
3.6. Histopathological Examination
- Staining procedures for light microscopy using haematoxylin and eosin (H&E) and PAS (periodic acid Schiff) were carried out on 5-µm-thick tissue sections.
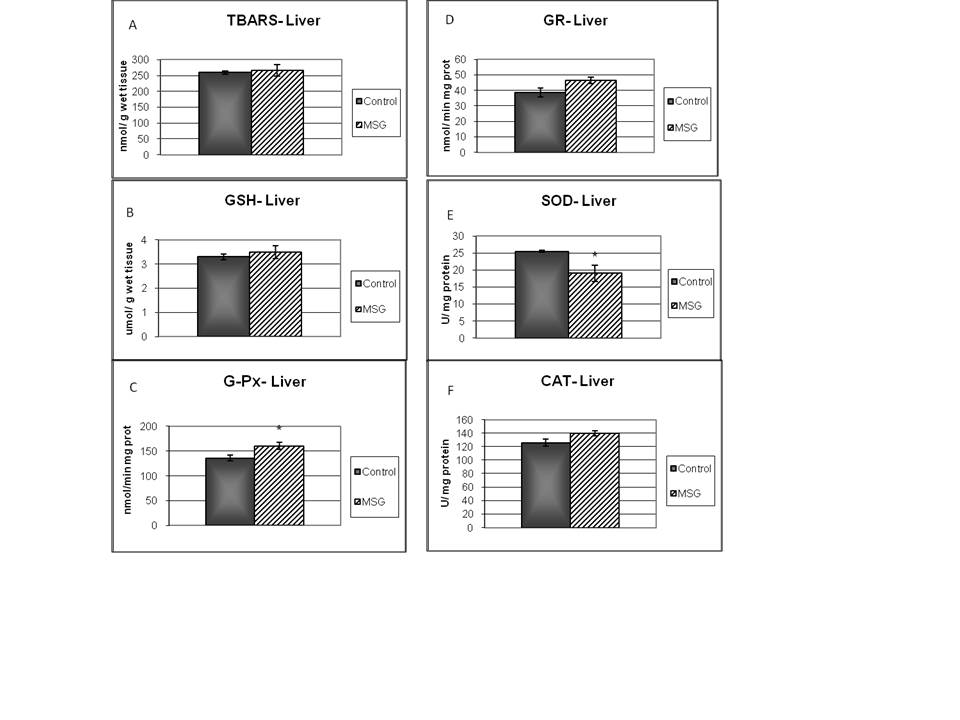 | Figure 2. Oxidative stress markers in liver. Superoxide dismutase (SOD), catalase (CAT), glutathione peroxidase (G-Px) glutathione (GSH),glutathione reductase (GR) and thiobarbituric acid reactive substances (TBARS). Data are expressed as mean ± SEM of 6 rats in each group. Groups: C: control rats; MSG: rats treated with MSG. * statistically different from control values (p < 0.05) |
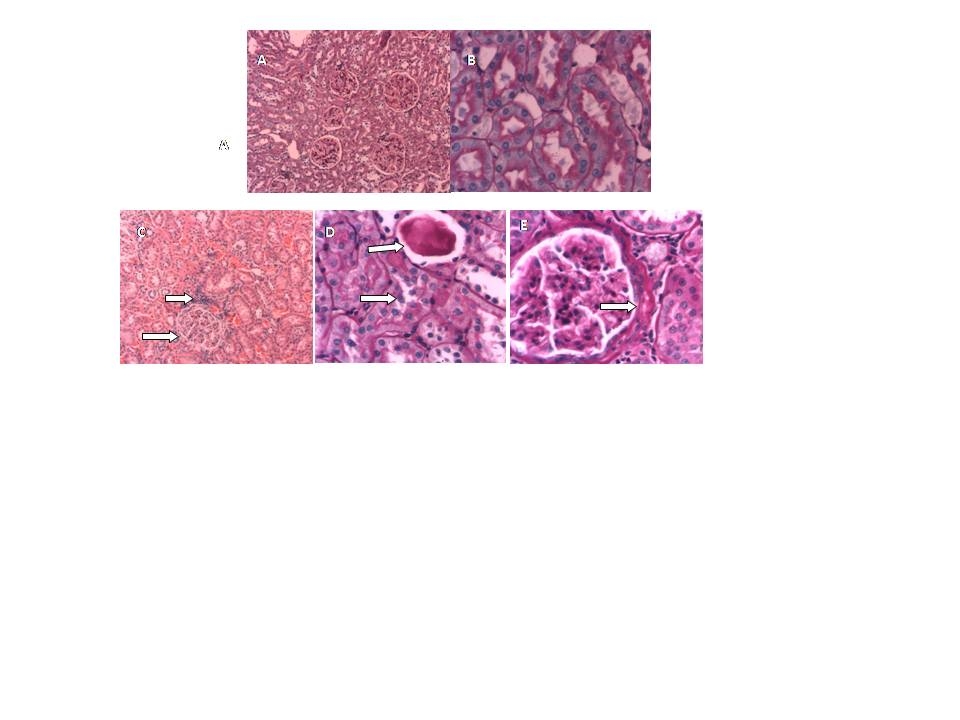 | Figure 3. Renal morphology. Control rats: A (H&E 10 x) and B (PAS 40 x). MSG rats: C (H&E 10 x) focal interstitial inflammation and thickened capsule, D(PAS 40 x) cast hyaline and tubular damage and E(PAS 40 x) thickened capsule |
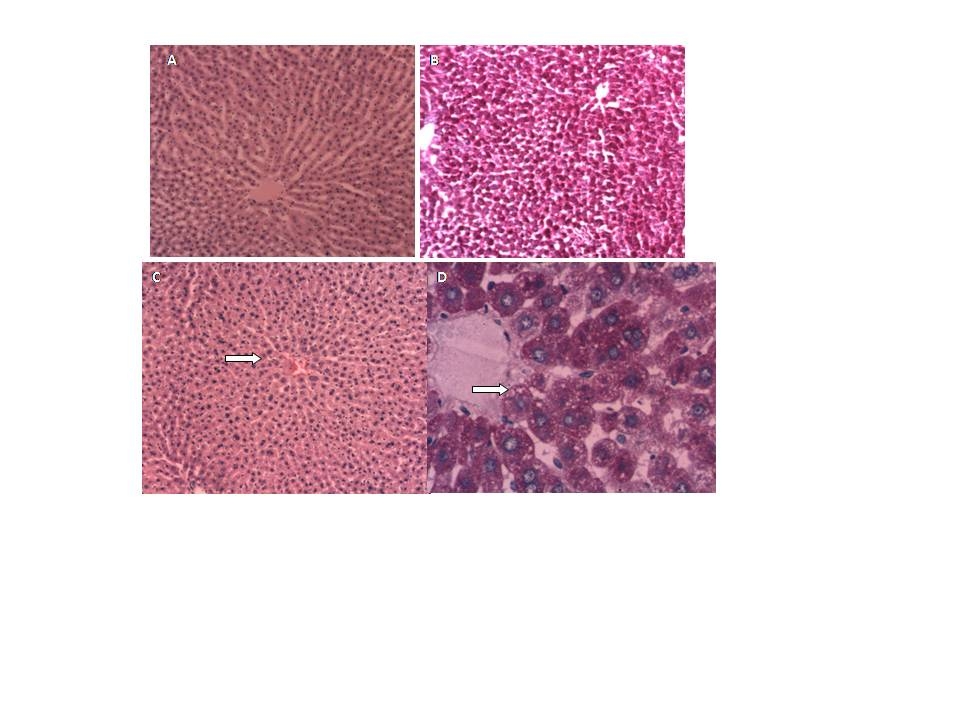 | Figure 4. Liver morphology. Control rats: A (H&E 10x) and B (PAS 10 x). MSG rats: C (H&E 10x) and D (PAS 40 x) steatosis |
4. Conclusions
- The purpose of this study was to establish the relationship between the renal and liver damage found in rat model obesity induced by neonatal treatment with MSG, and the alterations found in the antioxidant enzymes levels, as well as TBARS and GSH.Male Wistar rats treatment with neonatal MSG induces obesity in adult rats with impaired glucose tolerance, increasing levels of plasmatic glucose, resistance to insulin and hypertriglyceridemia. These results confirm the ones obtained from different studies, even though they do not always show hyperglycemia[39].Metabolic abnormalities such as hypertriglyceridemia and insulin resistance, examined in ITT, were related to the levels of obesity analysed according to Lee index, which were also proved by other authors[40]. This last effect can be related to the alteration of the peripheral tissue glucose uptake as there is evidence of patients with peripheral resistance that require high doses of insulin during ITT in order to reduce the levels of glycemia[41].Treated rats reduced their size as well as nose-to-anus length and total length, without major variations in the weight of the organs which have been studied at seven months of age. Other authors have reported that certain organs have reduced their size[42]. Obesity is associated with hemodynamic changes, among others, with an increase of the regional blood flow, the cardiac output and blood pressure[43]. Moreover, in the metabolic syndrome an endothelial dysfunction has been descripted with decrease in the synthesis and release of vasodilating agents and increase of vasoconstrictors[44].Our results show that MSG neonatal treatment, at seven months of age, decreased both glomerular filtration rate as renal plasma flow, without changes in the filtration fraction or the fractional excretion of sodium and water. Such changes, the urinary reduction excretion of NO and the presence of proteinuria, would be indicating a compromise of the renal function. This result agrees with studies released with obese Zuker rats that showed decreased creatinine clearance and high proteinuria values[11].NO induces vasodilatation in renal arterioles, thus contributing to renal function. In MSG rats, NO reduction could be responsible for the decrease observed in both, glomerular filtration rate and renal plasma flow.Obesity is associated with endothelial dysfunction due to ROS-mediated inactivation of NO[45][46]. Increased generation of reactive oxygen species leads to NO inactivation. Consequently, NOx urinary excretion decreases because NO is sequestered in tissues rather than metabolized. NOx urinary excretion is reduced in several animal models of experimental hypertension associated with oxidative stress, such as lead intoxication[47], 5/6 nephrectomy in the rat[48], and glutathione depletion[49]. The oxidative stress is a risk factor for the renal injury and it is associated with the development and progression of the albuminuria. In the tissues, the oxidative stress will be present in case of an imbalance between the productions of ROS and the antioxidant defences. Such increase was observed in obese rats[11] and in rats with hypercaloric diets treated with MSG[14]. SOD catalyzes the dismutation of the superoxide radical (O2 ¯˙) to oxygen peroxide (H2O2) and it protects the organs from the O2 ¯˙ damage. G-Px catalyzes the reduction H2O2 in water[50]. In turn, CAT, another important antioxidant metalloenzyme, takes part in the conversion of oxygen peroxide in water. Even though we have not proved an increase in the lipid peroxidation levels in renal tissue, the obesity induced by MSG altered the homeostasis of GSH with a reduction of its levels, which was accompanied by an increase in G-Px and GR activities. The depletion of renal GSH (22%) suggests that obesity could be a contributing factor to the renal injury degree. G-Px, GR and SOD increase suggests that the kidney oxidative defences react positively giving more resistance to such tissue against the oxidative stress. Antioxidant enzymes activity increase and the possible increase of GSH turnover, even though their levels were diminished, they would keep a balance between the influence of ROS and the kidney oxidative defences. The increase of ROS would be balanced by the increase of the antioxidant enzymes activity, as indicated by the absence of changes in the G-Px/SOD and GR/G-Px relation. The degenerative changes and inflammatory reactivity observed in renal tissue might be related to oxidative stress.Obesity is also an important risk factor for developing dyslipidemia and fatty liver. In MSG-rats, livers exhibit significant steatosis without a great inflammation, which was accompanied with hypertriglyceridemia. Only serum ASAT levels were significantly increased. This research agrees with the work in mice after 6 months of treatment of Nakanishi[51], he also observed the presence of neutrophils aggregation into the lobes and portal inflammation. Bile secretion from the liver has a pivotal physiological role as an excretory route for endo and xenobiotics. To determine possible alterations in these transport systems, we evaluated the hepatic handling of the model organic anion BSP, a relatively non-toxic organic anion that is widely used as an indicator of the liver function. In seven-month-old MSG rats, changes have not been observed in bile flow or pharmacokinetic parameters. MSG group contrast with the obese Zucker rat (a model of insulin resistance and obesity) which exhibit an impaired bile secretory function in fatty liver with significant functional and molecular alterations consistent with mild cholestasis[52].Surprisingly, at the liver level in MSG rats, no increase was observed in the LPO; besides, we found that GSH level was almost normalized. However, superoxide dismutase activity was decreased whereas glutathione peroxidase was increased. This decrease in SOD/GPx ratio favors O2¯˙ formation (decomposed by SOD) rather than H2O2 (formed by SOD and decomposed by GPx). It has been suggested that these alterations in antioxidant enzymes may limit oxidative damage because O2¯˙ has a shorter half-life, is less membrane-permeable, and thus less harmful than H2O2.[53]. Moreover CAT/SOD would indicate that the liver is efficient in converting H2O2 into H2O and singlet oxygen.In conclusion, we have demonstrated that in obese rat model induced by monosodium glutamate neonatal treatment, GSH decreased in kidney, and no change in liver. The increase of G-Px, GR and SOD activities suggests that the oxidative defences of kidney reacts positively giving to such tissue more resistance against to the oxidative stress. Moreover there may be a ROS mediate inactivation of NO and as a result reduced renal plasma flow and glomerular filtration rate. In liver redox status induces decrease in SOD and increase in GPx activity. Changes in redox status would be responsible of the functional alterations observed both in kidney and liver.
ACKNOWLEDGEMENTS
- This work was supported by grants from Universidad Nacional del Litoral, Argentina, CAI+D program.