-
Paper Information
- Next Paper
- Previous Paper
- Paper Submission
-
Journal Information
- About This Journal
- Editorial Board
- Current Issue
- Archive
- Author Guidelines
- Contact Us
Food and Public Health
p-ISSN: 2162-9412 e-ISSN: 2162-8440
2012; 2(4): 92-98
doi: 10.5923/j.fph.20120204.02
Environmental and Socioeconomic Correlates of Child Malnutrition in Iseyin Area of Oyo State, Nigeria
 Abstract
 Reference
 Full-Text PDF
 Full-Text HTML
Timothy T. Awoyemi , John C. Odozi , A.A. Ogunniyi
Department of Agricultural Economics, University of Ibadan
Correspondence to: John C. Odozi , Department of Agricultural Economics, University of Ibadan.
| Email: |  |
Copyright © 2012 Scientific & Academic Publishing. All Rights Reserved.
Policy makers at global, national and local levels are more than ever concerned about the rising trend in child malnutrition in Sub-Saharan Africa and how it can be curtailed in the context of general food and basic-needs policies. To support programme setting at the local government level, this study was conducted to examine the relative importance of environmental and socio economic correlates of child malnutrition. Primary data were collected through a well structured questionnaire and analysed using Z-score indices and probit model.Our results reveal that 46% of the children are stunted, 6% under weight and 21% wasted. Our model estimation identified the age of the child, diarrhoea infection and poor sanitation as key factors that increases the likelihood of malnutrition in the study area. This reflects the relative importance of environmental factors in the study area. Socioeconomic factors were less robust but were consistent with previous empirical studies in terms of direction of association. The study recommends that government and other stakeholders should pursue sanitation/ hygiene programmes and public enlightenment programmes on the dangers of poor sanitation and diarrhoea.
Keywords: Malnutrition, Poverty, Environmental sanitation, Anthropometric
Article Outline
1. Introduction
- This section presents a brief analysis of the problem of malnutrition particularly as it relates to the nutrition of children in Nigeria, the underlying factors and the need for more intervention at the local level of governance. Nearly one- third of children in developing countries are either underweight or stunted and more than 30% of the developing world’s population suffer from micronutrient deficiencies[20]. Nigeria, the most populous country in Sub-Saharan Africa is included in this story. Available data reveal high levels of malnutrition among children particularly in rural areas. The Nigeria Food Consumption and Nutrition Status Survey (NFCNS) showed that nationally, 42 percent of children were stunted, 25 percent underweight and 9 percent wasted.[8]. Along the same line, NDHS 2003 reported 38 percent of under-five children as stunted, 29 percent underweight and 9 percent wasted. Stunting, wasting and underweight conditions of a child are all indicators of child malnutrition or nutrient deprivation.A host of factors underlie child malnutrition which includes household access to food and the distribution of this food within the household, availability and utilization of health services, and care provided to the child[4].Thus this study raises the question of whether socioeconomic andenvironmental characteristics of households correlate with the likelihood that a child becomes malnourished. Malnutrition is recognised as a consequence of poverty since most of the worlds malnourished children live in the developing nations of Asia, Africa and Latin America where those mostly affected are from low income families. Furthermore, higher rates of infant mortality are found among countries that have inequitable distribution of wealth and income, relatively low per capita income, high adult literacy, poor access to clean water, and low caloric consumption per person. Reducing child malnutrition is a key millennium development goal and a focal policy thrust of the government of Nigeria as well as other countries in Sub-Saharan Africa. Though there are several other global and national initiatives to increase food availability and stability, more interventions are needed at the local government level particularly as regards raising the resources of households and the promotion of hygiene and sanitation in the study area. Iseyin is a Peri urban town located in Oyo state Nigeria and approximately 100 kilometres north of Ibadan. It comprises 11 wards namely, Adoawaye, Akinwumi/OdoOgun, Ekunle 1, Ekunle 2, Faramora, Ijemba/Oke Oja, Isalu 1, Isalu 2, Koso 1, Koso 2, Ladogan/Oke Eyin.The estimated population is 236,000 and the people are mainly into trading, faming and weaving and other activities. Poverty and poor sanitation are well pronounced in the town. Though there are different health centre within the town like the general Hospital and other private hospitals, access by households is often difficult. To guide policy formulation at the local level, this study attempts to investigate those factors correlating with child malnutrition. It takes up the null hypothesis that socio economic and environmental factors do not have partial influence on the likelihood of malnutrition against the alternative hypothesis. The specific objectives to examine are: socioeconomic and environmental characteristics of households, the incidence of child malnutrition and the factors influencing child malnutrition.
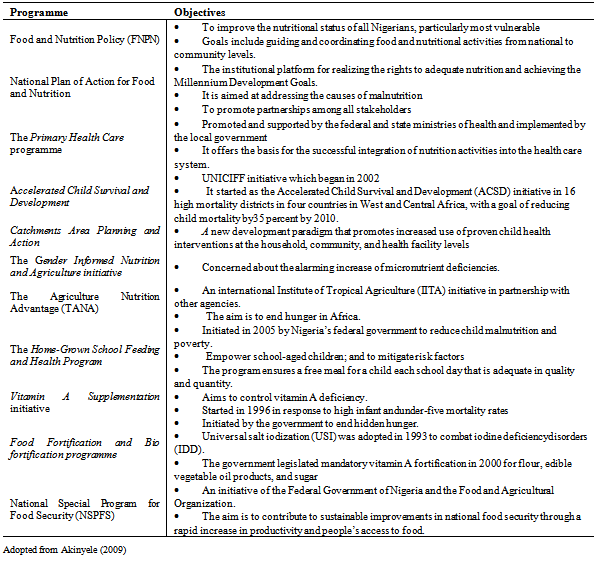
2. Policies and Programs to Address Malnutrition
- This section presents the many initiatives to address the problem of food security and nutrition in Nigeria. The aim is to reflect on the fact that continued prevalence of malnutrition at local levels presupposes ineffectiveness of these initiatives or the inability of households to benefit from these initiatives because of poverty and low income to facilitate participation. The pathway to adequate access to health and nutrition requires opportunities to assist poor families especially women to generate income and gain access to health services and a health environment which engenders adequate care for themselves and their children. Thus several initiatives and relevant policy environmenthave evolved over the years to address malnutrition in Nigeria. Some of these initiatives are documented in table 1 below.
3. Review of Theory and Empirical Studies
- The well known theory of G. Becker views child nutrition as a good produced in the home. Accordingly, a household maximizes a utility function defined over leisure, market-purchased goods, and home produced goods such as child nutrition while facing a budget constraint, a time constraint and a biological nutrition production function. The production of child nutrition depends on a set of inputs, such as food or nutrients and the utilization of health services, a set of exogenous individual characteristics such as a child’s genetic endowment, gender and age and a vector of household and community characteristics that affect the manner in which inputs are used including socioeconomic and environmental characteristics.
|
4.Measurement of Child Malnutrition
- Child malnutrition is a clinical sign of nutrient deficiency manifested as stunting, under weight and wasting. These manifestations are often measured using biomedical or anthropometric indicators. However, anthropometric indicators are frequently used for its cheapness and relative availability. Commonly used anthropometric indicators of child malnutrition under the age of 5 years are height-for-age (HAZ), weight-for-height (WHZ) and weight-for-age (WAZ).HAZ is an indicator of a child’s long-term or chronic nutritional status. It reflects linear growth achieved before and after birth of children, with its deficits’ indicating long-term or chronic, cumulative effects of inadequate nutrition, health, or both, “especially protein-energy malnutrition, and sustained and recurrent illness” Low HAZ which is called “stunting,” refers to a situation in which children are shorter than expected for their age and sex in the reference population due to past chronic nutritional deficiency. WAZ measures body mass in relation to age. Low WAZ which is called “underweight,” represents a situation wherein children weigh less than expected considering their age. WHZ measures body mass in relation to body length and describes a recent and acute process that has produced a substantial weight loss. Low WHZ which is called “wasting,” refers to a situation where a child has failed to achieve adequate weight for his or her height.[18,15,12]The measurement of HAZ, WAZ and WHZ of a given population of children is usually carried out through the use of a standard reference population as a point of comparison. The standard reference population often used in previous studies and that recommended for use by[19] to analyse the incidence of child malnutrition is Z-scores below –2 standard deviations from the median of the standard reference population. The reason for favouring children with Z-scores below –2 standard deviations is that those scores convey information about the depth of malnutrition rather than simply whether a child was malnourished.[12]
5. Conceptual Framework
- Child malnutrition is a manifestation of a host of factors. The framework developed by UNICEF categorises these factors into three aspects namely, immediate, underlying and basic. Immediatefactors relate to inadequate dietary intake and illness. Underlying factors relate to insufficient access to food in a household, inadequate health services and unhealthy environment (poor water/sanitation and inadequate health services) and inadequate care for children and women at the household level. Basic factors relate to insufficient human, economic and organisational resources as well as policy environment. The food and agriculture frame work for the analysis of food and nutrition security classifies the factors at the national, sub-national, community and household levels. Socioeconomic and policy environment are the principal determinants of food security at the national and sub-national levels while at the community and household level the basic determinants of food and nutrition security are: human resources, economic resources and organizational resources (for example, formal and non-formal institutions, extended families, and childcare organizations).In this study we classify the factors into socio-economic and environmental.From the literature reviewed above some of the socioeconomic andenvironmental factors explaining child nutrition include: household economic resources such as income, asset, and wealth are important determinants of child nutritional status. It is expected that the higher thelevel of economic resources of the household, the lower the level of child stunting.Second, the education of the mother is also one of the most important resources that enable women to provideappropriate care for their children. Some studies have shown a decreased incidence ofmalnutrition among young children with an increase in the level of mothers' education.Third,Mothers’ employment enhances the household's accessibility to income; it also has negative effects on the nutritional status of children, as it reduces a mother’s time forchildcare. Thus the relationship is mixed as some studies revealed positive relationship while others argued that there is noassociation between maternal employment and children's nutritional status. Available data from[9,10] showed that more than half of the Nigerianpopulation, especially women and children, lived in severe poverty with poor access to basic needs.Unfavourable environment such as inadequate water and sanitation can increasethe probability of infectious diseases and indirectly cause certain types of malnutrition. For example, it has been shown that unprotected water sourceand non-availability of latrine were associated with low child stature. Only a relatively small percentage of Nigerian households have access to improved sources of drinking water and sanitation. Fourth, diarrhoeain children and other infectious diseases may reduce child nutritional status. Fifth, theage of a child is also more sensitive to factors such as feeding/weaningpractices, care, and exposure to infection at specific ages. Thus it has been shown that growthretardation (height-for-age) in children is positively associated with age[3].This study takes up the hypothesis that malnutrition correlates with socioeconomic and environmental factors namely location of households, parents educational status, parents occupation, expenditure on food, sources of water, type of toilet, method of refusal disposal, presence of diarrhoea, household size, the gender of the child and age of the child. These factors and many others not listed here underlie the set of conditions necessary for adequate nutrition. These conditions are adequate access to food; adequate care of children and women; and adequate access to basic health services, combined with a safe and healthy environment. Access to food refers to an individual’s capacity to purchase or exchange in kind levels of appropriate foods needed to maintain consumption of an adequate diet and nutritional level. Adequate care of children and women or care practices refer to care-giving behaviours such as breastfeeding and complementary feeding practices, food and personal hygiene, diagnosing illnesses, stimulating language and other cognitive capabilities, and providing emotional support.
6. Methodology
- The study was carried out in Iseyin, a town located in Oyo state Nigeria and approximately 100 kilometres north of Ibadan. It comprises of 11 wards out of which 5 wards were randomly selected. A sample of 40 households was randomly selected from each of the wards and that resulted to a total number of 200 households. However only 120 households were successfully interviewed through a structured questionnaire relating to households socio economic and environmental characteristics as well as child’s demography. The nutritional conditions were measured during the visit according to standardized procedures to ensure accuracy. Weights of children were measured using scales while children’s height was measured using horizontal boards or vertical boards were applicable. The analysis is divided into two parts. In the first part we used descriptive statistics such as tables, percentages and frequencies to summarize household socio economic and environmental characteristics. To summarize the incidence of malnutrition as measured by anthropometric indicators we used percentages. In the second part, the probit regression model was used to analyse the socio economic and environmental correlates of child malnutrition.
6.1. Anthropometric Indicators
- These indicators are used to measure child malnutrition characterised by underweight, stunting and wasting conditions. The indicators include Height for age Z-scores (HAZ), weight for height and weight for age Z-scores (WAZ). In this study all three indicators are used to describe the incidence of child malnutrition in the study area while Height-for-age (HAZ) was used specifically to establish the relationship between malnutrition and socioeconomic and environmental influences. HAZ is usually considered as the best index to represent children’s long term health status[11]. The Z-score index is expressed as:
 | (1) |
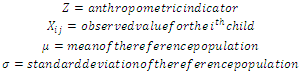 A Z-score of -2 standard deviation is the most commonly adopted cut off for all nutrition indicators. Consequently a child with Z-scores below this cut-off is considered to be malnourished and he is assigned the value of 1 while a child with a Z-score above the cut-off is assigned the value 0 representing a normal child.
 6.2. Probit Model Estimation
- The model assumes a random sample of children characterised by
 with dependent variable
 , and vector
  of
of  explanatory variables.A latent variable
  representing the non-observable nutritional outcome.The non-observable nutritional outcome is represented as linear function of observable and unobservable factors,
  from which
 , the observed nutritional outcome is derived. That is a child is considered malnourished if the nutritional outcome is larger than a threshold (
 ) and normal if (
 ). Thus the chances that a child is malnourished is modelled as a function of the independent variables.
 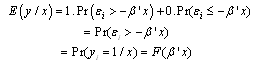 | (2) |
 and
and  indicate expected value and probability respectively,
  , vector of explanatory variables,
  , the vector of coefficients to be estimated and
 , the random error terms. From the above, the log-likelihood function is derived which allows the parameter to be estimated by maximum likelihood techniques. The functional forms
 allowsestimated probabilities to lie between 0 and 1.For the probit model, the functional form is a standard normal density function. The marginal effects of explanatory variable on the probability of malnutrition are calculated as:
 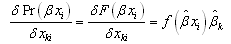 | (3) |
7. Results and Discussion
7.1. Socio-Economic Characteristics of Households
- From table 3 20.8 percent of the children fall within the age of 0-1, 48.4% between 2-3 years, and 30.8 percent 4-5 years. The child within the lowest age bracket (0-1) may not be malnourished because most of them will still be breast feeding. 66% live in the urban area while 54% in the rural area. This means that most of the respondents have access to information and they are more expose to nutritional food. The household size shows that 50.8% have a household size of 0-5. 44.2% 6-10 and 5% above 10. 82.5% are educated. Education is expected to influence the awareness of child malnutrition and to educate them more about nutrition. 80% of households fall in the income bracket 1-50000; this implies that income is generally low in the area. 30% are food secured and well nourished. 60% fed their children more than three times a day while 40% fed three times per day. 77.2% have enough food to eat and 21.7 do not have enough food. 95.8%recieved vaccines to improve their health.
| |||||||||||||||||||||||||||||||||||||||||||||||||||||||||||||||||||||||||||||||||||||||||||||||
|
7.2. Incidence of Malnutrition
- Table 4 shows the incidence of malnutrition as indicated by Height-for-age, weight-for-length and weight-for-age. 46% of the children are stunted, 5% under weight and 17.5% wasted. The results implythe existence of high incidence of malnutrition among the sampled children. As cited in[11], prevalence of malnutrition rate of 5% and above should be considered of significance and detrimental topublic health.
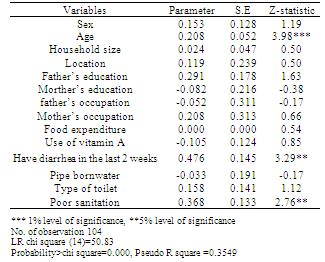
7.3. Correlates of Malnutrition as Measured by Height-for-AgeProbit Analysis
- From the table 5 below, the model displays a good fit with R square (coefficient of determination) value of 0.35 which means that 35% of the variation in child malnutrition is explained by the variables in the model. The directional relationship of all the explanatory variables with malnutrition is consistent with previous empirical studies. However, out off of the 14 explanatory variables only 3 variables were found to be significant at 1% and 5% levels of significance. The variables that are significant are age of the child, diarrhoea and poor sanitation. Thus the hypothesis that age of the child, diarrhoea and poor sanitation do not influence malnutrition is rejected. Though empirical literature points to the fact that socio-economic variables influence malnutrition outcome, our finding appears conflicting. The alternative hypothesis that socioeconomic characteristics influence malnutrition in the study area was rejected. However, our findings regarding socioeconomic influences are not robust due to lack of variation in some of the variables. The variables that were not significant are sex, location, household size, father’s education, mother’s education, father’s occupation, mother’s occupation, food expenditure, vitamin A, pipe born water, and type of toilet use.
|
8. Conclusions
- Malnutrition among children under five years of age in Nigeria is high and to support effective reduction, this study was carried out to understand those factors increasing or decreasing the likelihood of malnutrition in the study area. Primary data collected through a well structured questionnaire were subjected to analysis using Z-score indices and the probit econometric model. Our estimated results identified the age of the child, diarrhoea infection and poor sanitation as key factors that increases the likelihood of malnutrition in the study area. This reflects the relative importance of environmental factors in the study area. Socioeconomic factors were less robust. The study recommends that government and other stakeholders should pursue sanitation/ hygiene programmes and public enlightenment programmes of the dangers of poor sanitation and diarrhoea.
References
| [1] | Abbi, R., P. Christian, S. Gujral, and T. Gopaldas. 1991. The impact of maternal work on the nutrition and health status of children. Food and Nutrition Bulletin 13(1):20-24. |
| [2] | Aguillion, D.B., M.M. Caedo, J.C. Arnold, and R.W. Engel. 1982. The relationship of family characteristics to the nutritional status of preschool children. Food &Nutrition Bulletin4(4):5-12. |
| [3] | Aschalew, G. 2000. Determinants of nutritional status of children in Amhara Region: A casestudy of MisrakGojjam and Semen Wello Zones.M.Sc Thesis, DTRC/IDR, AAU. |
| [4] | Christiaensen, L. and Alderman, H. 2004. Child Malnutrition in Ethiopia: Can Maternal Knowledge Augment the role of Income?. Economic development and Cultural Changevolume 52, Number 2. |
| [5] | Engle, P.L. 1992. Care and child nutrition. Theme paper for the international conference onnutrition (ICN): Paper prepared for nutrition section, UNICEF, New York |
| [6] | Isaac O. Akinyele, I.O. 2009 Ensuring Food and Nutrition Security in Rural Nigeria:An Assessment of the Challenges, Information Needs, and Analytical Capacity IFPRI-NSSP Background paper No. NSSP007 |
| [7] | Leslie, J. 1988. Women's work and child nutrition in the third world.World Development16(1). |
| [8] | Maziya-Dixon, B., I.O. Akinyele, E.B. Oguntona, S.Nokoe, R.A. Sanusi and E.Harris.2004. Nigeria food consumption and nutrition survey 2001-2003.InternationalInstitute of Tropical Agriculture. |
| [9] | National Bureau of Statistics. 2005. Poverty profile for Nigeria. Abuja: |
| [10] | National Demographic Health survey(NDHS)2003. Demographic and Health Survey(NDHS) for Nigeria. Calverton, Md., United States: National Population Commission andORC/Macro |
| [11] | Ojiako, I.A.,Manyong,V.M., and Ikpi, A.E. Determinants of Nutritional Status of Preschool Children from Rural Households in Kaduna and Kano States, Nigeria Pakistan Journal of Nutrition 8 (9): 1497-1505, 2009 |
| [12] | Omilola, B. 2010. Patterns and trends of Child and Maternal Nutrition Inequalities in Nigeria. IFPRI Discussion paper 00968. |
| [13] | Popkin, B.M. 1980. Time allocation of the mother and child nutrition. Ecology of Food andNutrition 9:1-14. |
| [14] | Popkin, B.M., and E.Z. Bisgrove. 1988. Urbanization and nutrition in low income countries.Food and Nutrition Bulletin 10(1):3-4. |
| [15] | Sahn, D., and D. Stifel. 2002. Urban–rural inequality in Africa. Paper presented at theCornell/LSE/WIDER Conference on Spatial Inequality in Africa, September, Oxford, U.K. |
| [16] | Sommerfelt, A. Elizabeth, and S. Kathryn. 1994. Children’s nutritional status. DHSComparative Studies No. 12. Calverton, Maryland, USA: Macro International. |
| [17] | United Nations Children’s Fund (UNICEF). 1990. Strategies of improving nutrition of children and women in developing countries. New York: UNICEF. |
| [18] | Wagstaff, A., and N. Watanabe. 2000. Socioeconomic inequalities in child malnutrition in the developing world. Policy Research Working Paper 2434. Washington, D.C. World Bank. |
| [19] | WHO (World Health Organization). 1983. Measuring change in nutritional status: Guidelines for assessing the nutritional impact of supplementary feeding programmes for vulnerable groups. Geneva, Switzerland: World Health Organization. |
| [20] | World Bank. 2006. Repositioning nutrition as central to development: A strategy forlarge – scale Action. Washington, D.C.: World Bank. |
| [21] | Yimer, G. 2000. Malnutrition among children in southern Ethiopia: Levels and risk factors.Ethiopian Journal of Health Development 14(3):283-292. |