-
Paper Information
- Previous Paper
- Paper Submission
-
Journal Information
- About This Journal
- Editorial Board
- Current Issue
- Archive
- Author Guidelines
- Contact Us
Food and Public Health
p-ISSN: 2162-9412 e-ISSN: 2162-8440
2012; 2(2): 28-33
doi: 10.5923/j.fph.20120202.06
Levels of Fe and Zn in Staple Cereals: Micronutrient Deficiency Implications in Rural Northeast Nigeria
 Abstract
 Reference
 Full-Text PDF
 Full-Text HTML
Umar Musa 1, Stephen S. Hati 2, Abdullahi Mustapha 1
1Department of Pharmaceutical and Medicinal Chemistry, ABU Zaria, Nigeria
2Department of Chemistry, IBB University, Lapai Nigeria
Correspondence to: Stephen S. Hati , Department of Chemistry, IBB University, Lapai Nigeria.
| Email: |  |
Copyright © 2012 Scientific & Academic Publishing. All Rights Reserved.
Maize, millet, rice and sorghum are staple cereals and major source of micronutrients for rural dwellers of Northeast Nigeria. These cereals were randomly sampled form the open markets and investigated for the levels of Iron (Fe) and Zinc (Zn) with a view to provide supportive monitoring information on possible dietary deficiency implications. The standard calibration method of flame atomic absorption spectrometry was used for the determination of Fe and Zn in the cereals. The results of the analysis show average Fe concentrations in cereals: Millet (10.28±2.38μg/g), Maize (5.26± 1.41μg/g), Sorghum (11.03±5.32μg/g) and Rice (6.67±5.94μg/g), and average Zn concentrations in cereals, Millet (5.89±0.88μg/g), Maize (3.92±0.91μg/g), Sorghum (3.84±0.92μg/g), Rice (1.80±0.32μg/g). This study revealed low levels of Zn and Fe in the cereal grains from the study areas, an observation that might be a risk factor for micronutrient malnutrition in the populations of rural dwellers of this region that depend so much on these cereals in their diets. Thus although exposure effects could be additive for Fe where similar foods are eaten, the Zn and Fe contents of the cereal grains may also be hampered from full absorption in the body due to lack of aiding diet components and certain cultural practices.
Keywords: Cereal grains, Essential nutrients, human health, rural dwellers
Article Outline
1. Introduction
- Micronutrient malnutrition is a major global health concern because its deficiency in the body is linked with ill health and diseases. The concern is more crucial on developing countries, especially in children, given that the statistics of malnutrition in these countries are high. More than half of the total population in developing countries are reported to be affected by micronutrient deficiency and therefore more susceptible to infections and impairment of physical and psycho-intellectual development[1]. In sub- Saharan countries, 28% of the children under the age of 5 years are underweight, 38% are stunted and, 9% wasted. Stunting which is defined as low height for age is considered as an indicator of chronic malnutrition whereas wasting which is low weight for height is a measure of acute malnutrition[2]. In Northern Nigeria about 38.5% of the children under five are reported to be stunted, with 9.3 % incidence of wasting. This indicates chronic malnutrition among this age group[1].Micronutrient malnutrition normally occurs when the essential elements are not sufficient to fulfil the need of the body to develop and function normally. Iron (Fe), Zinc (Zn) and Iodine (I) deficiencies are the most occurring nutritional deficiencies in the world although the threat from the deficiency of Iodine has been reduced through the Iodine fortification of table salt (Iodated salt)[3,4].Studies have also shown persistent Fe deficiency anaemia and common stunted growth among school children[5,6]. Fe deficiency affects the physical work capabilities and cognitive development of children[7], whilst deficiency of Zn increases weight loss, growth failure and immunity problem[8].Majority of rural dwellers in northeast Nigeria are not likely to have access to dietary supplements for Fe and Zn. Apart from minor intake of fruits and vegetables, the major source of micronutrients are in the staple cereals (maize, millet, rice and sorghum), which form the major ingredient of most diet in this region. This study attempts to examine the levels of Fe and Zn in these staple cereals cultivated in two states of northeast Nigeria with a view to provide supportive monitoring information.
2. Materials and Method
2.1. Samples and Sampling
- Samples of four staple cereal grains (maize, millet, rice and sorghum) that are locally cultivated in Borno and Yobe States, Northeast Nigeria were sampled according to standard procedure[9] and representative composite samples were obtained from bulk purchases (2 x 5 kg, for each cereal grain). Retail markets from which purchases were made comprise 3 clusters of estimated 12 local government areas (LGA) of Borno State. Samples were collected in linear polyethylene containers and sampling took place during the period June 2008 and December 2009.
2.2. Sample Preparation
- Composite samples (1 kg each) were drawn from the thoroughly mixed composites and ground using mortar and pestle. The dry ashing method[10,11] was employed in this study. The ground samples (10 g each) were placed in porcelain crucibles and few drops of concentrated nitric acid was added to support the ashing. This was further carried out in a furnace at 450℃ for four hours with a temperature increase of 50℃ per hour to avoid self-ignition in the samples. Thereafter, the ash was moistened with few drops of deionised water, dried and re-ashed. This process was repeated until a carbon-free ash (white or slightly coloured with no charred particles) was obtained. The ash was left to cool and was dissolved in 4 mL of 20% HCl. The ash suspension was filtered through a 0.45µm membrane filter into a 50-mL volumetric flask and the filtrate made up to volume with deionised water.
2.3. Determination of Fe and Zn in Cereals
- The standard method[10] of Flame Atomic Absorption spectrophotometry (FAAS) was used in the determination of Fe and Zn in cereals. Shimadzu AA-6800 outfitted with ASC-6100 auto sampler and air-acetylene atomization gas mixture system was used. Standard solutions of Fe and Zn were separately prepared from their respective concentration of 1000mg/ml stock solutions (Shimadzu, GmBH), from which further serial dilutions (0.1-4mg/ml) were made to cover the optimum absorbance range for the standard calibration curve. For the determination, two solutions were prepared for each sample. Reagent blank determinations were used to correct the instrument readings[11]. The average concentration of 20 blanks was deducted from the recorded results before the level of each metal was calculated. Sample runs were conducted in triplicates.
2.4. Statistical Analysis
- Statistical analysis was performed using Analyse-it® statistical software for Microsoft Excel 2007. Test for significance was carried out at 95% confidence interval and tests was considered significant at P<0.05[12].
3. Results
- Figure1 shows the results of Fe concentrations in the various cereal grains at the different locations. The results revealed that with the exception of millet from Maiduguri, the Fe content was generally higher in the other cereals (i.e. maize, sorghum and rice) from Monguno. The cereals from Gashua in Yobe state showed, in most cases, moderate Fe concentrations compared to the other two locations. The sorghum from Monguno showed the highest concentration of Fe (17.89±0.67 μg/g) while the least Fe level (2.49±0.17 μg/g) was recorded in rice samples from Maiduguri. This pair of results obviously revealed an extremely wide variation in Fe content across locations. The Box-Whiskers plot (Figure 2) shows the concentration spread of Fe in the cereals. Due to the non-normal distribution the median concentration is represented on the plot. Rice (2.84μg/g) and Sorghum (9.17μg/g) presented the widest variations. On the whole, an average Fe concentrations in cereals Millet (10.28±2.38 μg/g), Maize (5.26±1.41μg/g), Sorghum (11.03±5.32μg/g) and Rice (6.67±5.94μg/g) was recorded in this study. Analyses of variance (ANOVA) showed that the variations of Fe concentrations between locations were, with the exception of Maiduguri and Gashua, significant (p< 0.05). On the basis of cereal type, the variations in Fe concentrations were significant (p< 0.05) for all pair wise, with the exception of sorghum and millet. Pearson correlation coefficient (r) values (Figure 3) for Fe concentrations between cereals showed that millet and maize (r = 0.76), maize and rice (r = 0.70) and sorghum and rice (r = 0.98) were higher than the high positive limit (r = 0.65) set for this study. Conversely, millet and sorghum showed the lowest correlation (r = 0.06) for Fe concentrations.
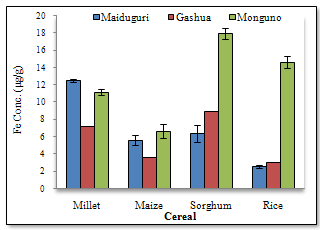 | Figure 1. Fe concentrations at the different locations |
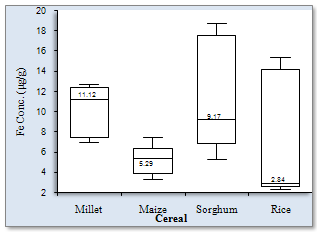 | Figure 2. Box-Whisker plot of Fe concentration spread in cereals |
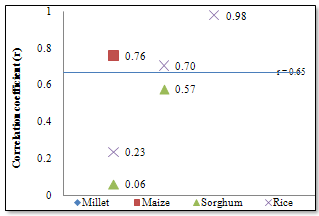 | Figure 3. Correlation coefficients of Fe concentrations in cereals |
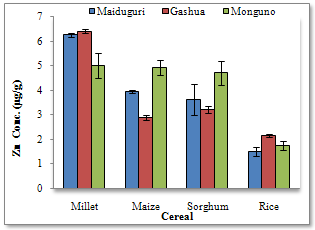 | Figure 4. Zn concentrations at the different locations |
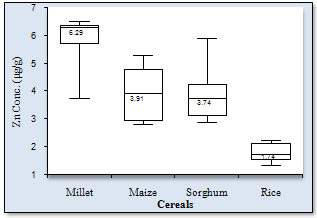 | Figure 5. Box-Whisker plot of Zn concentration spread in cereals |
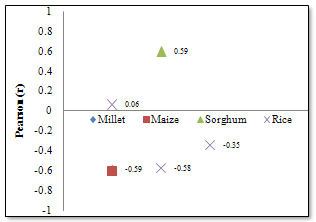 | Figure 6. Correlation coefficients of Zn concentrations in cereals |
4. Discussion
- The composition of Fe and Zn in the cereal grains analysed was based on wet-weight basis and the results obtained show high variability. Location especially, as well as type of cereal was found to play significant role in the variations. The levels of Fe were greatly influenced by location, while Zn levels were influenced by the cereal type. Fe and Zn contents of cereals can show wide variations[13]; differences could be considerable between mean contents of different cereals or within the same cereal species[14,15]. However, plants generally control their uptake of essential micronutrients and their translocation to the grain where there are sufficient phytoavailable amounts in the soil[16]. The grain- Fe and grain-Zn levels could vary significantly across field locations, suggesting a predominant environmental impact[17]. Thus, more than the genetic factors, the environmental conditions prevailing in the growing regions affect the mineral contents of food grains. In this study, sorghum and millet recorded the highest mineral contents with comparable concentrations for Fe. Millet and sorghum are good sources of trace elements, and are in fact, commonly used as weaning food for babies[18], among low-income populations. However, correlation results show the trend in association of these elements and the likely combination exposure effects from Fe in the cereals. The combination exposure effects for Fe were highest in sorghum and rice. There were clearly no strong sympathetic or antipathetic relations between the Zn contents of the cereal grains except pronounced association in Maize and Sorghum. In an effort to identify a better nutrient variety of the staple foods, the levels of Fe and Zn were correlated in the cereal grains analysed in this study. The highest positive correlation (r= 0.81) was found in maize, thus indicating the existence of varieties of maize that could concentrate more Fe and Zn in the grain. The maize plant in particular has a high demand for nutrients, particularly nitrogen and phosphorous for growth. Incidentally, the soil of the study area, which is nitrogen and phosphorus deficient, cannot fulfil this nutritional demand from soil-cultivation[19]. For this reason, the growing and optimal production of maize has to be supplemented with the use of nitrogen and phosphorous fertilizers, depending on the level of fertility of the soil. Generally, chemical fertilizers (NPK and Urea) which are the main sources of fertilizers for farmers[20] are very expensive and by far inadequate[21] at meeting the needs of the peasant farmers, and so farmers resort to the use of municipal waste and sewage sludge as nutrients for their crops, particularly cereals. Rice is traditionally grown in characteristic fertile soils of varying properties of low wetlands and river valleys using irrigation fed by springs and river diversions. Applications of fertilizers are normally not necessary in the wetlands. The main rice production areas in the study area are the vertisols of New Marte and Ngala which are part of the Lake Chad Basin (a huge depression filled with quaternary deposits), the Kumadugu-Yobe wetlands of Gashua and Nguru, and the Damasak-Yau rice irrigation scheme close to the Lake Chad. Rice from these areas is milled, packed and distributed within the north-east sub-region. However, very low levels of Zn were found in the rice samples analysed in this study consistent with the observation that the vertisols are a localized source of zinc deficiency in the Chad Basin region of North Eastern Nigeria[22].The Fe and Zn concentrations found in the cereal grains analysed in this study were compared with the levels reported in the literature. The 6.7 μg/g and 1.8 μg/g Fe and Zn levels found in the rice samples were much lower than the 25.0 μg/g and 18.0 μg/g reported for Fe and Zn in the unpolished rice from Taiwan[23]. Similarly rice cultivated in Tanzania was reported to contain 25.0 μg/g and 29.0 μg/g of Fe and Zn respectively[24]. However, the Fe content recorded for the rice sample was within the range of approximate composition (2.0-28.0 μg/g) for milled rice reported by FAO[25]; although the Zn level was less than the lower limit of the range (6.0-25.0 μg/g) reported by FAO for Zn in milled rice.Maize grains in this study were found to contain 5.3 μg/g and 3.9 μg/g of Fe and Zn respectively. These values were very low compared to the levels of Fe (20.0 μg/g) and Zn (10.0 μg/g) reported for maize flour from Tanzania[24], and the Fe (29.0 μg/g) and Zn (10.0 μg/g) levels found for maize flour in Kenya[26]. Comparatively, the Zn contents of the cereal grains analysed in this study were very low; Zn levels were highest in millet (5.89μg/g) and lowest (1.79μg/g) in rice. However, such consistently lower levels of Zn than Fe in the cereal grains have been reported elsewhere within the West African sub region[27,28]. In general, cereal grains are inherently very low in concentrations of Zn to meet daily requirements of humans and this could be aggravated by growing cereal crops on potentially Zn deficient soils leading to further decreases in grain-Zn concentration[14].On the other hand, the mean Fe contents recorded for sorghum, millet, maize and rice were found to be higher than the corresponding Fe levels reported by Oluyemi[29] for the same cereal grains from Ibadan in South Western Nigeria. However, the respective Zn levels in the same study were much higher than the concentrations reported in this study. Furthermore, the comparable mean Fe concentrations found in sorghum and millet (11.03 μg/g and 10.27 μg/g respectively) in this study were much higher than the respective levels (3.26 μg/g and 0.70 μg/g)[21] for sorghum and millet from Kano in North Western Nigeria. Similarly, the mean Zn levels for sorghum and millet reported in the same study were lower than the mean Zn concentrations found in this study for sorghum and millet respectively. The low cereal mineral levels reported around Kano might be associated with the phosphorus and zinc deficiencies observed in some partially irrigated schemes in Kano[22].Therefore, any contrast on the nutritional quality of the cereal grains analysed in this study could be attributed to differences of local soil conditions of the regions of cultivation and genetic variability of the seed genotypes. Direct relationship between low soil zinc levels and the occurrence of deficiency zinc contents of crops (rice), and human zinc deficiency were observed in Bangladesh[30], and in India[31], in which cereals are a major source of daily caloric intakes. As an alternative to food fortification, the micronutrient content of cereal grains could be improved through plant breeding or selection of appropriate plant strains. In the Philippines, a rice variety with 400-500% higher Fe content than common varieties was developed[32] for farmers to use on micronutrient-poor soils and improve nutritional quality simultaneously.More importantly, as with all cereals, most nutrients are concentrated in the outer layer of the grain; thus removing these layers in the milling process might result in the greater loss of minerals. Bauernfeind[33] reported a loss of 79% of Zn, 54% of Fe and 53% of Ca when a maize grain was milled and Maina[26] reported a 70% loss of Zn, 34% Fe and 13% Ca. Polishing and washing rice (i.e. polished and parboiled rice grain) could affect the Fe and Zn levels in the edible product[23]. In Nigeria, it is common practice to wash rice before cooking thus further reducing the amounts of essential minerals available for intake from the diet.Considering the nutritional value of food is on the basis of its essential trace contents, then millet and sorghum grown in the North Eastern Nigeria could be said to be more nutritious than rice and maize from the same area. However, the nutritional value of any diet depends also on the bioavailability of the elements within the food, i.e. the extent to which the essential elements in the diets are absorbed from the gastrointestinal tract and reaches the blood. The absence of dehulling, sieving and soaking have resulted in high amounts of phytic acid in some sorghum-based local dishes[28]. The bioavailability of Fe and Zn in cereals is affected by the presence of phytic acid and polyphenols in the grains[34-36]. The hull is rich in phytic acid which binds Fe and Zn and makes them biologically unavailable[37]. High concentration of phytic acid implies low absorption of Fe and Zn in the gastrointestinal tract, and this could lead to trace element malnutrition especially when cereals are used as weaning foods for children. On the other hand, the absorption of Fe and Zn could be boosted if a meal is taken with a portion of animal protein because these proteins prevent the elements from forming insoluble phytates with the phytic acid in the foods. However, food items rich in haem-Fe (meat, fish) are expensive and vitamin-C-rich vegetables and fruits (enhancers) are only available during a short period of the year. These constraints make it difficult to increase intake of micronutrients from poor quality diets.Similarly, tea which is commonly used as a drink with meals has high concentration of tannin, which may pose a problem, because tannin is another anti-nutrient compound which hinders the absorption of Fe. Thus, this dietary habit of the people invariably would reduce the absorption of nutritionally essential elements such as Fe and Zn from the staple foods. Therefore, means to enhance the absorption of these elements in staple foods have to be initiated. The traditional methods of soaking, fermentation and germination of grains and flours before cooking reported to reduce phytic acid considerably from cereal meal could be used at local rural households to improve the bioavailability of Fe and Zn from the diet. These methods are simple, cheap and effective but are not routinely practised in this region. A malnourished body more often than not absorbs more toxic elements than a well nourished one. For instance, low dietary intake of Fe, selenium (Se) and calcium (Ca) may lead to more absorption of lead (Pb) and cadmium (Cd) in the gastrointestinal tract[38]. Pb and Cd in the body are toxic as Pb interferes with physical and intellectual development of children and with utilisation of essential nutrients such as Fe and vitamin A[39].Malnutrition is not always a result of not having enough food to eat but often times it is on how to turn the available foods into safe and nutritious meals.
5. Conclusions
- This study revealed low levels of Zn and Fe in the cereal grains from the study area and this observation might be a risk factor for micronutrient malnutrition in the populations depending so much on such diets.It can be concluded that combining cereal grains in meals such as rice and sorghum are likely to improve on Fe intake.
ACKNOWLEDGEMENTS
- Authors wish to acknowledge the support of the Zonal Laboratory of National Agency for Food Drug Administration and Control (NAFDAC), for assisting in the elemental analysis.