-
Paper Information
- Previous Paper
- Paper Submission
-
Journal Information
- About This Journal
- Editorial Board
- Current Issue
- Archive
- Author Guidelines
- Contact Us
Food and Public Health
p-ISSN: 2162-9412 e-ISSN: 2162-8440
2012; 2(2): 5-11
doi: 10.5923/j.fph.20120202.02
The Risk Factors of Type 2 Diabetic Patients Attending Rajshahi Diabetes Association, Rajshahi, Bangladesh and Its Primary Prevention
 Abstract
 Reference
 Full-Text PDF
 Full-Text HTML
Rafiqul Islam , Obaidur Rahman
Department of Population Science and Human Resource Development, Rajshahi University, Bangladesh
Correspondence to: Rafiqul Islam , Department of Population Science and Human Resource Development, Rajshahi University, Bangladesh.
| Email: |  |
Copyright © 2012 Scientific & Academic Publishing. All Rights Reserved.
Diabetes is a serious harmful disease. The purpose of this study is to find out the risk factors of Type 2 diabetic patients in . For this purpose, the data are collected from the diabetic patients of Rajshahi Diabetes Association, . To fulfill this objective, chi square test and logistic regression analysis have been used. It is found that diabetes affects more in the age 35 years and over which is 89.7% in which 68.3% have type 2 diabetes. Again, 79.3% of diabetic patients have type 2 diabetes in which females (43.7%) are more affected than males (35.7%). It has been found that age, controlling diabetic through exercise, controlling diabetic through taking medicine and living house of the respondents are significantly associated with the type 2 diabetes of diabetic patients. It is also identified from logistic model that respondent’s age, occupation, controlling diabetic through dieting, controlling diabetic through exercise, controlling diabetic through taking medicine, time spending in walking, calorie intake according to diabetic food table and living house of the respondents have statistically significant effect on type 2 diabetes.
Keywords: Type 2 Diabetes, Test, Logistic Regression Analysis And Cross- Validity Prediction Power (CVPP)
Article Outline
1. Introduction
- Diabetes is classed as a metabolism disorder. It is a group of diseases characterized by high levels of blood glucose resulting from defects in insulin production, insulin action and both, and is associated with serious complications and premature death. Also, diabetes mellitus is a major public health care problem with increasing incidence and long term complications. It is a leading cause of illness and death across the world which is associated with continuing damage, dysfunction and failure of various organs including lungs[1]. The most common form of diabetes is type 2 diabetes which occurs when the pancreas is usually producing enough insulin but for unknown reasons the body can’t use the insulin effectively (this condition is called insulin resistance).Diabetes is an emerging issue in developing as well as developed countries of the world. It was estimated that the number of people with diabetes globally would increase from current 171 million to 366 by 2030[2]. In developed countries like United States which is one of the most vulnerable places in terms of number of diabetic patients in which diabetes was the seventh leading cause of death listed on U.S. death certificates in 2006[3]. An estimated 23.6 million people in the United States have diabetes which is about 7.8% of the total population. Of those, 17.9 million have been diagnosed and 5.7 million have not yet been diagnosed. In 2007, about 1.6 million people of ages 20 and older were diagnosed with diabetes, 57 million people and 2 million adolescents have pre-diabetes. 186300 (actually 0.22%) people under 20 years old have diabetes in which 1 in every 400 to 600 under 20 years old have type 1 diabetes. According to American Diabetes Association (2007), about 3% to 8% of pregnant women in the United States develop gestational diabetes, cases of diabetes doubled from 1990 to 2005 and by 2050, 48 million Americans will have type 2 diabetes[3]. An emerging epidemic of diabetes is affecting more people in low income than high income countries[2]. Diabetes poses a serious threat to developing countries like because the income of the most of the people in is very low. So is no longer in the safe area as far as the prevalence of this pandemic is concerned. Studies in various populations in Bangladesh have reported a prevalence of diabetes from 4% to 13% among adults with some variations by urban and rural settings[4-6]. BIRDEM (Bangladesh Institute of Research and Rehabilitation in Diabetes, Endocrine and Metabolic Disorders) is now providing diabetic care to almost 3.5 lacs patients from which about 3500 registered patients are taking health services from BIRDEM OPD every day[7]. In a small survey it is indicated that the prevalence of diabetes in Bangladesh in populations aged over 15 years is between 2%-5%[7]. It was estimated that about 90%-95% of all diabetes patients of Bangladesh belonged to type 2 diabetes[2]. They also mentioned that currently has over three million people with diabetes and this number will reach 11 million by the year 2030. If this situation continues, will face severe crisis. As a developing country, it does not have the resource to tackle this situation. So, it is important to identify the risk factors and to prevent this epidemic. It was seen that the related risk factors were older age, duration of diabetes, poor control of diabetes and hypertension[8]. Some studies reported that age, hypertension and body mass index (especially overweight and obesity) were significantly and independently associated with an increase in type 2 diabetes [9-12]. It was observed that sex and hypertension is as independent factors for the abnormalities in glucose tolerance [13]. Besides this, age, sex, higher income and waist to hip ratio appeared to be important risk factors for the occurrence of type 2 diabetes in Bangladeshi population[4,5,14]. Again, it was concluded that the risk factors for type 2 diabetes are likely to differ in different population[14]. Bangladesh is an agro-based South-Asian delta and predominantly rural with high density. The population of Bangladesh is increasing day by day. In this situation, it would be difficult to ensure basic needs including food, cloth, education, shelter, health and communication for a large number of populations within the limited geographic area. Besides this, the literacy rate is very low. The female literacy rate is 38.1% where as the male literacy rate is 55.61%[15]. Not only the illiterate person but also most of the literate person are not conscious about their health. Because of poor economy they do not get proper health service. Most of them don’t know about their diabetic situation. But undiagnosed pre-diabetes and diabetes is a major health problem[16]. Also, ICDDR,B (2009) found that diabetes and pre-diabetic conditions exist as a significant but hidden public health problem in Matlab and suggested that primary prevention may reduce the burden of diabetes in the community[17]. Studies in Finland, the United States, and China demonstrated that diabetes can be prevented in more than half of the individuals with pre-diabetic conditions through interventions to modify lifestyles[18-20]. Although the population with pre-diabetic conditions is always much larger than the diabetic population, it offers an opportunity for primary prevention. So, the objective of this study is to identify the risk factors of type 2 diabetes and recommend some appropriate policy for primary prevention of type 2 diabetes.
2. Data and Methodology
- A total number of 300 diabetic patients (140 male and 160 female) were interviewed during to by some selected socio-economic, demographic, diabetic disease and health consciousness related question from Rajshahi Diabetes Association, by purposive sampling technique. The bivariate and logistic regression analysis has been used for above objective. Bivariate analysis is used to test the association between the categorical variables by applying chi square test. But bivariate analysis does not allow for quantification or testing the strength of the risk factors of diabetic patients among selected variables. For that reason, logistic analysis is used to identify the significant variables and determinants of type 2 diabetes. Logistic regression analysis is very useful for identifying various risk factors in case of qualitative variables. 24 Cox developed linear logistic regression model [21]. Later, Lee also developed logistic regression model [22]. The logistic regression model can be not only to identify the risk factors but also to predict the probability of success. This model expresses a qualitative dependent variable as a function of several independent variables, both qualitative and quantitative[23]. In logistic analysis, type 2 diabetes is considered as dependent variable. Let, Y be type 2 diabetes that is a dichotomous dependent variable, which takes values 1 and 0, that is, Y is classified in the following way:
 It is noted that the explanatory variables used in this model are mentioned in Table 2.In this paper, to assess the accuracy and reliability of the model, the CVPP,
  , is applied. The mathematical formula for CVPP is specified by
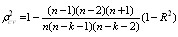 .In which, n is the number of cases, k is the number of regressors in the fitted model and the cross-validated R is the correlation between observed and predicted values of the predictand variable[24]. The shrinkage of the model is the positive value of (
 - R2); where
 is CVPP & R2 is the coefficient of determination of the model. Moreover, 1-shrinkage is the stability of R2 of the model. The estimated CVPP and shrinkage are presented at the bottom of Table 2.
 3. Results and Discussion
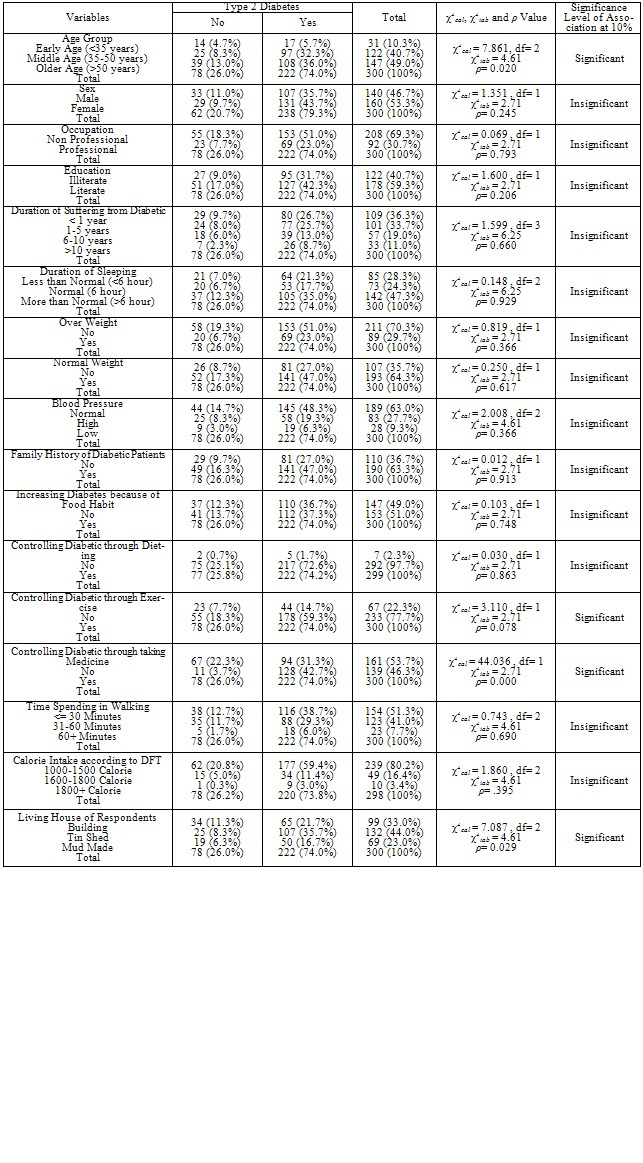
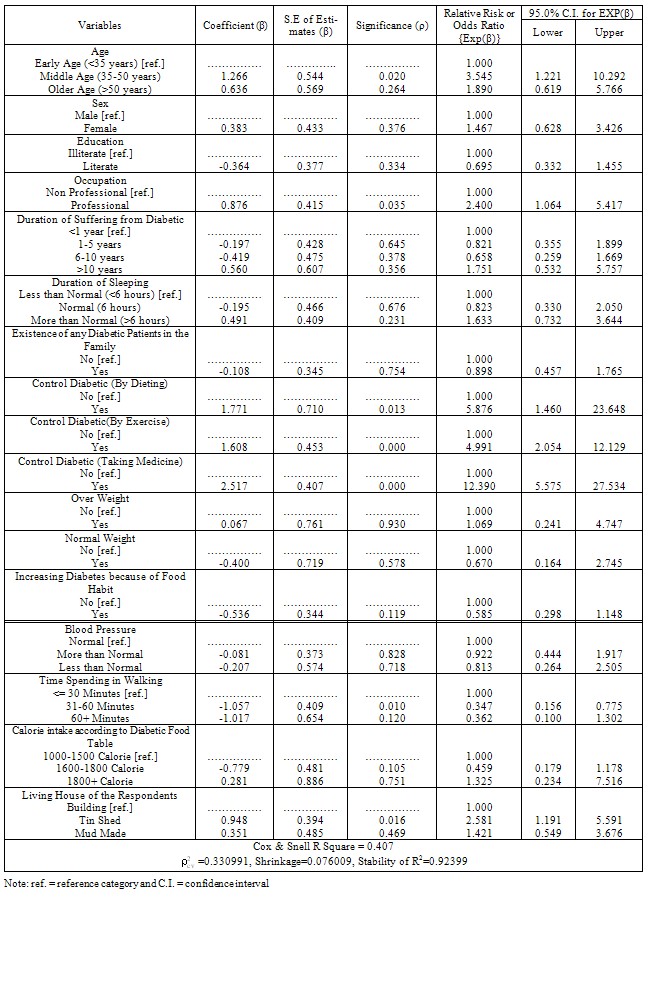
- The result of association between type 2 diabetes among some selected socio-economic, demographic, diabetic disease and health consciousness related characteristics of diabetic patients have been demonstrated in Table 1. Table 1 reveals that most of the diabetic patients are belonged in the middle and older age group. Diabetes affects more in the age 35 years and over which is 89.7% of which 68.3% of the total respondent have type 2 diabetes. In middle age group, 32.3% out of 40.7% and in older age group, 36% out of 49% diabetic patients have type 2 diabetes. It is similar to other studies. It was observed that prevalence of diabetes was associated with increasing age[25]. Also, it was showed a higher diabetes mellitus rate in older people[8]. Again, total 79.3% diabetic patients have type 2 diabetes in which 35.7% and 43.7% are male and female respectively. So it is clear that females are more affected by type 2 diabetes than males. It is observed that professional persons (23%) are less affected by type 2 diabetes than non professional persons (51%). Among the total no. of diabetic patients, type 2 diabetes affects more in literate persons (42.3%) than illiterate persons (31.7%). The majority no. of diabetes patients is suffering from diabetes less than one year which is 36.3% in which 26.7% patients have type 2 diabetes. Most of the diabetic patients (47.3%) are sleeping more than normal (>6 hours) where 35% have type 2 diabetes, 24.3% and 28.3% diabetic patients are sleeping normal (6 hours) and less than normal (<6 hours) respectively in which 17.7% and 21.3% have type 2 diabetes respectively. There are 29.7% and 64.3% diabetic patients who have over weight and normal weight respectively where 23% over weighted and 47% normal weighted patients have type 2 diabetes. Among total respondents, 48.3%, 19.3% and 6.3% respondents who have normal, high and low blood pressure respectively has type 2 diabetes. Again, the majority no. of diabetic patients (63.3%) has one or more diabetic patients in their family where 47% have type 2 diabetes and there are about half of the total respondents (51%) whose diabetes is increasing because of food habit in which 37.3% have type 2 diabetes. There are 72.6%, 59.3% and 42.7% type 2 diabetic patients who are controlling their diabetes through dieting, exercise and medicine respectively. Again, 38.7%, 29.3% and 6% type 2 diabetic patients are spending their time in walking for ≤ 30 minutes, 31-60 minutes and > 60 minutes respectively. Again, 59.4%, 11.4% and 3% respondents who has type 2 diabetes gets daily within the range of 1000-1500 calorie, 1600-1800 calorie and 1800+ calorie from foods according to diabetic food table (DFT) respectively. Most of the living house of the respondents is tin shed which is 44% of which 35.7% have type 2 diabetes, 33% respondents and 23% respondents have their living house as building and mud made respectively of which 21.7% and 16.7% have type 2 diabetes respectively.From the Table 1, it is also found that age, controlling diabetic through exercise, controlling diabetic through taking medicine and living house of the respondents are significantly associated with the type 2 diabetes of diabetic patients. This result is also reflected in the study by[10]. It was identified that older age and poor control of diabetes are significantly associated with an increase in diabetes[8]. On the other hand, sex, education, occupation, duration of suffering from diabetic, duration of sleeping, overweight, normal weight, blood pressure, family history of diabetic patients, controlling diabetic through dieting, increasing diabetes because of food habit, time spending in walking and calorie intake according to DFT are insignificantly associated with the type 2 diabetes of diabetic patients. The results of logistic regression model are shown in Table 2. According to the fitted model, there are eight variables out of seventeen variables appear as the approximately significant predictors of type 2 diabetes of the diabetic patients. In accordance with their importance, respondent’s age, occupation, controlling diabetic through dieting, controlling diabetic through exercise, controlling diabetic through taking medicine, time spending in walking and living house of the respondents have statistically significant effect on type 2 diabetes and calorie intake according to diabetic food table have statistically approximately significant effect on type 2 diabetes. On the other hand, respondent’s sex, education, duration of sleeping, duration of suffering from diabetic, increasing diabetes because of food habit, existence of any diabetic patients in the family, overweight, normal weight and blood pressure have no any statistically significant effect on type 2 diabetes. Moreover, from the Table 2 it appears that the fitted model is 40% cross- validated and the corresponding shrinkage coefficient is 0.076009. This implies that the fitted model be stable more than 33%. The stability for R2 of this model is more than 92%. The regression coefficients of the respondent’s current age are being calculated. From this result, it is appeared that the respondent’s current age is the most significant factor affecting the type 2 diabetes. It has also been found in bivariate analysis. The regression coefficient of middle age and older age are 1.266 and 0.636 respectively and the corresponding odds ratio is 3.545 and 1.890 respectively. It indicates that the middle aged and older aged diabetes patients are 3.545 times and 1.890 times more in risk to develop the type 2 diabetes than that of earlier aged diabetic patients respectively which is also similar to the study conducted by [5,8,14, 26]. It is clear that middle aged population have greater risk to develop type 2 diabetes than other aged population. The logistic regression coefficient of professional respondents is 0.876 and the corresponding odds ratio is 2.400 which imply that the risk of type 2 diabetes for professional respondents is 2.400 times higher than that of non- professional respondents. Although professional respondents earn more than non-professionals, professional respondents have high risk to develop type 2 diabetes because they do not get enough time to exercise as well as physical movement. This result is supported by[5] because they identified that higher income was a significant risk factor of type 2 diabetes.The regression coefficients of the respondents who are controlling their diabetes through dieting, exercise and taking medicine are 1.771, 1.608 and 2.517 respectively and their corresponding odds ratio are 5.876, 4.991 and 12.390 respectively. It indicates that the risk of the type 2 diabetes of the respondents who are controlling their diabetes through dieting are 5.876 times higher than that of respondents who are not controlling their diabetes through dieting, the risk of the type 2 diabetes of the respondents who are controlling their diabetes through exercise are 4.991 times higher than that of respondents who are not controlling their diabetes through exercise and the risk of the type 2 diabetes of the respondents who are controlling their diabetes through taking medicine are 12.390 times higher than that of respondents who are not controlling their diabetes through taking medicine. This result also clarify that poor control of diabetes is another risk factor of diabetes which is similar to another study done[10].
|
|
4. Conclusions and Recommendations
- In this study, it is observed that people are more affected in middle (35-50 years) and older (>50 years) ages by type 2 diabetes which is 66.3%. Of those, female (43.7%) are more affected than male (35.7%). The majority number of diabetes patients (36.3%) is suffering from diabetes less than one year in which 26.7% patients have type 2 diabetes. 35% type 2 diabetic patients are sleeping more than normal (> 6) hours and 47% type 2 diabetic patients have one or more diabetic patients in their family. Most of the type 2 diabetic patients (38.7%) are spending their time in walking for ≤ 30 minutes. Again, 35.7% type 2 diabetic patients’ living house is tin shed which implies that type 2 diabetes affects more in low income group. It is found that age, controlling diabetic through exercise, controlling diabetic through taking medicine and living house of the respondents are significantly associated with the type 2 diabetes of diabetic patients. Again, it has been identified that respondent’s age, occupation, controlling diabetic through dieting, controlling diabetic through exercise, controlling diabetic through taking medicine, time spending in walking and living house of the respondents have statistically significant effect on type 2 diabetes and increasing diabetes because of food habit and calorie intake according to diabetic food table have statistically approximately significant effect on type 2 diabetes.Since type 2 diabetes is mostly common of the diabetic patients in , it may be one of the major impediments of healthy life as well as economic growth. In this study, some recommendations for controlling diabetes as well as for better health are given: (i) To exercise regularly with increasing physical activities and to control blood pressure especially high blood pressure. If persons have over weight and obesity, they must have to lose the extra weight of the body and everyone should sleep normal hours (6 hours). (ii) To avoid the habit of unnecessary eating and take foods with high fiber. (iii) To provide the adequate availability and access of health services and to provide correct information about diabetes to the people through various media.