-
Paper Information
- Next Paper
- Previous Paper
- Paper Submission
-
Journal Information
- About This Journal
- Editorial Board
- Current Issue
- Archive
- Author Guidelines
- Contact Us
Food and Public Health
p-ISSN: 2162-9412 e-ISSN: 2162-8440
2012; 2(1): 50-54
doi:10.5923/j.fph.20120201.10
Presence and Levels of Common Polynuclear Aromatic Hydrocarbons (PAHs) in Staple Foods of Nigerians
 Abstract
 Reference
 Full-Text PDF
 Full-text HTML
Dike Henry Ogbuagu1, Adedolapo Abeke Ayoade2
1Department of Environmental Technology, Federal University of Technology, PMB 1526, Owerri, Nigeria
2Department of Zoology, University of Ibadan, Nigeria
Correspondence to: Dike Henry Ogbuagu, Department of Environmental Technology, Federal University of Technology, PMB 1526, Owerri, Nigeria.
| Email: |  |
Copyright © 2012 Scientific & Academic Publishing. All Rights Reserved.
We investigated the presence and levels of 11 polynuclear aromatic hydrocarbons (PAHs) in 4 commonly consumed roasted food delicacies in Owerri, a southeastern city of Nigeria. Freshly roasted plantain, yam, fish and meat (popularly called suya) samples were purchased from 10 roadside fast-food sellers in the municipality, preserved in labelled sterile amber bottles with benzene and taken to the laboratory in iced-chest. A gas chromatograph coupled with flame ionization detector (GC-FID) was used in the analysis of samples. The single factor ANOVA and means plots were used to detect homogeneity in mean variance and structure of group means of the PAHs determined in the foods, respectively. Roasted plantain contained the highest level of combined PAHs measured (0.0465 mg/kg), followed by suya (0.0372 mg/kg); with mean concentrations of 0.004227 (± 0.0019135) and 0.003382 (± 0.0023045) mg/kg, respectively. However, least concentration of the combined PAHs of 0.0135 (0.001227 ± 0.0004152) mg/kg was recorded in roasted fish. There was significant heterogeneity [F(214.52)>Fcrit(3.95)] at P<0.05 (95% confidence limit) in the concentrations of the PAHs in the foods sampled. Post-hoc means plots revealed that the heterogeneity was most contributed by fluorene in suya, acenaphthene and phenanthrene in roasted fish, phenanthrene and anthracene in roasted plantain, and anthracene in roasted yam samples. The higher concentrations of these hydrocarbons in suya than roasted yam could be due to the longer roasting duration, higher fat content of meat, and pyrolysis resulting from melted fat from meat dropping onto the heat source. However, the higher concentrations of combined PAHs recorded in roasted plantain than meat (suya) and roasted fish could be due to the closer distances the plantain samples were (usually) placed to the source of the heat and the higher temperature required for roasting the plantains than meat and fish. The study reveals high concentrations of the PAHs in the foods sampled. This therefore places the several consumers at potential health risk.
Keywords: Polynuclear Aromatic Hydrocarbons, Owerri Municipality, Suya, Roasted Foods, Food Vendors
Cite this paper: Dike Henry Ogbuagu, Adedolapo Abeke Ayoade, Presence and Levels of Common Polynuclear Aromatic Hydrocarbons (PAHs) in Staple Foods of Nigerians, Food and Public Health, Vol. 2 No. 1, 2012, pp. 50-54. doi: 10.5923/j.fph.20120201.10.
Article Outline
1. Introduction
- The polynuclear aromatic hydrocarbons (PAHs), a large group of organic chemicals containing two or more fused aromatic rings of carbon and hydrogen atoms, could be formed during processing of coal, crude oil and natural gas, incomplete combustion of coal, oil, gas, garbage and other organic substances (ATSDR, 1995). They could also be found in cigarette smoke, exhausts from automobiles and machineries, asphalt, coal tar and creosote-treated wood products (ATSDR, 1995; Masih et al., 2008), as well as from natural sources such as volcanoes. They are lipophilic, chemically stable (Decker, 1981; Boehm et al., 1981) and can be found practically every where in soil, water and food. Their presence in food is of major interest, as they could be found in cereals, grains, flour bread, vegetables, fruits, meats, processed or pickled foods and even contaminated cow milk (Bartle, 1991; Falco et al., 2003). Knize et al. (1999) observed that some cooking methods such as roasting, barbecuing and smoking increases the levels of PAHs in foods, while steaming and boiling barely introduces PAHs. According to the WHO (1998), for an adult who do not even smoke, PAHs levels in foodstuff contributes more than 90% of total exposure. For a smoker, benzo(a)pyrene intake is estimated to be about 210 ng, which is equivalent to 20 cigars, while mean intake from food for the same PAH was about 110 ng (SCF, 2002). The formation of PAHs on roasted foods has been observed to be dependent on the distance of food from the heat source (Phillips, 1999), fat content of the food (Knize et al., 1999), duration of roasting (Nawrot et al., 1999), temperature used (WHO, 1998), whether melted fat is allowed to drop onto the heat source (SCF, 2002), and type of fuel used (SCF, 2002). The health effects of PAHs, under certain circumstances include tumour formation and carcinogenicity in at least, laboratory animals (WHO, 1997; Ogbuagu et al., 2011). In Nigeria, the consumption of roasted foods offers rapid supply of protein, carbohydrate, fat, vitamins and minerals to several consumers especially of the middle and lower classes. Increasingly, these fast-food centres which are often sited at strategic locations, especially at road and street junctions serve the growing interests of both city and suburb dwellers. This research sought to determine the presence and levels of common PAHs in four roasted staple food stuffs of Nigerians (plantain- Musa paradrica, yam- Dioscorea spp., fish and meat) as pointers to potential health hazards to public consumers.
2. Materials and Methods
- The study was conducted in the municipality of Owerri; a south-eastern city of Nigeria located within longitude 7° 02' E and latitude 5° 29' N (Fig. 1). Freshly roasted plantain, yam, fish and meat (popularly called suya) samples were purchased from 10 roadside fast-food sellers, preserved in labeled sterile amber bottles with benzene and taken to the laboratory in iced-chest. The roasting utilized charcoal as source of energy and was done with the foods placed on wire gauze placed over the burning charcoal at various distances, depending on the food roasted. Meat and fish were placed farther from the heat source than plantain and yam in order to prevent charring/burning and to achieve roasting more gradually in them.
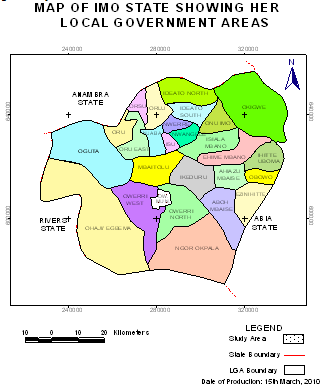 | Figure 1. Map of Imo State showing Owerri Municipality, the study area |
3. Statistical Analysis
- Descriptive statistics as provided by the MS Word© and SPSS© 17.0 were utilized. The single factor analysis of variance (ANOVA) and means plots were used to detect homogeneity in mean variance and structure of group means of the PAHs determined in the foods, respectively.
4. Results
- Of the PAHs measured in the foods, fluorine had the highest and pyrene the least mean concentrations of 0.0088 and 0.0004 mg/kg, respectively. Naphthalene, methylnaphthalene, and acenaphthylene varied between 0.0003 and 0.0006 (0.00048 ± 0.00008), 0.0002 and 0.0028 (0.00135 ± 0.00068), and 0.0002 and 0.0021 (0.0009 ± 0.00041) mg/kg, respectively (Table 1). Acenaphthene, fluorine, and phenanthrene varied from 0.0007-0.0033 (0.00173 ± 0.00055), 0.0003-0.0262 (0.0088 ± 0.00589), and 0.0004-0.0169 (0.00605 ± 0.00369) mg/kg, respectively. However, anthracene ranged from 0.0006 to 0.0165 (0.00723 ± 0.00361), fluoranthene from 0.0008 to 0.0030 (0.00185 ± 0.00045), pyrene from 0.0000 to 0.0008 (0.0004 ± 0.00017), benzo(a)anthracene from 0.0000 to 0.0019 (0.00048 ± 0.00047), and chrysene from 0.0000 to 0.0025 (0.00063 ± 0.00063) mg/kg. Naphthalene, methylnaphthalene, and acenaphthylene recorded highest concentrations of 0.0006, 0.0028, and 0.0021 mg/kg in plantain and yam, plantain, and fish samples, respectively (Fig. 2), with minimum concentrations of 0.0003, 0.0002, and 0.0002 in suya, fish and yam, and suya samples, respectively. Maximum acenaphthene, fluorene, and phenanthrene concentrations of 0.0033, 0.0262, and 0.0169 mg/kg were recorded in fish, suya, and plantain samples, respectively, while least concentrations of 0.0007, 0.0003, and 0.0004 mg/kg were recorded in suya, fish, and yam samples, respectively (Fig. 3). However, maximum anthracene, fluoranthene, and pyrene levels of 0.0165, 0.0030, and 0.0008 mg/kg were recorded in plantain, yam, and yam samples (Fig. 4), while those for benzo(a) anthracene and chrysene (0.0019 and 0.0025 mg/kg) were recorded in suya and yam (Fig. 5), respectively. While least concentrations of 0.0006, 0.0008, and 0.0000 mg/kg were recorded for anthracene, fluoranthene, and pyrene in suya, fish, and suya, respectively, benzo(a) anthracene and chrysene were undetected in the other foods.
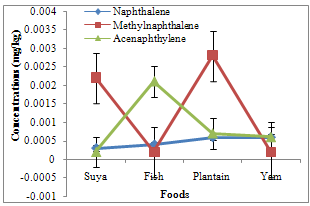 | Figure 2. Concentrations of naphthalene, methylnaphthalene and acenaphthylene in roasted foods |
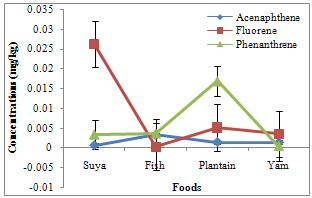 | Figure 3. Concentrations of acenaphthene, fluorene and phenanthrene in roasted foods |
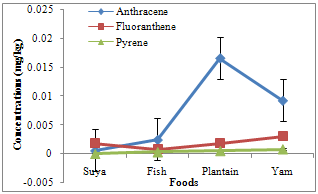 | Figure 4. Concentrations of anthracene, fluoranthene and pyrene in roasted foods |
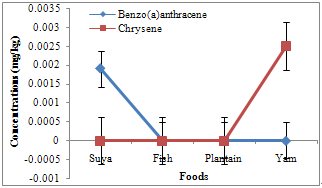 | Figure 5. Concentrations of benzo(a)anthracene and chrysene in roasted foods |
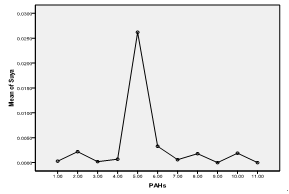 | Figure 6. Means plot of heterogeneity in PAH levels in suya (roasted meat) samples |
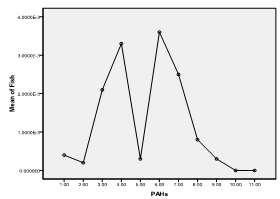 | Figure 7. Means plot of heterogeneity in PAH levels in roasted fish samples |
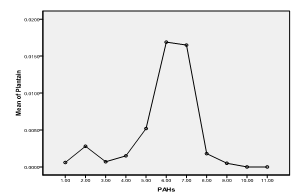 | Figure 8. Means plot of heterogeneity in PAH levels in roasted plantain samples |
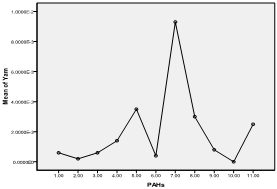 | Figure 9. Means plot of heterogeneity in PAH levels in roasted yam samples |
5. Discussion
- The higher concentrations of these hydrocarbons in suya than roasted yam could be due to the longer roasting duration (as was also observed by Nawrot et al., 1999), higher fat content of meat (as was also observed by Knize et al., 1999) and pyrolysis resulting from melted fat from meat dropping onto the heat source (as was also observed by the SCF, 2002). However, the higher concentrations of combined PAHs recorded in roasted plantain than meat (suya) and roasted fish could be due to the closer distances the plantain samples were (usually) placed to the source of the heat (as was also observed by Phillips, 1999) and the higher temperature required for roasting the plantains than meat and fish (as was also observed by the WHO, 1998). Suya and fish are often roasted by the food vendors with comparatively lower temperatures to avoid burning and charring from high temperatures. The least concentrations of pyrene, chrysene and benzo(a) anthracene in the foods indicate that these PAHs were not abundant in the woods (charcoal) used for their roasting.The heterogeneity contributed especially by fluorene in suya, phenanthrene in roasted fish and plantain, and anthracene in roasted yam corresponds to their maximum concentrations in the foods. Since the maximum allowable limit for PAHs in drinking water of man (which is also a consumable like these foods) is 0.0002 ppm (WHO, 1984), the current study therefore reveals much higher concentrations in the foods sampled. This therefore places the several consumers at potential health risk. However, this study reveals low levels of chrysene when compared with the findings of the European Food Safety Authority in June 2007 (updated in June 2008) (EFSA, 2008), wherein, of the individual PAHs tested, chrysene was most commonly found in food samples that were negative for benzo(a)pyrene; with the highest level of 242 µg/kg. In that study, the median dietary exposure across European countries for various groups of the PAHs tested for both average and high dietary consumers varied between 235 and 3078 ng/day (3.9 and 51.3 ng/kg body weight per day, respectively), and the two highest contributors to dietary exposure were cereals and cereal products, and seafood and seafood products (EFSA, 2008).
6. Conclusions
- Maximum fluorene concentrations were recorded in roasted meat (suya), phenanthrene in roasted fish and plantain, and anthracene in roasted yam. Concentrations of pyrene, chrysene and benzo(a)anthracene were least detected in the foods. Fluorene in suya, acenaphthene and phenanthrene in roasted fish, phenanthrene and anthracene in roasted plantain, and anthracene in roasted yam were implicated to be most responsible for an observed significant heterogeneity in mean variance of the PAHs in the food samples. Though roasted plantain contained the highest levels of combined PAHs measure, suya also contained high levels of the hydrocarbons, with roasted fish containing the least level of the combined aromatic hydrocarbons. The methods of roasting appeared to influence PAH adsorption/absorption on/in the foods sampled. Levels of the PAHs were higher than regulatory permissible limits of the World Health Organization in consumable water.
References
| [1] | Agency for Toxic Substances and Disease Registry (ATSDR), 1995, Public Health Statement for Polycyclic Aromatic Hydrocarbons (PAHs). Agency for Toxic Substances and Diseases Registry (ATSDR), US Department of Health and Human Services, Public Health Services, Atlanta. |
| [2] | Bartle, K.D., 1991, Analysis and occurrence of PAHs in food, In: C.S. Creaser & R. Purchase (Eds.), Food contaminants: sources and surveillance. Cambridge: Royal Society of Chemistry, p. 41-60. |
| [3] | Boehm, P.D., Fiest, D.L. and Elskus, A., 1981, Comparative Weathering Patterns of Hydrocarbons from Amoco Cadiz Oil Spill Observed at a Variety of Coastal Environment. International Symposium on the Fate and Effects of Oil Spill, Brest, 7 October 1981, pp. 159-173. |
| [4] | Decker, J.C., 1981, Potential Health Hazards of Toxic Residues in Sludge. In Sludge-Health Risk of Land Application. Ann Arbor Science Publishers Inc., Ann Arbor, pp. 85-102. |
| [5] | European Food Safety Authority (EFSA), 2008, Polycyclic aromatic hydrocarbons in food: Scientific opinion of the Panel on Contaminants in the food chain. European Food Safety Authority, (Question N° EFSA-Q-2007-136), 724, 1-114. |
| [6] | Falco, G., Domingo, J.L., Lobet, J.M., Teixido, A., Casas, C. and Müller, L., 2003, PAHs in foods: Human exposure through the diet in Catalonia, Spain. Journal of Food Protection, 66(12), 2325-2331. |
| [7] | Knize, M.G., Salmon, C.P., Pais, P. and Felton, J.S., 1999, Food heating and the formation of heterocyclic aromatic amine and PAH mutagens/carcinogens, In: L.S. Jackson, M.G. Knize & J.N. Morgan (Eds.). Impact of processing on food safety. New York: Kluwer Academic. |
| [8] | Masih, A., Saini, R. and Taneja, A., 2008, Contamination and Exposure Profiles of Priority Polycyclic Aromatic Hy-drocarbons (PAHs) in Groundwater in a Semi-Arid Region in India. International Journal of Water, 4(1-2), 136-147. doi:10.1504/IJW.2008.018152 |
| [9] | Nawrot, P.S., Vavasour, E.J. and Grant, D.L., 1999, Food irradiation, heat treatment and related processing techniques: Safety evaluation, In: K. Van der Heijden, M. Younes, L. Fishbein & S. Miller (Eds.). International Food Safety Handbook, New York: Marcel Dekker, p. 306-308. |
| [10] | Ogbuagu, D.H; Okoli, C.G; Gilbert, C.L. and Madu, S., 2011, Determination of the contamination of groundwater sources in Okrika mainland with polynuclear aromatic hydrocarbons (PAHs). British Journal of Environment and Climate Change, 1(3), 90-102. |
| [11] | Phillips, D.H., 2002, PAHs in diet. Mutation Research, 443, 139-147. |
| [12] | Scientific Committee on Foods of EC (SCF), 2002, Opinion of the Scientific Committee on Food in the risk to human health of PAHs in food. Brussels: SCF. |
| [13] | World Health Organization (WHO), 1984, Guidelines for Drinking Water Quality,” Geneva. |
| [14] | World Health Organization (WHO), 1998, Environmental health criteria 202, selected non-heterocyclic PAHs, Geneva. |
| [15] | World Health Organizations (WHO), 1997, Non-heterocyclic Polycyclic Aromatic Hydrocarbons. Environmental Health Criteria, International Programme on Chemical Safety, World Health Organization, Geneva, Vol. 202, 1997 |