-
Paper Information
- Next Paper
- Paper Submission
-
Journal Information
- About This Journal
- Editorial Board
- Current Issue
- Archive
- Author Guidelines
- Contact Us
Food and Public Health
p-ISSN: 2162-9412 e-ISSN: 2162-8440
2012; 2(1): 1-5
doi:10.5923/j.fph.20120201.01
Mineral Profile of Pito from Accra, Tamale, Bolgatanga and Wa in Ghana
 Abstract
 Reference
 Full-Text PDF
 Full-text HTML
G. O. Duodu1, E. O. Amartey2, A. B. Asumadu-Sakyi3, C. A. Adjei3, F. K. Quashie3, I. Nsiah-Akoto3, G. Ayanu4
1Radiological and Medical Sciences Research Institute, Ghana Atomic Energy Commission, Legon, P. O. Box LG 80, Ghana
2National Data Centre, NNRI, Ghana Atomic Energy Commission, Legon, P. O. Box LG 80, Ghana
3Nuclear Application Centre, NNRI, Ghana Atomic Energy Commission, Legon, P. O. Box LG 80, Ghana
4Nuclear Chemistry and Environmental Research Centre, NNRI, Ghana Atomic Energy Commission, Legon, P. O. Box LG 80, Ghana
Copyright © 2012 Scientific & Academic Publishing. All Rights Reserved.
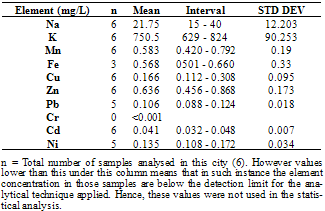
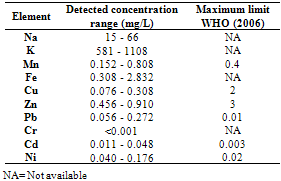
This study was undertaken to investigate the mineral profile of pito, a traditionally brewed alcoholic beverage popularly consumed along West Coast of Africa. Pito samples from four cities in Ghana namely; Bolgatanga, Tamale, Wa and Accra were analysed for their metal content. Concentrations of Na, K, Mn, Cu and Zn, were measured in all the samples analysed. However, Fe, Ni, Cd and Pb recorded 70%, 83%, 58% and 79% incidence respectively in the samples, but Cr was measured below detection limit in all the samples. The concentrations of Na, K, Mn, Cu, Zn, Fe, Ni, Pb and Cd recorded ranged between 15 to 66mg/L, 581 to 1108mg/L, 0.152 to 0.808mg/L, 0.076 to 0.308mg/L, 0.456 to 0.910mg/L, 0.308 to 2.832mg/L, 0.040 to 0.176mg/L, 0.056 to 0.272mg/L and 0.011 to 0.048mg/L respectively. With the exception of Mn, all the essential minerals measured were below the recommended WHO maximum limits in water. Hence pito is a good source of K, Na, Fe, Cu and Zn. The detected concentrations of Ni, Pb and Cd in the pito samples were however, above the respective maximum WHO guideline in water. Therefore pito is susceptible to metal contamination due to poor handling and primitive equipment used in the production and consumers should be apprehensive of the environs where the pito is prepared.
Keywords: Pito, Mineral, Concentration, Guideline, Maximum Limit, Recorded
Cite this paper: G. O. Duodu, E. O. Amartey, A. B. Asumadu-Sakyi, C. A. Adjei, F. K. Quashie, I. Nsiah-Akoto, G. Ayanu, Mineral Profile of Pito from Accra, Tamale, Bolgatanga and Wa in Ghana, Food and Public Health, Vol. 2 No. 1, 2012, pp. 1-5. doi: 10.5923/j.fph.20120201.01.
Article Outline
1. Introduction
- Pito is a local traditionally brewed alcoholic beverage in some parts of West Africa including Ghana. It is produced mainly from the grains of guinea corn (Sorghum vulgare and Sorghum bicolor)[1] and/or millet. Sorghum is one of the most important crops in Africa, Asia and Latin America[2,3]. More than 35% of sorghum is grown directly for human consumption. The rest is used primarily for animal feed, alcohol production and industrial products[3,4,5,].Pito is golden yellow to dark brown in colour with taste varying from slightly sweet to very sour and contains sugars, lactic acid, amino acids, 2-3% alcohol, proteins and vitamins[6]. As described by[7], the process of production of burukutu involves washing of the grains, steeping, malting, mashing, wort extraction, fermentation and maturation. The microorganisms associated with fermentation include Saccharomyces cerevisiae, Saccharomyces chavelieria and Leuconostoc mesteroides. The process of pito production is similar to burukutu production except that, in pito production, the pH increases from about 4.2 to 6.2 within 24h of fermentation and it decreases further to 3.7 after 48h if different types of grains are used to brew it and no adjunct is added[8]. Geotrichum candidum and Lactobacillus species have been described to be responsible for souring pito[1].Due to differences in wort extraction and fermentation processes, 4 types of pito namely, Nandom, Dargati, Togo and Kokomba are consumed in Ghana. Their peculiar differences and characteristics are described by Sefa-Dedeh et al, 1999. Pito is popularly consumed in the three northern regions and the Zongo communities (settlements of the northerners in the southern sector of Ghana) of Ghana, parts of , and other parts of [9]. Due to the simplicity of production, availability of raw plant materials and abject poverty in these communities, pito brewing can provide an important source of income for otherwise cash-poor households in rural areas. In Ghana, Pito is not found bottled or canned, and, as a rule, is purchased directly from the household in which it is brewed. It is typically served in a calabash outside the producer's home where benches are sometimes provided.Studies by Kolawole et al. 2007, looking at the nutritional composition and microbial analysis of pito found out that they contained mineral elements such as calcium, magnesium and iron that were essential for regulating and building the living cells and aid in fighting depression. Microorganisms such as Staphylococcus aureus, Esherichia coli, Bacillus subtilis, Streptococcus species, Proteus species, Rhizopus stolonifer, Aspergillus flavus, Aspergillus niger, Saccharomyce cerevisiae and Mucor species were also isolated from the samples. They explained that the presence of some these microorganisms in the samples may be attributed to poor handling during production. Some strains of E. coli can cause gastroenteritis and urinary tract infection as well as diarrhea in infant.Due to the crude nature of production and poor handling during and after preparation, the elemental profile was carried out to ascertain the introduction of some metals into pito. Assessment of nutritional quality and safety of food consumed by the public is an important tool for the development of nutritional and health policies in a nation[10]. Humans are exposed to metals by ingestion through drinking or eating, by inhalation through breathing or by absorption through the skin when they come in contact with humans during our daily activities in agricultural, pharmaceutical, industrial or residential settings among others[11]. According to World Health Organization (WHO, 1995), research estimates from various countries indicate that the major sources of heavy metals for non-occupationally exposed adults are from food and drink. Also industrial activities and products that expose humans to heavy metal toxins include the manufacturing of pesticides, batteries, alloys, electroplated metal parts, textile dyes, steel among others[12].Heavy metals such as lead (Pb), mercury (Hg), cadmium (Cd) and arsenic (As) are generally regarded as environmental contaminants and their presence in foods or drinks can have some toxic effects on human. High levels of Pb in foods may result to food poisoning in humans either in acute or chronic exposure. Accumulation of lead produces damaging effects in the hematopoetical, hematic, renal, gastrointestinal systems[13,14]. Zinc plays a role as an integral part of a number of metalloenzymes and as a catalyst for regulating the activity of over 300 specific zinc-depended enzymes[15]. The role that copper plays in anemia is related to the mobilization of the tissue iron, the formation of the mitochondrial heme, and the reduction of erythrocyte half-life[16]. Both copper deficiency and excess result in anemia[17]. Copper has no pro-oxidant activity at a considerably higher intake[18]. Diets low in copper are suggested as an explanation for much of the epidemiology and patho-physiology of ischemic heart disease[19]. However, the presence of Cu and Zn in foods has both nutritional and toxic effects in humans.
2. Sampling and Analysis
- Pito samples were bought from four different cities Tamale, Wa, Bolgatanga and Accra between February and March 2011. Six (6) samples each were taken from all the cities except Accra where only 3 were taken. The three cities Bolgatanga, Tamale and Wa were chosen due to the unique method of preparation and popularity of consuming pito. The 3 sampling sites in Accra reflect the preparation method in the 3 cities above. All 21 samples were collected, put separately into acid cleaned high-density 1L polyethylene sampling bottles and analyzed according to strict sampling protocols described by[20]. The samples were transported in ice cooler on ice and stored at -4℃, prior to analysis. Chemical analyses on the samples were conducted using standard procedures recommended by[21]. Analysis of Na+ and K+ ion concentrations were done using a Sherwood model 420 flame photometer. Samples for trace metal analysis were acidified to pH < 2 with 10% analytical grade HNO3. They were then acid digested using an ETHOS 500 model microwave and read using Varian AA240FS model Atomic Absorption Spectrophotometer in an air-acetylene flame at the Nuclear Chemistry and Environmental Research Centre, Ghana Atomic Energy Commission. Analytical grade reagents were used for all analysis and replicate measurements were done to ensure reproducibility and good quality control.Positive Control: Single element e.g. Cd, Cu, Pb, and Fe reference standard samples (Spectrascan, Sweden) standard reference material included in the analysis were treated as a sample as described above. These served as internal positive control sample.
3. Results and Discussions
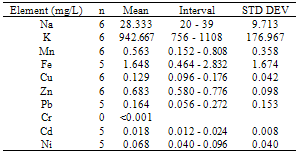
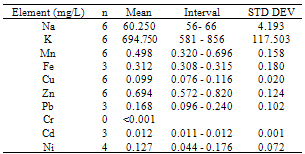
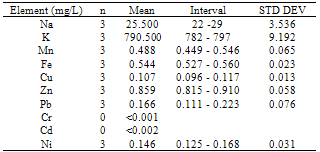
- From figure 1, potassium measured the highest concentration in all the pito samples. The general trend of the trace metals concentration were in the order; K> Na> Zn> Fe> Mn> Pb> Ni> Cu> Cd>> Cr. Relatively, Pb which is a toxic trace metal measured almost the same concentrations in the samples from Tamale,Wa and Accra with Bolgatanga recording a lower concentration. Cr which is also a potentially toxic element in the Cr3+ state had concentrations below detection limits in all the samples. These toxic trace metals may have been introduced during handling and production of the pito. Interestingly, Na, K, Fe, Zn, Mn, Cu and Ni which are all essential elements measured relatively higher concentrations, thus indicating that consumption of pito could be a good source of supplement of these trace metals.The mean concentrations of K are 750.50±90.25, 942.67±176.97, 694.75±117.50 and 790.00±9.19mg/L whilst those of Na are 21.75±12.20, 28.33±9.71, 60.25±4.19 and 25.50±3.54mg/L recorded at Bolgatanga, Tamale, Wa and Accra respectively. The lowest K concentration measured was 581mg/L (Table 3) and the highest being 1108mg/L (Table 2) recorded at Wa and Tamale respectively. The lowest Na concentration was 15mg/L (Table 1) with the highest being 66mg/L (Table 3) also recorded at Bolgatanga and Wa respectively (Table 1 and 3). Potassium and sodium are macro-minerals required for the maintenance of cellular water balance, acid-base balance and nerve transmission and are required in large amounts in the body[22,23]. Deficiencies of these macronutrients lead to muscle cramps, mental confusion, loss of appetite and irregular cardiac rhythm[23]. However, there is a direct relationship between sodium intake and hypertension in humans[24]. Therefore it is desirable that the concentration of sodium in foods is not as high as that of potassium. These results therefore indicate a desirability of the consumption of pito because they contain high concentrations of sodium and potassium but the concentration of sodium is lower than that of potassium.
|
|
|
|
|
4. Conclusions
- The mineral profile of pito samples indicates the presence of both essential and toxic metals. With the exception of Mn, all the essential minerals measured were below the recommended maximum limits. Hence pito is a good source of K, Na, Fe, Cu and Zn. The detected concentrations of Ni, Pb and Cd in the pito samples were above the respective maximum guideline. However, not all the pito samples analysed were these metals found. Therefore the introduction of these toxic metals in pito could be attributed to poor handling during preparation or the utensils used for the production and not from the raw materials (grains) used. Further studies need to be done on the brewing utensils and the possible reactions that can occur between pito and the utensils. But more importantly, consumers should be apprehensive of the environs where the pito is prepared. The results can be used to evaluate the possible health risk associated with the consumption of pito.
ACKNOWLEDGEMENTS
- The authors wish to acknowledge the Nuclear Chemistry and Environmental Research Centre, National Nuclear Research Institute, Ghana Atomic Energy Commission for making available the equipment and materials for the analysis.We express our profound gratitude to Miss Lebene Kpatah, Mr. Nash .O. Bentil and Mr.Michael Tawiah for assisting in the laboratory analysis of the samples.