-
Paper Information
- Previous Paper
- Paper Submission
-
Journal Information
- About This Journal
- Editorial Board
- Current Issue
- Archive
- Author Guidelines
- Contact Us
Food and Public Health
p-ISSN: 2162-9412 e-ISSN: 2162-8440
2011; 1(1): 11-15
doi: 10.5923/j.fph.20110101.03
The Suitability of Water in Khartoum State Industrial Area for Food Processing
 Abstract
 Reference
 Full-Text PDF
 Full-Text HTML
Abdel Moneim E. Sulieman 1, Batran E. El Hilali 1, Mohammed O. Babekir 2
1Department of Food Science and Technology, Faculty of Engineering and Technology, University of Gezira, Wad-Medani, Sudan
2Department of Applied Chemistry and chemical Technology, Faculty of Engineering and Technology, University of Gezira,
Correspondence to: Abdel Moneim E. Sulieman , Department of Food Science and Technology, Faculty of Engineering and Technology, University of Gezira, Wad-Medani, Sudan.
| Email: |  |
Copyright © 2012 Scientific & Academic Publishing. All Rights Reserved.
The present study aimed at investigating the suitability of water for food processing particularly gaseous beverages in Khartoum State. Ten samples of water were collected from six wells (A, B, C, D, E and F) distributed throughout Khartoum North Industrial Area, also three samples (T1,T2,T3) were collected from well (B) after water treatment. The pH of water samples ranged (6.7 – 7.8). All samples gave acceptable results for the Electrical Conductivity (E.C) (284–970µs/cm, total dissolved solids (T.D.S) (143 – 485 mg/L), sulfate (1.5 – 142.4 mg/L), chloride (6.8–94.0mg/L), fluoride (0.0–0.23 mg/L), nitrate (2.01 – 9.24 mg/L), nitrite (0.006–0.467 mg/L), As for ammonia the collected water samples contained a range of (0.0 – 0.01mg/L), while the iron content of the various water samples was ≤0.3 mg/L. Some of the samples gave high levels of turbidity while other samples gave low levels of turbidity. The water samples were free from E. coli and the total coliform, therefore they were acceptable for the consumer and were suitable for drinking and food processing as they have matched with all conditions of the Sudanese Standards and the International Standards for drinking water. The T.D.S of water samples ranged between 143-260 m/l. This indicates that there is no need for using Reverse Osmosis (R.O) to reduce the concentration of the salts and minerals in water. Filtration and coagulation process for the water treatment is sufficient process for this purpose. Most of the microbiological, physical, chemical and geological properties for well's water samples (A, B, C, D, E and F) , were found to match with the local and International Standards for drinking water, that means these water samples are suitable for food processing and drinking.
Keywords: Food Processing, Chemical Examination, Microbiological Examination, Most Probable Number Test
Cite this paper: Abdel Moneim E. Sulieman , Batran E. El Hilali , Mohammed O. Babekir , "The Suitability of Water in Khartoum State Industrial Area for Food Processing", Food and Public Health, Vol. 1 No. 1, 2011, pp. 11-15. doi: 10.5923/j.fph.20110101.03.
Article Outline
1. Introduction
- Water is of vital importance for human life. The body uses water for digestion, absorption, circulation, transporting nutrients, building tissues, carrying away waste and monitoring body temperature. Drinking water, comes from municipal water systems, wells or springs, and is treated to remove bacteria and other pathogens and most pesticides. The resulting water is purified but still contains some dissolved solids. Natural water comes from un protected well or spring system and is bottled without extensive treatment. Because it is almost exclusively groundwater, it usually contains a range of minerals and is, therefore, quite flavorful. Spring water is groundwater thathas risen naturally to the surface. Mineral water is simply water contains minerals, which is true of virtually all water except distilled water. Groundwater is that water which flows out from the subsurface of the earth at different depth. The groundwater found in Sudan at many locations with different formations, according to the characteristic of the area and the geological formation. The slow percolation and horizontal travel at only a few feet a day through the ground is the superb filtration removing all pathogenic forms, including viruses, and removing the causes of color, turbidity, taste and odor (Elhassan,[1].Water for drinking and food preparation must be free from organisms capable of causing diseases, and from minerals and organic substances producing adverse physiological effects (The American Water Works Association[2]. The objectives were:To evaluate some of the microbiological, physical and chemical characteristics of water samples collected from Khartoum North industrial area.To compare the various physical, chemical and microbiological characteristics of water samples with the local and International Standards for drinking water.To evaluate the suitability of these water samples for using in food industry.
2. Materials and Methods
2.1. Study Area
- The study area lies entirely in North part of Khartoum State. The area is located between latitude 15˚.39" and 15º.59"N and longitude 32º.33" and 32º.50" E. Climate of the area is hot in summer and the temperature in this season varies between (17-45oC) in the year. In the study area there are many food factories, they use water for two major purposes, (i) for washing and cleaning the machines and equipment, and (ii) for processing.The food factories in the study area included: dairy factory, confectionary factory, paste factory, mineral water and juice factory, biscuit and Taheneya factory. The water used in some of there factories e.g. soft drink factory is purified by filters sand and carbon, or treated with Reverse Osmosis (R.O) and ultra violet sterilization (U.V), however, in mineral bottled water production, ozone is used instead of U.V However in some factories, the coagulation process (by using the reaction tank) is used instead of R.O system for alkalinity reduction.
2.2. Sampling
- Samples of water were collected during the period (October to December 2008) from six wells namely (A,B,C,D,E and F) distributed throughout Khartoum North Industrial Area, also three samples (T1,T2,T3) were collected from well (B) after water treatment. Collected water samples were immediately transported without ice in sterile bottles to the laboratory of Microbiology, Faculty of Agriculture Khartoum University and Khartoum State Water Corporation Central laboratory (microbiology and chemically) and examined directly. In addition to the previously mentioned samples, bottled water samples were collected from Khartoum local market to be used as control.
2.3. Chemical Examinations
2.3.1. Total Dissolved Solids (TDS), Electrical Conductivity (E.C) and pH
- The total dissolved solids (TDS), electrical conductivity (E.C) and pH were determined by pH meter (Hanna-instrument, model No. H 19811-5). 100 ml of bottled water sample were placed in a beaker, then a glass electrode was inserted in the sample, and the results were recorded directly.
2.3.2. Determination of Minerals and Mineral Salts
- The minerals and mineral salts present in the ash as metallic oxides, were converted to chlorides by HCl and diluted. Flame Atomic Absorption Spectrophotometer (FAAS) with a variant spectrometer (SPECTR AA-10) was used to determine calcium, magnesium and sodium according to APHA[4]. The mineral salts were also determined using standard methods. The mineral salts included: chloride, nitrate, sulphate, nitrite and ammonia. The concentrations of all elements were expressed in ppm.
2.4. Microbiological Examination
- Two techniques are commonly used for enumeration of total coliform, Feacal coliform and Feacal streptococci. The first of these is called the multiple fermentation tube or most probable technique (we used this technique) and the second one is membrane filtration technique.
2.4.1. Colony Count
- Total viable count was carried out using the pour technique as described by Harrigan and Mac Cane {5}. 10 ml of each sample was transferred to 90 ml of sterile diluents, as a first dilution 10-1, serial dilutions were made up to 10-6 and 1 ml of each dilution was transferred aseptically in duplicate into Petri-dishes. 10-15 ml melted plate count agar (45 – 46℃) was poured into the dishes. The dishes were then thoroughly mixed to facilitate distribution of the sample throughout the medium, the medium was allowed to solidify and plates were incubated at 37℃ for 48 hours. Colony counter (Labtech) and hand – tally were used for the determination of the total bacterial counts in terms of colony forming units per ml (C.F.U/ml).
2.4.2. Most Probable Number Test
- Most probable number test was carried out according to Christopher[5], a measured portion of water sample was placed in test tubes containing a culture medium. The tubes were then incubated for a standard time at a standard temperature; the tubes also contained a small inverted glass tube (Durham tube) to facilitate the detection of gas production. This test comprised three steps:-Presumptive test.Confirmed test.Completed test.a) Presumptive test:-The multiple tube fermentation technique was performed as a presumptive test for total coliform using tubes containing MacCane broth and inverted Durham tubes. Inoculation was carried out as follows:-To each of 3 double – strength MacCane broth tubes, 10 ml of the original sample was added.To each of 3 double – strength MacCane broth tubes, 1 ml of the original sample was added.To each of 3 double – strength MacCane broth tubes, 0.1 ml of the original sample was added.All tubes were incubated at 37oC for 48 hours for the observation of gas production. First reading was taken after 24 hours to record positive tubes, and the negative ones were incubated for another 24 hours.b) Confirmed test:-Each gas positive presumptive tube was inoculated into a tube containing 10 ml brilliant green lactose broth medium. All tubes were incubated at 37oC for 48 hours for the observation of gas production.c) Completed test:-At least 3 loopful of each confirmed positive tube were subculture into EC broth medium and then incubated at 44.5℃ for 24 hours. Tubes showing any amount of gas production were considered as positive and the probable number was recorded (the results were compared with the most probable number Table), (Christopher[5].
2.4.3. Yeasts and Moulds
- Using spreading plate count method, potato dextrose agar was used for detection of yeasts/moulds, using the serial dilutions from each sample. 0.1 ml from each dilution was taken; incubation was at 28oCfor 72 hours.
2.4.4. Feacal Streptococci Test
- Azide dextrose broth was used for the enumeration of Feacal streptococcus; tubes were incubated at 35℃ and checked for turbidity after 48 – 72 hours. These dilutions were used (10-1, 10-2, 10-3), from each dilution 3 tubes were prepared, and then results were recorded and compared with the most probable number Table.
3. Results and Discussion
3.1. Chemical Analysis of Water Samples
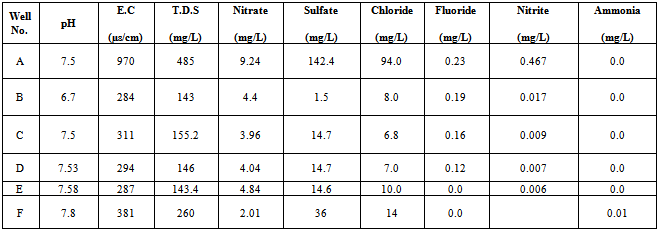
- The chemical analysis of water samples collected from the different wells in industrial area is shown in Table (1). All samples of water had pH in the range (6.7 – 7.8) which is acceptable according to (SSMO – 044 –[6] for drinking water; which indicated that level of pH which is acceptable must be in the range of (6.5 – 8.5), and high levels of more than 8.5 can make a soda taste on the water and according to standards water must be odorless, colorless and tasteless. Well "B" gave a low result of pH (6.7) and that refer to formation of aquifer as in Table (1).As shown in Table (1) the water gave acceptable results for the electrical conductivity (E.C) in the range (284–970µs/cm), which is acceptable according to (SSMO – 044 –[7] for drinking water. In addition, water samples of water had total dissolved solids (T.D.S) in the range (143 – 485 mg/L) which is acceptable according to (SSMO – 044 –[6] for drinking water. Well "A" recorded a high level (485 mg/L) of T.D.S and that refer to formation of aquifer.The collected water samples gave acceptable results for the sulfate which was in the range (1.5 – 142.4 mg/L) that is acceptable according to (SSMO – 044 –[6] for drinking water.The high level of sulfate (142.4 mg/L) recorded in Well "A" refer to the formation of aquifer. High levels of sulfate is not recommended since it can cause damage to pipe work, gives rise to corrosion of steel, iron and aluminum, however, due to the action of sulfate it is worth mentioning to indicate that the permissible level of sulfate is (250mg/L) according to (SSMO – 044 –[6]. The chloride content in the different samples ranged between (6.8–94.0mg/L) which is acceptable according to (SSMO – 044 –[6] for drinking water. It is known that high levels of chloride above 150mg/L is also not recommended as it can cause damage to pipe work, gives rise to corrosion of steel, iron and aluminum.Table (1) also indicates acceptable results for the fluoride in water samples which ranged (0.0–0.23 mg/L), however, this range is considered acceptable according to (SSMO – 044 –[6] for drinking water. It is known that high levels of fluoride above 1.5 mg/L may cause problems for consumers like spots of skin and browning of teeth (SSMO – 044 –[6]. As for nitrate, it was found that in the range of (2.01 – 9.24 mg/L). for drinking water. High levels of nitrate above 50 mg/L can cause serious health problems for pregnant women and infants under the age of 6 months.The nitrite content ranged between (0.006–0.467 mg/L), which is acceptable according to (SSMO – 044 –[7] for drinking water, however high levels of nitrite above 2mg/L also causes serious health problems for pregnant women and infants by combining with some of the hemoglobin in blood to form methemoglobin that can not transport oxygen. The ammonia content in the collected water samples had a range of (0.0 – 0.01mg/L), which is acceptable according to (SSMO – 044 –[6] for drinking water.
|
3.2. Physical and Chemical Analysis of Treated Water Samples
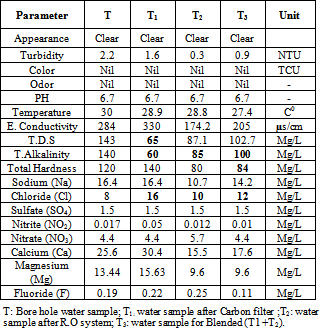
- As shown in Table (2) the appearance gave clear result in all samples and refers to resource (ground water). Sample (T) gave a high level of turbidity (2.2 NTU), this could be attributed to the absence of filtration unit (sand, carbon filter and R.O unit). In contrast, sample (T2) gave a low level (0.3 NTU) because of presence of sand and carbon and membrane. It is recognized that high level of turbidity more than 5NTU can affect the appearance of the water and can protect micro-organism from the effect of the disinfection and stimulates the growth of bacteria, and gives rise to a significant chlorine demand. Sample (T1) recorded high level of T.D.S (165 mg/L) and this refer to storing. However, sample (T3) recorded a value (102.7 mg/L) it was in the range of (SSMO – 044 –[6].
|
3.3. Microbiological Analysis of Wellś Water
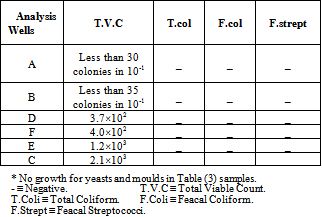
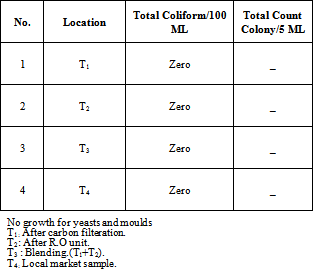
- As indicated in Table (3), Khartoum North Industrial Area wells samples were free from E. coli and the total coliform, therefore they were acceptable for the consumer and were suitable for drinking, because they matched with all conditions of the Sudanese Standards and the International Standards for drinking water (WHO,[7].
|
|
4. Conclusions
- Based on the results, the T.D.S of water samples taken from various wells (A, B, C, D, E and F) in Khartoum North industrial area ranged between 143-260 m/l. This indicates that there is no need for using Reverse Osmosis (R.O) to reduce the concentration of the salts and minerals in water. Filtration and coagulation process for the water treatment is sufficient process for this purpose.The proper wells design reduces the microorganism contamination and water treatment costs. Most of the microbiological, physical, chemical and geological properties for well's water samples (A, B, C, D, E and F) , were found to match with the local and International Standards for drinking water, that means these water samples are suitable for food processing and drinking.Based on the results of various analyses, the followings can be recommended:To encourage using (U.V) system for treatment of water because this system is efficient and safe. Proper wells design is recommended since it reduces the microorganism contamination and water treatment costs.Further studies are needed to verify using treatment methods other than (R.O) system as it is very expensive.
ACKNOWLEDGEMENTS
- This work forms part of a research carried out at the Food Science and Technology, Gezira University, Sudan. The authors express their sincere thanks to all staff members, techniques and the colleagues for their assistance.