E. C. Merem 1, Y. A. Twumasi 2, S. Fageir 3, D. Olagbegi 1, J. Wesley 1, R. Coney 1, Y. Babalola 1, T. Thomas 1, A. Hines 4, G. Hirse 4, G. S. Ochai 5, E. Nwagboso 6, M. Crisler 1, S. Leggett 7, J. Offiah 1, S. Emeakpor 8
1Department of Urban and Regional Planning, Jackson State University, 101 Capitol Center, Jackson, MS, USA
2Department of Urban Forestry and Natural Resources, Southern University, Baton Rouge, LA, USA
3Department of Social Sciences, Alcorn State University, 1000 ASU Drive, Lorman MS, USA
4Department of Public Policy and Administration, Jackson State University, 101 Capitol Center, Jackson, MS, USA
5African Development Bank, AfDB, 101 BP 1387 Avenue Joseph Anoma, Abidjan, AB 1, Ivory Coast
6Department of Political Science, Jackson State University, 1400 John R. Lynch Street, Jackson, MS, USA
7Department of Behavioral and Environmental Health, Jackson State University, 350 Woodrow Wilson, Jackson, MS, USA
8Department of Environmental Science, Jackson State University, 1400 John R. Lynch Street, Jackson, MS, USA
Correspondence to: E. C. Merem , Department of Urban and Regional Planning, Jackson State University, 101 Capitol Center, Jackson, MS, USA.
| Email: |  |
Copyright © 2024 The Author(s). Published by Scientific & Academic Publishing.
This work is licensed under the Creative Commons Attribution International License (CC BY).
http://creativecommons.org/licenses/by/4.0/

Abstract
Yam as a staple commodity in Nigeria, remains generally grown in different places within the ecological zones and food hubs in the nation. Notwithstanding all that, being integral part of the nation’s food security in a setting where Nigeria ranks high as the largest producer globally. Still, yam continues to find ample use with essential role for numerous purposes. Classified as an important food crop, the use of yam runs deeper, given its high demands for religious, socio-cultural practices, the economy, industries, and the marketplace. Even at that and considering the vast presence of yams over large swaths of land across the West African region from Ivory Coast to Nigeria. The ecological surroundings in Nigeria’s Lower South zone, contains the critical bio-geoclimatic indicators and microclimate fueling recurrent surge in output. Accordingly, yam crops as revenue generator, employer of work force, and calorie source indispensable to the country and regional menu, occupies essential spot in the popular imagination. This is so, because the tenure and farming of yam carry cultural and social connotations in the lower South region. Even though people see yam as mostly a key source of carbohydrates, existing varieties contain protein as well. The international dominance of Nigeria compared to competitors in the marketplace is quite clear in terms of output and cultivated land areas. As such, within the industry, existing data pertaining to activities therein over the past years affirm record growth and shifts in various land use indices. Accordingly, the study area has seen prevalent applications of agrochemicals, price increments, widespread risks to the surrounding ecosystem, and degradation as well as price uncertainty in transactions. This irony is made worse by the current leakages in policy regarding production capacity in the zone amidst mounting issues, initiatives towards mitigation and productivity. There are also knowledge voids on the actual dispersal forms vital for effective management in the agricultural sector amongst factors situated in the larger regional farm structure. Consequently, this study will fill that void in research by analyzing the state of yam land use in Nigeria’s Lower South zone with focus on the issues, trends, impacts, factors, efforts, and future lines of action. From the analysis, the results point to changes in the form of gains and declines in various yam land use indicators and dangers to the adjourning ecosystem. Also, GIS mappings detected dispersal of trends in space where production and land use changes and fertilizer stayed steady. With variations linked to many socio-economic, and physical forces, the study offered remedies stretching from education to the design of regional yam land resource information system.
Keywords:
Yam, GIS, Lower South Region, Production, Land Areas, Impacts, Factors, Changes
Cite this paper: E. C. Merem , Y. A. Twumasi , S. Fageir , D. Olagbegi , J. Wesley , R. Coney , Y. Babalola , T. Thomas , A. Hines , G. Hirse , G. S. Ochai , E. Nwagboso , M. Crisler , S. Leggett , J. Offiah , S. Emeakpor , Exploring Shifts in Yam Production Trends Along Nigeria’s Southern Region, International Journal of Food Science and Nutrition Engineering, Vol. 14 No. 1, 2024, pp. 1-22. doi: 10.5923/j.food.20241401.01.
1. Introduction
Yam as a staple produce in Nigeria, remains generally found and grown in different places within the ecological zones and food hubs in the nation. Notwithstanding all that, being a purveyor and integral part of the nation’s food security [1] in a setting where Nigeria ranks high as the largest producer across the globe. Still, yam finds ample use with essential role for numerous purposes. Classified as an important food crop [2], the use of yam runs deeper, given its high demands for religious, socio-cultural practices, the economy, industries, and the marketplace [3]. Even at that and considering the vast presence of yams over large swaths of land across the West African region from Ivory Coast, Ghana to Nigeria. Being a staple food in Nigeria, yam not only thrives and farmed across many agro-ecological zones [4,5]. However, it features prominently as a vital product for domestic use, industries, exports, and food security [6]. Aside from that, and the large swaths of yam fields in place, as a root tuber crop traded in the rain belt of the tropics including the Niger Delta during the 1500s. The ecosystem surroundings in Nigeria’s Lower South zone over time has the essential bio-geoclimatic parameters like temperature, soil, and the microclimate climate highly indispensable in sustaining the surpluses recorded in production over time [6-8]. Yet, yam as a thriving commodity faces policy negligence from the national and regional development agenda of most agencies obsessed with the promotion of other farm produces like rice in the last several years [9-15].Notwithstanding all these, yam crops as important farm produce, revenue generator, employer of work force, and calorie source indispensable to the country and its regional menus, occupies essential spot in the popular imagination and economy, seeing its derivatives from flour, to fufu. Indeed, from the citizens awareness of these derivatives, yam as a staple worth 267 calories of the nation’s energy intake, serving 66 million people [3-4], stands at the center of community life in the South and Southeast zones. This is where the crop bestows class and status in local cultures as attested to in the popular expression of “yam is life and life is yam” [16-17]. This is so because the tenure and farming of yam carry numerous cultural and social connotations in many parts of the lower South region. Elsewhere, in the neighboring Southwest region of Nigeria, the consumption of white yams as staple diet therein has come to be associated with the rising incidence of multiple fraternal twinning in a setting where people in households consume yams 3-4 times daily. As such, this further adds to the role of yam constant intake in genetic disposition to multiple births [18]. Even though people see yam as mostly a key resource of carbohydrates, some existing varieties contain protein as well. The international dominance of Nigeria compared to competitors in the marketplace is quite clear in terms of output and cultivated land areas. In fact, within the industry, existing data pertaining to activities therein over the past years, affirm record growth and shifts in various land use indices. Accordingly, the study area has seen prevalent applications of agrochemicals, price increments, widespread risks to the surrounding ecosystem, and degradation. Worthy of concern in all these are the environmental hazards often triggered by yam consumption in the Eastern heartland. Just as this coincides with the unwanted exposures of citizens residing and farming on contaminated soils adjacent to wastes residues from active oil and gas wells in the Oguta side of Imo state in Nigeria’s Lower South to radionuclides traced to ingested yam in the lower south. One cannot discount the damage caused by oil spills in the agricultural ecosystems and the impacts [19]. There have also been cases of the export of poor-quality yams in 2017 from Nigeria to the USA, that caught the attention of the officials who confirmed it and later ordered full investigation [20]. Granted some routine quality control red flags that are isolated outliers. There is also the issue of price uncertainty in transactions coupled with an irony made worse by the current leakages in policy regarding production capacity in the zone. All in all, the study area experienced widespread use of chemicals, rising prices, threats to the ecosystem, crop diseases, and volatility in commodity trade [21,9]. This enigma is compounded by the inefficiency in Nigeria’s yam industry amidst weak exports [22,23] and spillover into the Lower South zone [10].The fact that in 1985 Nigeria produced 18.5 MMT of yam worth over $5 billion from 1.5 million ha estimated at 73.8% of Africa’s output and 76% globally. By 2008, yam output in Nigeria surged twice to 35.7 MMT with the nation responsible for 70-76%. Further along these lines, in 2021, during which West Africa posted 94% in output, Nigeria in that period, again held on to the prime spot with 47MMT worldwide on 2.9 million hectares [24,11]. Being a commodity traded locally and globally with usage transcending states reliant on about 600 species. The perennial dominance of Nigeria among yam sources worldwide, matches capability and land areas considered arable and larger. In that way, as the nation witnessed recurrent growth and changes across the years, in many core land use indices [25]. However, many argue despite the weight yam carries in the cultural and economic ethos of the zone and the standing in the orbit of global capital transactions. Nigeria’s propensity to underachieve and the inability to exploit the inherent advantages seems to undercut the sector in direct competition with foreign producers. These issues merit analysis for sound planning. Yet, despite the storied relevance in the political economy of the Southern region [25]. Very little exists in the literature on the state of yam production trends and land use in the zone across time, together with lack of knowledge on the dispersion patterns essential for efficient decision-making in the farm sector, considering the elements located within the regional agricultural structure. Accordingly, this study will fill that void by analyzing the state of yam land use trends in Nigeria’s Lower South zone using a mix scale method of Geographic Information System (GIS) and descriptive statistics with focus on some nearby states Nigeria [26-29]. Given that the emphasis is on the issues, trends, impacts, factors, resource analysis and efforts of institutions to sustain the industry. The paper has five objectives and sections. The initial two objectives cover the analysis of current issues in yam farmland use and to assess the production trends. The third and fourth objectives are to measure the potential of yam farms, the factors, impacts, and efforts. While the fifth objective is to craft a decision support tool. The paper’s five sections cover introduction, methods, results, discussions, and conclusions.
2. Methods and Materials
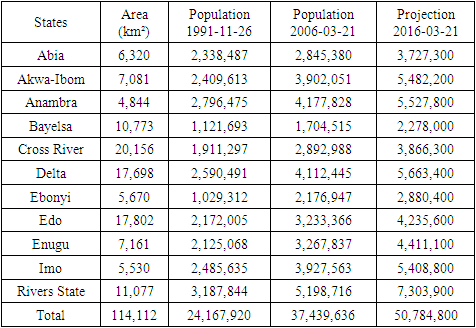
The zone (Fig. 1) extends through a 114,112 Km2 area across 11 states in Southern Nigeria mostly in the Niger Delta region off the Atlantic coast. It has a population of 50 million that are mostly in the two geopolitical zones in the Southeast and South-south axis (Table 1). Being a region endowed with enormous biodiversity in an area where the Niger River splits into numerous tributaries containing many low-lying coastal communities [30,31,32]. The study area labelled often as a yam belt, have locales that share deep socio- cultural, economic, and religious affinity tied to the produce from their iconic pasts in the annals of economic and social historiography of the place [33,34,35]. These revered areas in the zone spanning all the way from Abia to Edo states within the respective geopolitical zones, consists of couple of states made up of Akwa Ibom, Bayelsa, Cross River, Delta, Ebonyi, Edo, Imo, and Rivers and Anambra. Principally, within the South-South area, Cross River, Akwa Ibom, Rivers and Delta surpasses the others in yearly yam production. While Enugu and Imo stand apart as major producers in the Southeast [7], they continue to be at the receiving end of major ecological impacts like the others.Table 1. The Study Area and The Population
 |
| |
|
 | Figure 1. The Study Area Lower South Nigeria |
Considering that the ecology of the zone has diverse types of land based and marine plants and animals and human life, it contains one of the most valuable marshlands in the globe [21]. With much of the region divided into four ecological zones made up of coastal inland zone, mangrove swamp zone, freshwater zone, and lowland rain forest zone. There exists an extensive area of mangrove forests, farms, and estuaries on a 3,122 km2 coastline and inland areas where the soils are suitable in the tilling of yam crops [21]. Absolutely, yams are perennial herbaceous vines planted for the intake of their edible starchy tubers. They are used as a staple farm commodity in various temperate and tropical regions, across the world particularly in West Africa, South America and the Caribbean, Asia, and Oceania [36-39]. While it can be grown on fallow landscape with variations in harvesting periods of 6 to 36 months. Nigeria as the globe’s biggest producer of yam, boosts of favourable topography and soils in the lower South where the crop flourishes [24]. Being a staple in the West African region with cultural importance, [40] the zone accounts for more than 95% of the world's, yam crop yearly harvests and even so, remains highly indispensable for continued existence in these regions (Table 1.1). Handful of the yam species therein in the tubers, can be kept in storage for over a duration of 6 months with no freezing.Table 1.1. Top 10 Yam Producing Nations in 2014
 |
| |
|
The crop as major staple and native to west Africa where cultivation started 11,000 years ago in the continent of Africa [4] is essential in the study area. The region’s storied past, the early contacts, and transactions in the 1500s with Europeans along Eastern Niger delta and yam farming hubs, confirm the use of yam in the zone. Known for its abundance in fiber, carbohydrates, potassium, calcium, vitamins B and C, and other essential minerals [41], and as a staple food in Southern Nigeria [42]. However, nutrient composition differs according to variety and age of the harvested crop, and soil conditions, climate, and other environmental factors during cultivation. With the nutritive calorie equivalence in the daily usage of yam in the nation estimated at 200kcal. This crop is ingested in various forms as fufu, pounded yam, chips, and flour. Additionally, Nigeria is the world highest producer of yam, cultivating about 2.9 million hectares of land and as at in 1985, Nigeria produced 18.3 million tonnes of yam from 1.5 million hectares, representing 73.8 percent of total yam production in Africa [43-45].Despite Nigeria’s prime position as the leading grower, the country’s production and processing capability are still insufficient. Whilst processing offers possibilities to harvest high value, internationally tradeable yam -by-products like flour, food, fufu, snacks, bars, tapioca, and animal feed. Seeing how the country expends huge labor and capital annually. Nigeria is not able to harness the projected $600-$700 billion market growth rate of 3.3% in 2033 [46]. Gazing at the total number of nations listed and most of which are producers. European nations like Germany, Spain, Italy, NAFTA, and Asian Pacific giants are turning the corner in their markets by profiting from high demands in food and beverages derivatives even if primary sources like Nigeria are involved in exports. The fact that the industrial structure differs notably due to differences in market philosophy, Nigeria should draw from the success of EU and NAFTA countries in a manner that can better the industry locally. Even though the production of yam in Nigeria seems considerably little and unable to sustain the rising needs, there is still room for improvement [15]. Said that, the successes of the processing nations stem from constructive initiatives by their governments, innovation in farm biotech together with growing consumer craving for yam. Considering that the cultivation of many species of yams flourish in farm fields extending across the rainforest ecosystem in the zone. The planting as well can be impacted using fertilizers and agrochemicals and other risks such as pollution, pests, and diseases [47], declining soil fertility, irregular climatic conditions, and erosion affecting the adjoining environmental systems [21]. Indeed, yam which thrives perennially, is regularly sought after to plant given the higher status it bestows the individual owners and those in possession of the produce. Seeing yam’s remarkable capacity to still grow in the appropriate setting and a capacity to tolerate changing climatic variabilities such aridity and lesser soil nutrient deficiency. All in all, the study area stands out as well as a zone known for heavy rainfall and changing temperature necessary in the planning of the crops. Within the yam producing areas, ecological footprints of pollution emanating from the pesticides used in yam farms, wastes and effluents are not only obvious, [24]. But heavy floods in the low-lying areas, continues to besiege yam fields therein. Despite these limitations, yam remains a generator of income, employment, and source of food security for those in the countryside. The fact that yam crops grow in various conditions in biodiversity abundant moist tropical environments in the Lower South at on development rate of 1:5 compared to 1:10 for cassava, these trends under a mix scale method must be assessed [47-57].
2.1. Methods Used
The research applies a mix scale approach comprising of descriptive statistics and secondary data connected to GIS to gauge the state of yam production, uses and the issues involved along Nigeria’s Lower south region in West Africa. The spatial information for the enquiry emanated from several agencies encompassing of the National Population Commission of Nigeria, the Federal Ministry of Agriculture and rural Affairs of Nigeria, the United Nations Economic Commission For Africa (UNECA), the United States Department of Agriculture foreign agricultural services and The United States Department of Agriculture (USDA) Office of global analysis. Additional sources of spatial data came from the Nigerian Meteorological Agency, the office of surveyor general and the Ministry of Niger Delta Affairs, the Federal government of Nigeria. Additionally, the Rockefeller Foundation, the Government of Former Eastern Region, Government of defunct Midwestern region, the archives of the Federation of Nigeria in the First Republic and the European Union, the Economic Community of West African States (ECOWAS), the World Bank and the UN Food and Agricultural Organization (FAO) also provided other info essential to the enquiry. Principally, much of the yam crop or indicators like the area cultivated with yam, the volume of yam production, the farm gate prices, yam derivatives, consumption frequency, consumption pattern, per capita consumption, and the distribution of fertilizers, farm gate prices, agrochemicals, the prices of seedlings essential to the region and different zones in the country were obtained from both National and state Government archives of the defunct Eastern and Mid-Western regions of Nigeria, the National Bureau of Statistics, the Lower South Departments of Agriculture, Mundi Index and Keoma. In the same vein, the National Root Crops Research Institute, Umudike, International Institute of Tropical Agriculture (IITA) Ibadan, and the National Seed Service, All Farmers Association of Nigeria (AFAN), and the Bill and Melinda Gates Foundation, served essential needs in the process as well. On the one hand, the World Bank, the agricultural and data base of the United Nation FAOSTAT, The US Agency for international Development (USAID), International Fund for Agricultural Development data (IFAD), UK Department for International Development’s Market Development program and the Bureau of National Statistics provided the extra secondary data on the numbers, quantities, trends, gains and declines in yam indicators. On the other hand, National Cassava Producers Association, Kenoma, Nigerian Data Portal, Ministry of Health and Nutrition offered the assistance on historical data and other valuable information on yam derivatives. Concerning the remaining data needs, the Central Bank of Nigeria, (CBN), the Statiststa, and the Nigerian Agricultural web portal, and the Nigerian Information Technology Development agency and the agricultural Insurance Cooperation were involved in the procurement of information on the areas cultivated, the volume produced and the highlights of changes. Given that the boundaries stayed same and unchanged, the regional and state, county and federal geographic identifier codes of the country were used to geo-code the info contained in the data sets. This information was processed and analyzed with basic descriptive statistics, and GIS with attention to the temporal-spatial trends at the state and regional levels in the lower Niger Basin region of Nigeria. The relevant procedures consist of two stages listed below.
2.2. Stage 1: Identification of Variables, Data Gathering and study Design
The initial stage in this enquiry began with the identification of variables needed to measure the level of yam production and trends at the regional and state levels from 2000 to 2011. The variables encompass of socio-economic and environmental, and data made up of population, annual rainfall, population change, quantity, cost, average price of fertilizer by state/region, farm gate price by crop and states for yam, and costs of seed/seedlings of yam state-wide. The others consist of yam root tuber prices, as well as yam, derivatives, tubers, flour, fufu, starch, and yam types across the Lower South region of Nigeria. Added to that, are the volume of quantity and price of agrochemicals, like herbicides, and insecticides, percentage of quantity and price of agrochemicals, like herbicides, and insecticides, percentage of change, quantity, cost, average price of fertilizer by state, farm gate price by crop and state for yam, percentage of change in yam areas planted and production. Noteworthy among the indicators covers yam output by zone, daily consumption of yam per capita, consumption patterns, grams per person per day and yam producing nations. The variables as mentioned earlier were derived from secondary sources made up of government documents, newsletters, and other documents from NGOs. This process was followed by the design of data matrices for socio-economic and land use (environmental) variables covering the census periods from 2000-2019. The design of spatial data for the GIS analysis required the delineation of county and boundary lines within the study area as well. Given that the official boundary lines between the 11 states remained the same, a common geographic identifier code was assigned to each of the area units for analytical coherency.
2.3. Stage 2: Step 2: Data Analysis and GIS Mapping
In the second stage, descriptive statistics and spatial analysis were employed to transform the original socio-economic and ecological data into relative measures (percentages, ratios and rates, averages). This process created the parameters for indicating, the amount of yam production, cultivated area, land use change, farmland deficits from activities vital to yam derivatives, yam production by zone, the frequency of consumption, daily consumption of yam per capita, and grams per person per day. Of great importance in all these are the farm gate prices and rain fall volumes in the Lower South region and changes in land use indicators prompted by growing consumption and population surge and growth rates across the study area among the individual states. This is based on measurement and comparisons over time. While the spatial unit of analysis consists of the various states, regions, shorelines, cities, the boundary, and locations where the farming, consumption and export of yam crop thrived. This approach enables the recognition of change and the level of usage. While the graphics highlight the actual frequency and impacts, yam cultivation land declines and the pace of production and the trends as well as the environmental and fiscal expenses. The remaining steps involve spatial analysis and output (maps-tables-text) covering the study period, using Arc GIS 11.0 and SPSS 29.0. With the spatial units of analysis covered in the 11 states (Figure 1), the study area map indicates boundary limits of the units and their geographic locations. The outputs for each state in the region were not only mapped and compared across time, but the geographic data for the units which covered boundaries, also includes ecological data of land cover files and paper and digital maps from 1991, 2000-2019. In as much as this process helped show the spatial evolution of spots clustered over the zone, various levels of usage, and the trends. The approach pinpoints the ensuing socio-economic and environmental impacts, as well as changes in other variables and factors driving the production volume, yam land use and the impacts in the study area.
3. The Results
This part of the research centers on temporal and spatial analysis of the yam landuse activities in the study area. Using descriptive statistics offers an initial spotlight on the analysis of land usage and yam production in the zone at the regional and state levels, mainly from the large to small producers. The other portions of the section present the percentage composition and distribution of both land use and yam output over the different periods together with the environmental impact assessment of the accumulated risks from operations in Nigeria’s Lower South region. This is followed by the remaining parts of the section comprising of Geographic Information Systems (GIS) mappings, and the description of the factors behind variations in the Lower South’s yam cultivation activities. The factors come under the rubrics of policy infrastructure, socio-economic, demographic forces, and physical environment.
3.1. Regional Yam Land Use and Production 2006-2010
The temporal profile of yam area and output puts the region’s opening value in 2006-2008 at 599.78-806.65 thousand hectares(ha) followed by 9303.44-9258.48TMT. By 2008-2010, the Lower South’s yam land use profile varied by 900.31 ha to 952.29 ha alongside production volume of 10,245.72 TMT to 10,118.07 TMT. In the spate of 4years, the zone’s total size of land devoted to yam at 32,579.03 ha averaged 814.75ha. From the intensity of yam production built on demands under different periods, the zone in 2006-2008 posted 1,406.43 ha in size with average tallies of 703.26 ha deemed in deep contrast with surge in the regional land cultivation index of 1,852 ha and an average of 926,3 hectares during 2008-2010. Surely, the overall yam production level reached 38,925.71 TMT in the region at an average of 9,731.42 TMT. In the process, the production capacity for yam varied by 18,561.19 TMT-20,363.79, at identical mean of 9,280.96 -10,181.895TMT. In the context of yam land cultivation, the preliminary inference to be drawn over time, is that the latter periods of 2008-2009 and 2009-2010 emerged as the times of intense yam land use compared to the earlier periods devoted to the size of cultivated area in the lower south (Table 2). Table 2. Yam Areas Planted in thousand Hectares and Production in TMT (Tons)
 |
| |
|
3.1.1. Yam Cultivated Areas State Levels
Considering their profile as the two leading land users in yam production, Cross River state and Enugu state accounts for 42.76% in cultivated land average for the study area in four different years. The breakdown of the temporal distribution of yam land base as percentage of the total cultivated area over the four-year span in both states stood at 44.65%, 41.25% to 43,48- to 41.69%. Within the state level and of the big 5 consisting of the adjoining Eastern states of Cross River, Enugu, Rivers State, Delta and Ebonyi in 2006-2007-2007-2008. Yam cultivation not only increased, but it contained substantial strips of areas of around 107.67, 138.91 thousand hectares to 215.41 to 219.78, Thousand hectares specifically for Cross Rivers State. Further deep into the years, in 2008/2009 -2009-2010 in as much as Enugu and Rivers casava land area saw increases of 160.16, - 193.84 thousand hectares to -176.33 to 177.31 thousand hectares together with 68.78, 88.81 thousand hectares -94.37- to 94.84 thousand hectares. The primacy of Cross Rivers state as leader in the top two was highly evident and never much in doubt at all, that the land assets therein in the last two periods topped the 200 thousand mark far ahead of the rest of the states and the closest state in ranking; Enugu. This tendency stretched further into the other periods most notably 2006/2007-2007/2008 in a trio of states (Delta, Anambra, and Ebonyi) where the cultivated land areas for land still fell behind the previous states. Of these mid-level group yam producers in the study area, one of them, Delta held on to notable land area measured at 41.35 thousand hectares - 76.31 thousand hectares. By 2006-2008, the land base jumps from 90.15 thousand hectares - 111.51 thousand hectares. The two neighboring former East Central states of Anambra and Ebonyi as no spectators, followed at similar pace with the former (Anambra) in the different years allotting 42.08 thousand hectares-60.83 thousand hectares in 2006-2008 and about 83.15 thousand hectares to 86.53 thousand hectares while the later allotted about 48.1-80.66 thousand hectares to 56.56-62.43 thousand hectares all through in 2006-20082008-2010. Even though the lower tier states of group 3 states headlined by Abia, Akwa-Ibom, Bayelsa, Edo and Imo saw uptick in cultivated land areas, the combined tallies in cultivated land areas for yam production surged by 56.62 thousand hectares to 68.59 hectares and 80.17 thousand hectares to 88.67 thousand hectares in the defunct Eastern states of Abia and Akwa Ibom between 2006/2007-2007/2008-2008/2009-2010. In the case of Bayelsa, Edo and Imo, the combined cultivated land areas consist of 79.02 thousand hectares to 98.7 thousand hectares and 104.17 hectares – 111.22 hectares (Table 2).
3.1.2. Yam Production Levels
The magnitude of yam cassava production capacity of the states based on the information reflects a reaffirmation of the impressive performance of the 2 leading states of Enugu and Cross Rivers, while the former stands out as the number one outrightly between 2006-2010. In as much as in the four different periods both states combined for a total of 16,747.54 TMT at an average of 4.186.89 TMT in the production of yam in the region. At the individual states, the duo of Enugu and Cross Rivers again accounted for 9,734.16 TMT to 7,13.38 and mean levels of 2,433. 5 TMT -1.753.31 TMT respectively. From that, it is unsurprising that the two former Eastern states responsible for 42.77% of yam output in the study area during the periods 2006-2010 saw their collective production levels shift by 43% to 40.15%, and 42.08% to 45.80% completely ahead of 9 of the 11 states listed on the table. In addition to that, the data underscores the intense production activities in the 3 most important producers made up of mainly Enugu, Cross River, and Delta states during which the trio exceeded every other state all through 2006-2010. Looking at the individual allocation from the real output, Enugu occupies the top position in the ranking, fully surpassing the others with 2,486.69, 2,212.64, 2,338.67 and 2,696.16 TMT in output amidst some fluctuations. The production activities in Cross Rivers, Delta and Anambra show yam yields of 1,596.55, 1,504.99, 1,973.17 and 1,938.67 TMT to 656.88- 935.49 TMT and 1,450.09 to 925.31 TMT together with 656.88, 935.49 TMT- 1,450.09 and 925.31 in the first two states. Added to that comes the production profile for Anambra estimated at 769.26, 804.80 to 938.54- 825.91 TMT. Even if notable by the capacity, the patterns mirror instances of slight drops. Somewhere else in group 2 list of producers (Ebonyi, Rivers, Abia, and Imo), the thrust in yam output kept steady in Ebonyi (at747.45, 850.75, 771.04, 844.18 TMT). With no exception, similar trend emerges in Rivers state at 895.68-820.92 TMT to 765.6 -617.53 TMT. The same form points to the turnaround in yam production in Abia at 653.19, 610.51, 562.83- 624.22 TMT. This epitomizes the capacities of the place as a level 2 source of the crop in a culturally active state tied to yam production within the lower south all through 2006-2010. Despite the initial surge in output for Imo state at 689.78, -781.90 TMT by 2006-2008, in the ensuing periods of 2008-2010 yam production fluctuated from 819.87-564.05 TMT in another Eastern state known for deep ties to cultural practices and social calendars associated with yam transactions. Seeing the group 3 or third tier states (Edo, Bayelsa and Akwa Ibom). The constancy of these states, particularly Edo and Bayelsa in yam production volumes remain noteworthy. This stems from farm activities in the former and later that yielded 387.03-364.03 TMT to 283.73-295.08 TMT and 257.98, 217.71 TMT to 192.25,189.43 TMT between 2006-2010. Furthermore, on the lower tier state of Akwa-Ibom where production forms opened at familiar levels relative to its capacity. Therein, yam output in the former Southeastern state fell from 162.95 TMT- 154.74 TMT in 2006-2008, but only to rebound quickly to 149.93 TMT -597.53 TMT in 2008-2010 (Table 2).
3.1.3. The Percentages of Change and Composition
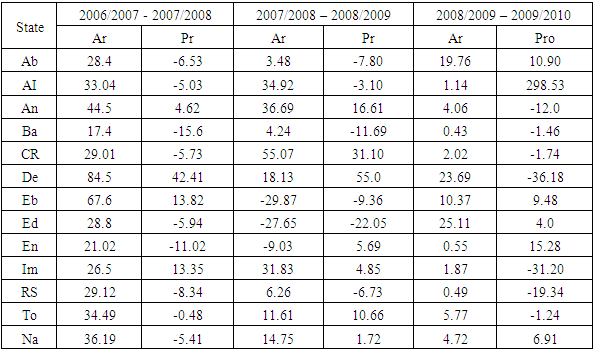
The changes in the land use indicators of areas under yam cultivation and production in the region throughout various times comprises of a combination of gains and declines with 2006/2008-2008-2010 as the period of most complete increases particularly in the yam cultivated area column compared to the occurrences of multiple loss in 2006/2008-2007/2009, 2008-2010 in production volumes of the crop. At the regional level, the areas planted with yam produce not only amounted to instant and back-to-back gains during the entire three periods of 2006-2008, 2007-2009-2008-2010. But in contrast, the study area only gains in 2007-2009 evaporated amidst the emergence of further losses in production capacity by 2006-2008, to 2008-2010. In the period 2006-2008, the areas under yam production were up in all 11 states as 10 others posted very high and double-digit increments whereas, one other state Bayelsa at 17.4% finished below its neighbours (Table 2.1). Furthermore, high double-digit gains of 84.5%, 67.6% to 44.5%-33.04% held firm in the initial four states (Delta, Ebonyi, Anambra, Akwa-Ibom) as 6 others (Rivers State, Cross River, Edo, Abia, Imo, and Enugu) saw double digit gains (29.12, 29.01, 28.8, 28.4, 26.5,21.02%). The changing trends related to production involved a split among the states with declines in 7 and gains in 4 others, as result visible drops (of 15.6%, -11.02%, to -8.34%, -6.53) manifested fully in Bayelsa, Enugu, Rivers State and Abia. This was followed by lower single digit declines of over 5% (-5.03, -5.73) in the adjoining states of Akwa-Ibom and Cross River. On the other hand, the big double-digit rallies in Delta and Ebonyi and Imo states at 42.41%-13.82%, to 13.35% outpaced the soft gains of 4.62% in Anambra state in the period 2006-2008.Table 2.1. Percentage of Change of Yam Areas Planted in thousand Hectares and Production in Thousand Metric Tons by State
 |
| |
|
In 2007-2009, the land planted with yam crop plummeted in 3 of 11 states with largest declines of -29.87%, -27.65% in Ebonyi and Edo together with scanty drops of -9.03% at Enugu state. The sole increases in cultivated yam land began with the huge avalanche of gains of 55.07% at Cross River. Within the same period, the momentum in gains showed signs of further splashes with a spread in a trio of states (Anambra, Akwa-Ibom, and Imo). In these places, the rate of size of land devoted to yam cultivation again reached the high double-digit levels of over 31% (36.69, 34.92, to 31.83%. Among these places, just only 3 other states made up of Rivers State, Bayelsa and Abia, showed single digit gains of 6.26%, 4.24% to 3.48%. Although, the incidence of gains seemed very noticeable in 5 of the 11 states, but the huge double digit declines of over -22.05 to -11.69% in yam production in Edo, Bayelsa and the single level drops in yam production in of -9.36%, -7.80%,-6.73-3.1% at Ebonyi, Abia, Rivers State, and Akwa-Ibom were prominent enough to dampen gains of 55.0%- 31.10%-, 16.6% at Delta, Cross River and Anambra (Table 2.1).With the turnarounds and surge in yam land use fully visible and somewhat consistent, the slight difference in the distribution of high and low levels in increases among the states in the study area between 2008-2010 did not affect the robustness of yam cultivation in the zone. From the trend over time, the initial concentration of slow increases of (4.06%, 2.02% -1.14% to 0.43 %) in the first four states (Anambra, Cross River, Akwa-Ibom and Bayelsa) in land under yam cultivation out of the 7 of 11 states throughout 2008/2009 -2009/2010, seems reflective of the yam land use activities among the trio of other states (Imo, Enugu, and Rivers State). In these places, the rates of increase not only faded temporarily to less than 2.00% (at 1.87%- 0.55%, to 0.49% in the same periods, but they rebounded strongly by double digit levels of 25.1% - 23.69% to 19.76%-10.37% in a quartet of neighbouring states (Edo, Delta, Abia and Ebonyi). Despite the -12.7% declines in planted fields in Rivers state, both yam output and cultivated land surged notably in every state in the study area. Of great importance in yam production, is the gravity of losses suffered in 7 of the 11 states in the region in which Bayelsa and Cross River saw only the softer sides of the declines at -1.74% to -1.46% lower than their neighbours did. Granted such a scenario, Delta and Imo accounted for the highest pace of yam production declines of over -30% (-36.18% to -31.20%) alongside another duo of states Rivers State and Anambra at -19.34% to 12.0%. This occurred in a manner deemed clearly above but reflective of the region’s loss level of -1.24%. On the gain columns, just as the initial duo of the states (Abia and Akwa-Ibom) in that category held on to strong gains or increases of 298.53% to 10.90%, the remaining trio (Enugu, Edo and Ebonyi) maintained their respective places in the rankings with gains of 15.28% -9.48% to 4.0% all through 2008-2010 (Table 2.1). For the acronyms see the Appendix.
3.2. Impact Assessment
From the increases in yam land use production activities amongst the states in the study area. There are growing dangers concerning the effects of different scales over the usage and purchase of chemicals among farmers in Nigeria’s Lower South yam supply areas with ecological and socio-economic consequence.
3.2.1. Ecological Risks from Surge in Fertilizer Use
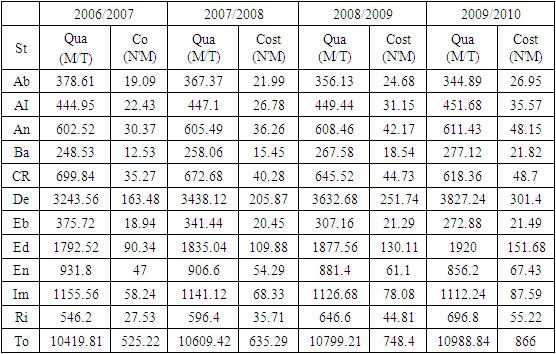
Looking at the concerns and alarm over numerous ecological risks from yam production. The mounting liabilities from cultivation, land treatment with chemicals, usage and the resultant effluent flows and run offs can in some cases sometimes add more insights to the unknown dangers posed to both the built and adjacent natural environments. Considering the predominantly moist nature of the ecozone surrounded by large network of lakes, streams, and major watersheds. Certain level of restraint in the yam farming practices should have been the norm in the applications of chemicals in the lower South region. Yet, during the fiscal years 2006-2010, the volume of fertilizers sprayed during farming periods in the yam producing states of the Lower South region surged to notable levels. The applications reached 10,419.81, 10,609.42, 10,799.21 MT and 10,799.21TMT-10988.84 TMT with some ecological and health repercussions from 2006 to 2010 (Table 3). While the total fertilizer price index across the study area indicated a steady surge of  525.22-
 635.29 to
  748.4-
 866, so did the increases in their corresponding averages of
  87.53-
 105-88 to
  124-
124- 144. In the process, all through the years 2006/2007-2007/2008, a group of four states (Delta, Edo, Imo, Enugu) out of 11 who topped the listing as biggest users of farm chemicals and spenders for purchases, saw increases in the quantity and costs of their fertilizer applications. This involves the high levels in fertilizer use during yam cultivation across the quartet of states. With the initial applications in 2007/2008 made up of 3,243.56 MT- 1,792.52 MT to 1,155.56MT- 931.80 MT, by 2007/2008 fertilizer spray on cultivated land in the areas, stayed at 3438.12 MT - 1835.04 MT, 1141.12, to 906.60. Of the major spenders and users of fertilizers in the zone over the years, in the order of the actual ranking order in place Delta state outpaced its neighbours. In the group 2 second tier states (Cross River, Anambra, Rivers, A/Ibom), in the zone, fertilizer usage among the first two (Cross River, Anambra), ranged from 699.84-672.68, MT to 602.52- 605.49 MT whereas Rivers and Akwa Ibom set aside notable quantities of fertilizers as well. While the volumes of these substances were measured at 546.20 MT - 596.40 MT to 444.95 MT and 447.19 MT for yam land treatment. Elsewhere in the group 3 states, fertilizer distribution towards yam land treatment shows similarities of 378, 367.37 MT to 375.72 MT-, 341.44 MT between Abia and Ebonyi. This is slightly above the fertilizer use levels of 248.53-258.06 at Bayelsa (Table 3).
Table 3. Quantity, Cost, Average Price of Fertilizer by State: 2006/07 - 2009/2010
 |
| |
|
3.2.2. Mixed Economic and Environmental Effects
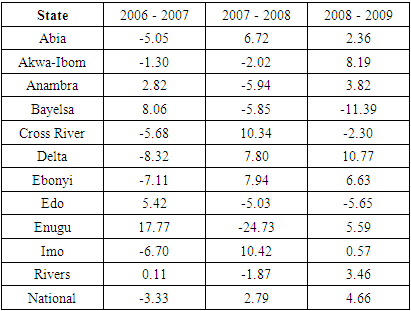
Given that similar patterns followed as well for farm gate prices, it grew noticeably from 2006-2009. This is despite the infrequent declines sometimes in 6 of 11 states in 2006-2007 and 2007-2008, even though 3 of the states saw declines in 2008-2009. Consequently, starting in 2006-2007 in five of the states where farm gate prices held firm, Enugu state accounted for the highest gains of 17.17%, followed by Bayelsa and Edo at 8.06 to 5.42% (Table 3.1). In the same group, both Anambra and Rivers saw 2.0-0.11% gains during the same period. In 2007-2008, another group of yams producing states most notably Imo, Cross Rivers, Ebonyi, Delta and Abia made double and single-digit gains of 10.42%-10.34%, -7.94%,7.80% to 6.72%. Within the same zone, by 2008-2009 in 8 of the 11 states, farm gate prices in Delta, Akwa-Ibom, Ebonyi and Enugu rose by 10.77%, 8.19%, 6.53% to 5,19% in 2008-2009 while the trio of Anambra, Rivers and Abia and Imo saw gains of 3.82%-3.40% to 2.36 -0.57%. Whereas the temporal profile of losses involves identical cases of 5.05-5.68% to 6.70 in Abia, Cross Rivers, and Imo during 2006-2007. Additional losses of 8.32%, 7.11%, 1.30% that occurred were fully manifested in Delta, Ebonyi and Akwa Ibom. Furthermore, in 2007-2008 comes additional losses of which Enugu state emerged with highest rates of -24.73% amidst identical declines in Anambra, Bayelsa, Edo at over 5 percentage levels until the sudden shifts in both Akwa Ibom and Rivers States estimated at -2.02% to 1.87%. Of great significance over time is the extent of declines that emerged in Bayelsa, Cross Rivers and Edo at 11.39%, 2.30- 5.65% in 2008-2009 (Table 3.1). With the overall average farmgate prices for the zone estimated at  27,00 to
  26.93 in each of the periods from 2006,2007, 2009 and 2008. The trio of South- South states led by Delta, Cross Rivers and Bayelsa posted the highest levels of farm gate prices of
  40.11
40.11  30.43 to
  27.5 (Table 3.2).
Table 3.1. Percentage of change of Farm Gate Prices In Naira
 Yam Yam
 |
| |
|
Table 3.2. Farm Gate Prices Naira
 For Yam 2006/2007- 2008/2009 For Yam 2006/2007- 2008/2009
 |
| |
|
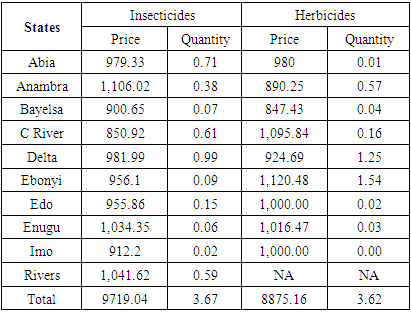
Added to that, even if all through 1995-2015, yam production surged notably at the national level far ahead of the other agricultural products through revenue generation. In order words, although yam output is solely worth 38% of cassava, but its overall crop worth is somewhat greater, considering its attribute as the most valued farm produce in Africa [5,36]. In terms of the value of production (income to farmers), yam is far ahead of the other five main food commodities (maize, rice, cassava, sorghum, and millet) in Nigeria. The annual production value of yam is over US$12.7 billion in Nigeria. Should better seed of advanced types be used at 30% crop surge, the production value could rise to US$17.9 billion in Nigeria. For that, yam remains at the center of community life in many states in the lower south region and west Africa as source of income and job opportunities for citizens where the produce accounts for 70% of world’s total in yam production at $13.76 billion and the benefits overly indisputable. But this has not always translated into complete lift off out of poverty for many farms at the margin. This is happening in a place where yam is planted alongside other crops for efficacy and control of pests under the minisett method involving the treatment of cut pieces of yam with fungicide and insecticide substances to thrive. The utmost frequently applied insecticide for the yam minisett method in Nigeria is chlorpyrifos, an insecticide already barred from usage on farm produces in both the US and the EU before. Given the negative health impacts in people, as manifested with growth and autoimmune ailments [15]. Undoubtedly, such practices seem quite lethal to human health. Nevertheless, the use of agrochemicals in different combinations among yam producing states in the Lower South region remained vigorously firm. This started with massive spraying of cultivated areas with herbicides to protect crops, together with insecticides to keep insects from menacing the harvests and output of the yam tubers in the zone. From the vulnerability of the lower south to the flow of both non-point and point source pollutants, the price totals of  9,719.04-
 8,875.16 for agrochemicals in the procurement of insecticides and herbicides measured at 3.67-3.62, in TMT during 2010 are indicative of the intensity of yam farming activities and the risks posed to benthic environment (Table 3.3).
Table 3.3. Distribution of Farm Agrichemicals (Quantity and Price) '000 metric tons price per kg (N) by State 2010
 |
| |
|
3.3. GIS Mapping and Spatial Analysis
The GIS analysis consists of the graphic display of spatial patterns stressing production, land use, and the costs of seedlings used. On top of that are the various activities indicating the applications of chemicals on the farm environment of the zone essential in the yam land use activities in the different states over time. This comes from the depictions of the indicators in space, the changes, and the production levels in Nigeria’s lower south farm corridors. The information as conveyed through geo-visual analytics in different scales and colors implies the shifting lines of the sector. The ability to picture temporal and geographic dispersal of the production on farmlands using GIS as the analytical tool, stands crucial in showing the state of yam farmland use and the continual capacities of the study area in standing out in the revival of the sector. The GIS mappings of the trends shows continuing dispersion along the yam producing areas and onto various parts of the Lower South region. From the tempo of that dispersal along the Southern part of the nation, it is obvious that the harvesting of yam products seems scattered principally through out sides of the map represented under the activities of landuse and production from the South to the Eastern portions of the study area. The spatial aspects and dispersion of yam land use activities not only exemplifies the state and evolution of the subsector, but it does also show representation of the everchanging forms in space among the core pointers relevant to the continual turnarounds of the crop in the region over the years. For that, the change regarding yam farmland size and the production volume in yellow, green, and red colors from 2006 to 2010 flashes the advent of Imo among areas in the Southeast that saw changes in both cultivated area and output. This shift occurred at proportions not uncommon from the diffusion patterns peculiar to some of the other group of states where active farming is consistent. Bearing in mind the essence of yam output and the cultivated fields in the study area of Lower South Nigeria, the states in the zone saw notable changes in the size of cultivated fields all through 2006-2008. To that effect, considering the info on the map under different shades of the colors denoted in dark brown, red, orange, and yellow spread across the states. Between the 2006-2008 period, the states of Delta in the old Midwest and Ebonyi of the defunct Eastern region saw highest level of changes in the form of gains of 44.60%- 84.60% in the size of yam cultivated area. With the opening spread in the spatial evolution of changes evidenced in the two states represented in dark brown colors in the map. At the same period, the group of states including Anambra coated in dark red along the Northwestern side of the study area and Akwa Ibom in orange color along the lower east on the orange color at the scales of 33.04%-44.50% to 29.12-33.04% reveals a dynamic pattern in two different points in between a variety of spots in space from 2006-2008. As such, it came as no surprise as to how a quartet of neighboring states (Cross River, Abia, Imo, and Rivers) mostly in the light orange spots under the old Eastern region and Edo, showed gains of 21.02%-29.12% in cultivated land areas as Enugu in the Northern plains and Bayelsa along the deep south in yellow colors finished below other states in the study area at 17.40% -21.02% (Figure 2).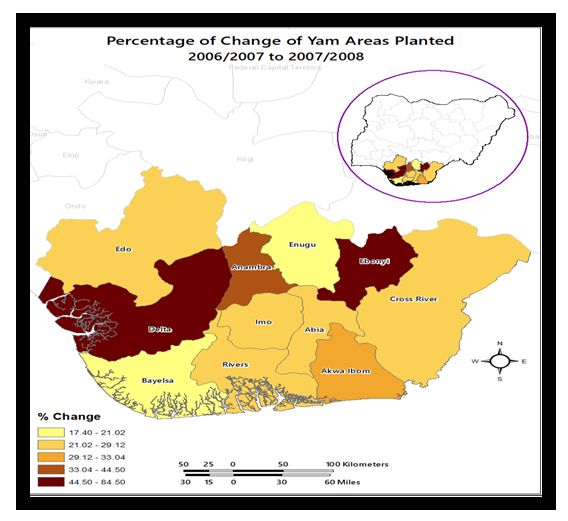 | Figure 2. Percentage of Change Yam Areas 2006-2008 |
With the different patterns of change pertaining to cultivated farmland areas captured in various scales of gains and decline. In the periods 2007 to 2009 during which Cross River state in green color in the southeast axis of the map held the largest levels of gains of 36.69% -55.07%. There follows another pattern punctuated by the shifting gains of 16.13% -36.60% in the light green spots, highlighting spatial trends in the nearby states of Akwa Ibom, Imo and Anambra. From then on came waves declines in farmland areas moving further over space in the quartet of states (at Abia, Rivers, Delta and Bayelsa) in yellow color and Enugu in orange at the rates of -9.03%-18.13% to -27.65% and -9.03% respectively. As if these levels of losses in space were not enough, the states of Ebonyi and Edo represented in red accounted for huge losses at -29.87% to -27.65% (Figure 2.1). By the 2008-2010 season, based on the map, double digit gains of 10.37%-24.11% in the size of the farmland areas in the states of Edo, Delta on the west side of the map and Abia in East as represented in the dark red, exceeded the levels in Ebonyi and Anambra state at 4.06%-10.37% to 2.02%-4.06%. Elsewhere, the duo of Cross River and Imo states in yellow along the southeast accounted for about 1.14%-2.02% in the soft uptick in cultivated land area. In the other places in the study area the lower tier of gains at 0.43%-1.14% began from Bayelsa, Rivers, Akwa Ibom until it spread to Enugu as well (Figure 2.2).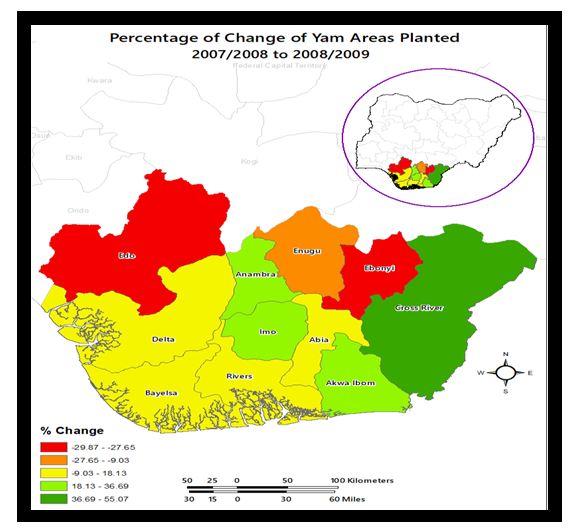 | Figure 2.1. Percentage of Change of Yam Areas planted 2007-2009 |
 | Figure 2.2. Percentage of Change of Yam Areas planted 2008-2010 |
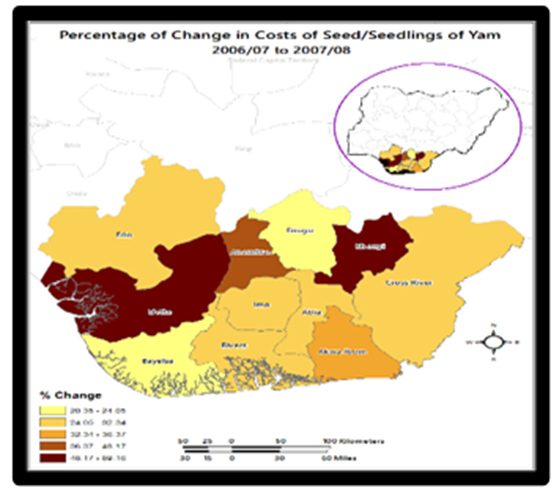
The geographic patterns in the first set of periods in yam production in the study area of Nigeria’s lower south shows similarities in terms of the frequency of declines that occurred in many states between 2006-2008 and 2009-2010. For that reason, despite Delta state’s gains of 13.82% -42.41% under dark green, between the 2006-2008 year in farm output, the sequence of heavy losses seemed deeply concentrated in light green across the East central areas of the map under a circular stretch from Ebonyi, Imo to Anambra state at the rates of 5.03%-13.02%. Further along those levels and out of the adjoining states in the Southeast and Mid-west portion. Within the states of Cross River, Akwa Ibom, Abia and Edo in yellow, emerges another deep set of declines in yam production estimated at -8.34% to -5.03%. Within the same periods, further scales of declines at 15.59%-8.38% to 15.60 extends further, starting from Enugu, Rivers and Bayelsa in the red and orange axis of the area (Figure 2.3). In the following periods of 2007-2009, the sole gains in yam production in only two states compared to the 9 areas under losses points to recurrent trends as mentioned before in the zone. With increases in production at 16.61% -55.00% evident at Cross Rivers and Delta states. The states of Enugu, Anambra, and Imo and Akwa Ibom saw declines of -3.10- 16.61% to -6.73% -3.10, while bigger losses occurred further by -22.05% -6.73 to 22.05% starting all the way from Ebonyi, Abia, Rivers, Bayelsa to Edo (Figure 2.4). With much of the gains in 2008-2010 concentrated in the green zones of the map, Akwa Ibom in dark green not only held on to the highest gains of 15.20%-29.53%, the trio of Enugu, Ebonyi and Abia also posted 4.00%-15.20% increases in production. Elsewhere, in the remaining 7 places where loses in yam production held firm, note that in the yellow spots, Cross River, Bayelsa and Edo experienced drops in the order of -12.00% to -4.00% as Rivers, Anambra, Imo, and Delta states in orange and red encountered additional declines at -31.12%-12.00% to 36.18%-13.20% (Figure 2.5). Looking at the widespread changes in the costs of yam seedings across the zone from 2006-2008, Delta state, Ebonyi and Anambra opened with huge gains of 48.17%-89.16% to 36.37%-48.17% coupled with the scale of change in Akwa Ibom at 32.34% -36.37%. Out of that pattern, the next quartet of states in the Eastern and Mid-western side of the map made up of Cross River, Abia, Rivers and Imo and Edo accounted for 24.05%-32.34% in the spatial distribution of the percentage changes in the price of yam seeds across the states. Towards the tale end, the rates of yam seedlings expenses at Enugu and Bayelsa stood at 20.35-24.05% (Figure 2.6).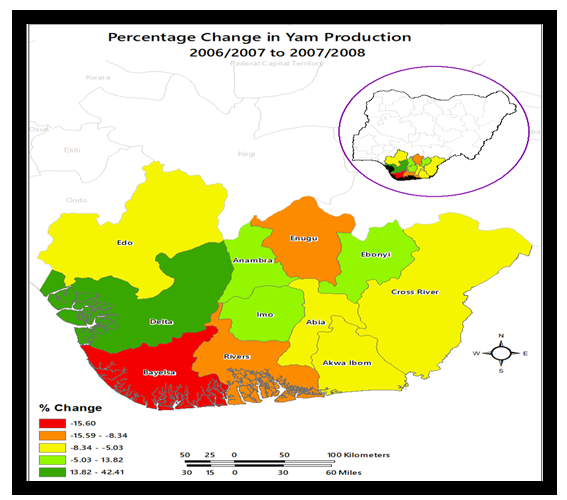 | Figure 2.3. Percentage of Change in Yam Production 2006-2008 |
 | Figure 2.4. Percentage of Change in Yam Production 2007-2009 |
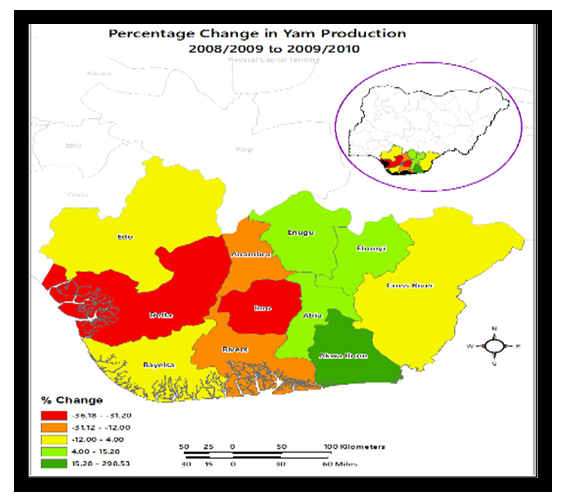 | Figure 2.5. Percentage of Change in Yam Production 2008-2010 |
 | Figure 2.6. Percentage of Change, Yam seed costs 2006-2008 |
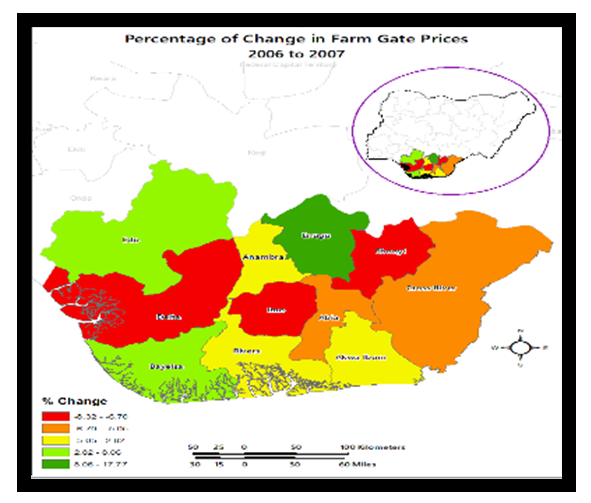
Being the middle map colored with uniqueness during the 2007-2008 period compared to the others, unsurprisingly despite the increases of 16.18%-31.80% in yam seedlings evident in Cross Rivers in the Southeast by 2007-2009, all the other states in the zone saw declines. In as much as part of the initial loses in the light green colors estimated at -9.67-16.18 stretched from four group of states (Akwa Ibom, Imo, Anambra, Delta). Out of the upper portions of the region to the lower side denoted in yellow color, emerged more declines of -38.51%- 9.67% in Enugu, Abia, and Rivers, as Ebonyi, Edo and Bayelsa represented in red and orange spots accounted for much bigger declines of 100%-38.51% to -100.00% (Figure 2.7). With the patterns of outright increases as part the change under various classes visible all over the study area. By the periods 2008-2010, Edo, Delta, Abia states and Ebonyi in dark red and brown color as the leading spots posted increases in price of yams seeds at 12.76%-27.80% to 6.29%-12.75% as Anambra state solely in orange color also experienced increases of 4.22%-6.29%. Seeing the convergence of further gains of 3.31%-4.22% in the light orange, evident at Cross River and Imo states, the yellow spots clustered along the low-lying states of Bayelsa, Rivers, Akwa Ibom and Enugu in the upper North corner saw levels of changes at 2.59%-3.31% in the procurement of yam seedlings between 2008-2010 (Figure 2.8). Following the path of gains and declines in the percentage of change in farm gate prices spread across space from the fiscal year 2006-2007.The states under thick and light green colors as headlined by Enugu, Edo and Bayelsa, made gains of 8.06%-17.77% to 2.82% – 8.06%. Upon that, pressures from the demands in market activities in the zone sparked a gradual decline of various proportions measured at -5.05% to 2.02% to-6.07%-5.05% on the spots in space represented in yellow and orange colors across Rivers, Akwa Ibom and Anambra to Cross River and Abia. In the same order, Ebonyi, Imo, and Delta in red colors rounds out the listings on farm gate price declines at 6.32%-6.70% (Figure 2.9). | Figure 2.7. Percentage of Change Yam seed costs 2007-2009 |
 | Figure 2.8. Percentage of Change in Yam seed costs 2008-2010 |
 | Figure 2.9. Percentage of Change in Farm Gate Prices 2006-2007 |
With the shift towards 2007-2008, based on the map, see that Imo and Cross River states in green color made sole gains of 7.94%-10.42% at levels not evidenced elsewhere. From there on, a common pattern of losses in farm gate prices appears to sweep across at all corners of the zone. Given the way the trends unfolded all through Ebonyi down to Abia and Delta at -1.87% to 7.94% together with -5.03-1.87% rates of declines for Akwa Ibom and Rivers. In the same periods, heavy declines of 24.73%-5.03% not only set in gradually in Edo, Bayelsa, and Anambra, but Enugu on its part, experienced heavier drops of 24.73% as well (Figure 2.10). The split in the spots with gains denoted in green and the declines in yellow areas, reflects a slight balance over what transpired in the geographic evolution in farm gate prices pertaining to yam during 2008-2009. To some extent, the gains (of 8.19% -10.77%) in the percentage change in farmgate prices which started in Delta state, as a testament to emergent patterns in place, reflects the nature of the increments of 3.82% -8.19% that occurred in the light green areas of Enugu, Ebonyi and Akwa Ibom. Even in the areas where farmgate prices declined minimally, they still maintained robust presence in space under yellow colors, firmly planted from upper side of the map at Anambra, further to Imo in the center and followed by the sates of Rivers and Abia. Worthy of note on the spatial patterns as shown in the orange spots, are the heavy and soft declines of -11.39%-2.30% in the farm gate prices. This spatial trend showed full concentration in two states (Edo and Cross Rivers) deemed far apart, while Bayelsa finished on the higher scale of declines at -11.39% in farm gate shortfalls (Figure 2.11). With the percentage change in the costs of fertilizer trending up much of the time, Delta and Rivers State remained in the mix as the biggest users of fertilizers as portrayed in red and mild red colors during the periods 2006-2008, 2007-2009. In the first period both Delta and Rivers State, Bayelsa and Edo in 2006-2008 accounted for the biggest gains in fertilizer use at the rates of 23.30%-29.71% to 19.30% -23.30%. In the orange colors where multiple states of Anambra, Imo, Akwa Ibom, Enugu, Abia, and Cross River posted increases of 15.51%-19.39% -7.97%-15.51%, the fertilizer costs in Ebonyi state reached 7.07% (Figure 2.12). | Figure 2.10. Percentage of Change in Farm Gate Prices 2007-2008 |
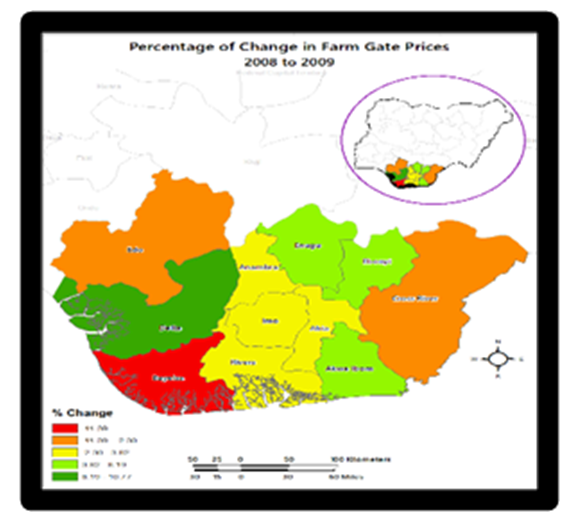 | Figure 2.11. Percentage of Change, Farm Gate Prices 2008-2009 |
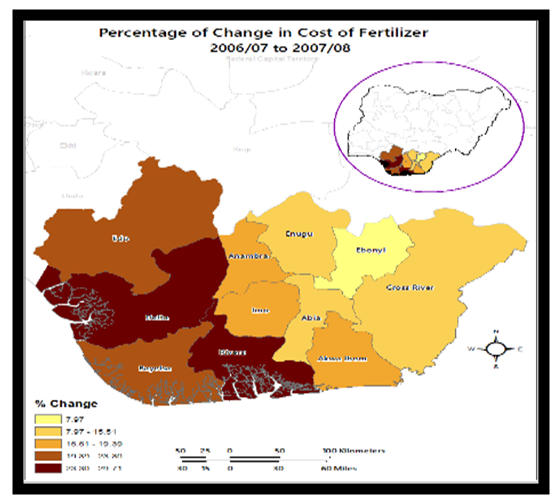 | Figure 2.12. Percentage of Change in Fertilizer Cost 2006-2008 |
In the case of rates of change in the prices of fertilizer over the period, just like in the previous time both Delta and Rivers state outpaced their neighbors in the purchase of fertilizers (in red and mild red colors) in 2007-2009. From the complete breakdown of the info in the legends, the states of Delta and Rivers State, Bayelsa and Edo in 2007-2009 rose notably in fertilizer procurement, at the rate of 20.00%-25.48% to 16.31% -20.00%. Based on info from the region, the spots highlighted in orange colors (tick and light) covers 6 states Anambra, Imo, and Akwa Ibom, Enugu, Abia, and Cross River where the surge in fertilizer purchases vacillated by 12.54% -16.31% - to 4.10-12.54 % as the rising prices of fertilizers faded in Ebonyi by 4.10% (Figure 2.13). Looking at the spatial distribution of the percentage of change pertaining to the costs of fertilizer for 2008-2010 a completely different pattern emerged with Rivers in dark red speckled with highest increases of 19.72% -23.23% and the other trio of states led by Bayelsa, Delta and Edo, in mild red saw increases measured at 14.16%-19.72 %. From there, the rest of the evolution in space reflects increments in fertilizer prices at places where farm nutrients found ample applications beginning with the uptick in the percentage levels of 10.36%-14.16% in three states (Anambra, Imo, and Akwa Ibom) under the spots denoted in thick orange. Elsewhere, the three other states (Abia, Enugu, and Cross River) in mild orange jumped from 0.93%-19.36%. Ebonyi State as the outlier in yellow, saw only less than 1% rise or 0.93% in fertilizer price changes in the study area, all through 2008-2010 (Figure 2.14).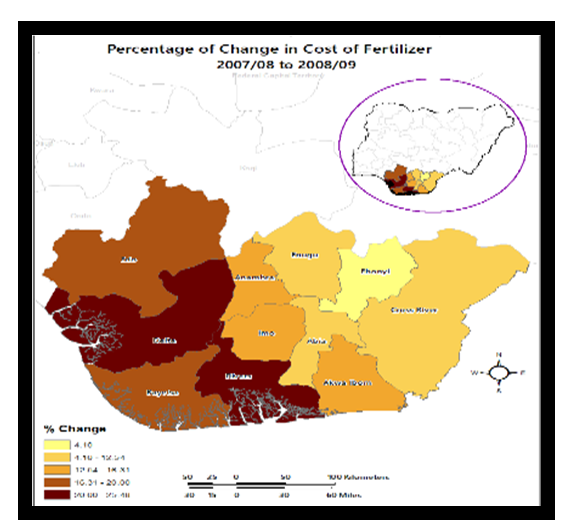 | Figure 2.13. Percentage of Change in Fertilizer Cost 2007-2009 |
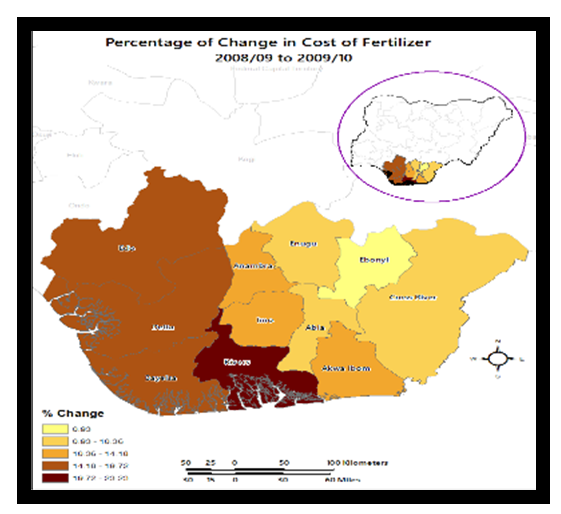 | Figure 2.14. Percentage of Change in Farm Gate Prices 2008-2010 |
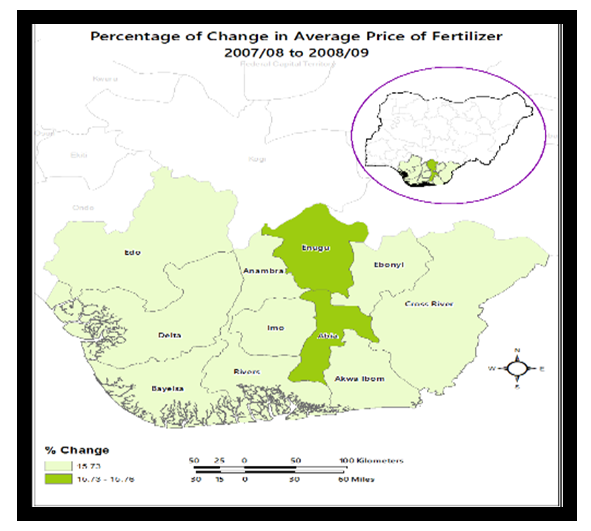
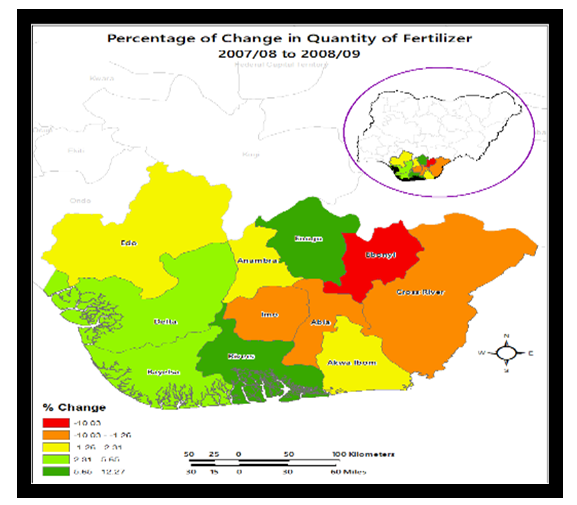
In terms of the temporal spatial distribution of other farm indicators over the years, by 2006-2008 to 2009-2010, the maps show little stability in the patterns of percentage changes in the average price of fertilizer as highlighted in the green and white colors. During the 2006-2008 period, when nearly all the states from Edo to Cross River among 9 of the 11 (denoted in the green) experienced increases of 18.71%-18.80%, Enugu state and Abia in white spots finished at 18.71%. In the face of little change on the geographic diffusion of the prices of fertilizers under a mix of gains and declines that manifested over time. During the periods 2008-2010, 10 of the 11 states in the green portions of the maps maintained 12.75% -14.35% with Abia as the sole outlier at 12.75%. By 2008-2009, a total reversal in pattern distribution emerges as only Enugu and Abia emerged as leading areas with increases of 15.73%-15.76% whereas the other 9 states posted average gains of 15.73% (Figure 2.15- Figure 2.17). Regarding the spatial dispersion of the percentage change in the quantity of fertilizer distribution in place between the periods 2006-2008, 2007-2009, and 2008-2010, aside from the steady spots of gains in space labelled in green, in the lower and upper parts of the map. Ebony state in red in all the times alongside couple of neighboring states in the old eastern region accounted for more declines followed by the spots of steady gains mostly concentrated in the green lower sides along the Midwest and Delta axis. Just as the red, yellow, and orange spots representing Ebony, Cross Rivers, Abia, and Enugu posted heavy declines in fertilizer quantity during 2006-2008. By 2007-2009 most of the declines in the use fertilizers in space held firm again in Ebony, Cross Rivers, Imo, and Abia with the gains evident in the rest of the states in the study area. In the remaining period of 2008-2010, the yellow portions in the central part of the study area from Anambra, Imo and Akwa Ibom, together with the red and orange areas of map (Ebonyi, Enugu, Abia, Cross River) in the Northeast and the middle zone, saw further declines in the applications of fertilizers. However, this did not stop usage in the other states as well. Notwithstanding these slight variations in patterns, note that being mostly a zone of many creeks and many rivers with high propensity to heavy rain falls in the wet season. The threats of fertilizer run offs into the lakes and estuaries pose enormous dangers to marine organisms and others in the surrounding environment (Figure 2.18-Figure 2.20). Consequently, the fragile ecosystems in the study area, are not an exception to these risks’ exposures.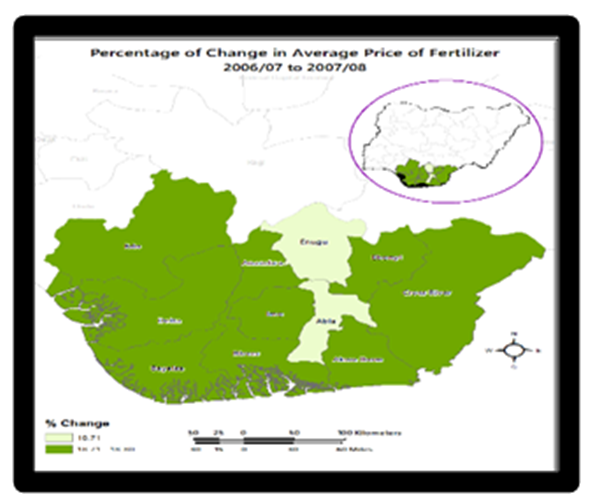 | Figure 2.15. Percentage of Change Average Fertilizer Price 2006-2008 |
 | Figure 2.16. Percentage of Change, Mean Fertilizer Price 2007-2009 |
 | Figure 2.17. Percentage of Change, Average Fertilizer Price 2008-2010 |
 | Figure 2.18. Percentage of Change Fertilizer Volume 2006-2008 |
 | Figure 2.19. Percentage of Change Fertilizer Volume 2007-2009 |
 | Figure 2.20. Percentage of Change Fertilizer Volume 2008-2010 |
3.4. Factors Driving Changing Yam Land Use
The fundamental factors responsible for the changing yam landuse and production trends in Nigeria’s lower South do not operate in a vacuum. They are linked to different elements located in the regional agricultural structure. This encompasses a host of policy, socio-economic, and physical-(environmental) factors. These forces are described briefly in the paragraphs below.
3.4.1. Policy Elements, Infrastructure and Technology
On the policy side, there seems to be a frosty treatment towards yam and as such, decision making has not been benign to the productivity of the crop, seeing the level of attention reserved to the other staple produces. In the process, yam has not only experienced decades of utter neglect in nationwide food policy programs. But it has been negated in the agenda of African regional Development organizations like the African Regional Development Bank (ADB). While these missteps cannot be sugar coated, know that at the time the former Minister of Agriculture under the Jonathan Administration, announced an Agricultural transformation Plan with the aim of advancing nine produces. The move encompassed every key staple in Nigeria but yam. In the absence of a clearly defined national yam strategy coupled with the policy experiments of the past beginning with the operation feed the Nation in the 1970s with little to show for. The Government’s initiatives over the span of over 40 years embody measures among state actors in the sector supporting supply, processing, and production of other crops. These encompasses government programmes like the National Accelerated Food Production Programme (NAFPP), Operation Feed the Nation (OFN), the Agricultural Development Projects (ADPs) and other initiatives. There is now a scheme captioned Yam Improvement for Income and Food Security in West Africa, Phase II (YIIFSWA II). This is a $12 million project funded by the Bill Gates Foundation aimed at developing a commercial seed yam system in Nigeria to benefit smallholder farmers, processors, and their communities within the supply chain. With all these happening in a setting where cash crops, which generated substantial income prior to the era of oil boom in the1970s, have seen little financing. Promoting the petroleum industry while overlooking agriculture made Nigeria extremely susceptible to volatility of oil prices on global marketplace that came to haunt the food sector. In all these, clearly, there have been several programs that were undertaken under research, government programs and Non-Governmental Organizations (NGOs) involvements to enhance yam production in the country, but the outcomes were often negligible. Furthermore, certain policies pursued or steered towards increasing agricultural productivity have also diminished the production and utilization of various produces, most notably yam. Considering the perceptions in the extent to which the consequences of policy changes on yam production and consumption in Nigeria is factor. It has been shown that policy changes on different yam substitutes, especially rice, occasionally negatively impacted yam in terms of production, prices, land access, and real income amongst yam farming households in Nigeria. This again is attributed to lapses and the nature of policy.
3.4.2. Socio- Economic Forces and Demography
There are many socio-economic forces that influence the use of yam farmland. This ranges from the dilemma and constraints faced by farmers in terms of limited access to yam seedlings and the rising market demand for yam despite limitations amidst rising population to feed. The fact that, yam is seen as the most exorbitant crops to cultivate, makes the planting and harvesting stages quite demanding, requiring enormous work time and commitment to achieve maximum output. At the same time, yam seeds are too costly to acquire, and the distribution remain scarce. To that effect, farming households may be compelled to hold on to at least 30%-45% of harvested yam tubers for the cropping season in the absence of steady supply of seeds to fall on. This is in deep contrast when compared to other competing staple crops where only 20% are set aside as seedlings for future planting. Notwithstanding the fact that farmers retain certain portions of the crop yields instead of selling them, yams continue to account for an integral part of the grower’s farm revenues. In that way, yam production in the country and region seems restricted by rising costs and limited yam seedlings. This in turn impedes the capacity of farmers to exploit opportunities offered in the marketplaces amidst rising population, flourishing prospects in affluent urban locales and the promise of overseas export. In that setting, those poor farmers unable to hold on to their farmland, ended up folding up and then see their land converted to other competing uses, hence the loses in the farmland base and fluctuations in production levels. Considering that the business of yam farming and harvesting also requires transportation from the farm gate to marketplace during a period of rising costs and inflation. In that way, most yam farm operators constrained already, often experience the brunt of big farmgate and transportation expenditures of N 26.99 on the average (Table 3.2). With all these happening under deplorable conditions of the roadways restraining distribution and penetration into the marketplace and access to customers. The excessive increments in the costs of yam seeds all over the study area ranged from N1,978.05, N2,735.66, to N2,627.62, N2,834.17. leaves little to be desired. This creates big liabilities for local planters compelled to face market uncertainty without subsidy support to live on in case abrupt cooling-off of market transactions persists. Such an event can divert yam farmland to other things. In those circumstances, meeting the requirements of a growing population and others afar from the zone and localities in the nation and the stresses triggered by the expansion of urbanization onto farm fields, to some degree left some damaging footprints on the region’s agro ecosystem.
3.4.3. Physical Environment, and Diseases
Seeing that the moist climate of the Lower South Ecozone and forest belts and land cover completely support the production of the yam in the multiplicity of states during in the farming seasons. Undoubtedly, the states in the Lower South region share conducive topography and soils and temperature upon which the yam crop flourishes. However, low temperature can diminish the metabolic activity of yam tubers, so are temperature levels of 10° to 12°C. These levels in temperature can be damaging because of the chilling effects, likely to impair yam tissue while water loss also increases vulnerability to eventual decay. Essentially, the crop thrives in abundance within states located in the lower region as manifested in the output levels and the size of cultivated land areas therein. Considering the connection to the physical and social environment dating back to the 1500s across the lower Niger Delta zone, when early Europeans travellers first spotted the viability of the crop in the Bonny axis in the swamp forest environment ecosystem and adjoining land area. Just as it was in the past, the crop is still thriving today the way it was five centuries ago. Having said that, if the crop thrived then in the same manner, compared to the other zones not known for the cultivation in the country. Therefore, the Lower South remains a major farm hub which cannot overlooked given the suitability of environmental systems. Nevertheless, the capacity to produce and harvest yam and its derivatives from yam flour, fufu and chips depends enormously on the exposure to pests and the diseases that can influence the efficiency of operational activities in most farm fields and the expected turnovers. Since the most common types of the pests and diseases in the area encompass yam nematodes and anthracnose occur mostly in the farm fields and yam mosaic virus disease are linked to some of the most extreme losses. The rate of recurrence of these crop diseases on production at yam fam fields can determine variations in land use and production across time given what transpired in the Lower Soutth zone. Accordingly, the threats from pests and diseases can also affect time, labor and expenses directed at tilling and the yield of yam tubers. Just as this puts in jeopardy the capacity of yam growers to profit from opportunities emanating from market transactions. The circumstances are compounded by the lengthy growing sequence of yam tubers.
4. Discussion
The study delved on the scale of yam farmland use by assessing the state, trends, relating to structure and availability under a cluster of associated indicators such as yam cultivated areas, production capacities throughout the Lower South region. This also includes the states and the frequency of changes therein based on gains and declines in land resources together with the issues. The other aspect of the study comprises of the description of links between yam land use, production activities, and the group of policy, socio-economic and ecological, biological, and physical factors located with the larger agricultural structure. With all these shown under the rubric of multi-sectoral involvement, urbanization, demography, availability of infrastructure, the sudden eruption of regular crop diseases, research and development and changing climatic events among others. Consistent with the ongoing assessment are the changing costs in farm produce, growing use of fertilizers and agricultural-chemicals and probable pollution risks in a region fraught with vast web of streams, rivers, and major head waters. Based on the results of the enquiry, the state of yam land base and usage in Nigeria’s Lower South region appears remarkable and extensive with plenty at levels that surpasses other regions. The positives from many of the derivatives, international market ranking and the capacities, bestows a wider allure on the commodity as a principal crop despite the sporadic dangers triggered through crop disease occurrences, changing climate and institutional negligence. Worthy of note in the foregoing analysis is the widespread recurrency in both high production volumes and large swaths of cultivated land areas concentrated in places where five of the defunct Eastern region states (Cross River, Enugu, Rivers, Imo, Anambra) are leading producers. Being key players and no onlookers in the marketplace and neighbouring states contending for the same opportunities. In the same order, even the lower tier states involved in yam farm production and cultivated land areas, have all held their own in many facets. Located in diverse ecological zones starting in the coastal inland, mangrove swamp, freshwater, and lowland rain forest areas with suitable soil conditions. These indicators are essential to the production of yam tubers in the Lower South close to key estuaries with cultivation fields scattered over the place. As a commodity traded locally and globally with usage transcending dozens of states dependent on hundreds of species. The regular domination of Nigeria among yam producers internationally, is in line with capacity and the large swaths of arable land therein. In as much as, the country saw increases and variations among land use indicators in the past years, the belief is that despite the socio-economic status of the crop in the zone and the standing in the orbit of global capital. Nigeria’s tendency to flounder across my areas when it matters undermines the viability of the commodity and capacity to reap yam transaction benefits fully at the global level. While between 1995-2015, the rise in yam output surpassed other farm crops through income creation and yam output alone, this equates to only over 1/3 of cassava values. Even at that, the total commodity worth is somehow more, putting it on a much firmer footing as the most prized farm produce in Africa. In that way, in the context of individual crop value and revenues to growers, yam still outpaces 5 other cash crops from rice to cassava in Nigeria. The yearly output worth at almost $13 billion in Nigeria can still get to as high as to US$17.9 billion in Nigeria if improved seedling types are utilized. Yet, yam remains the locus of community life at the margins due to the economic benefits in the lower south and west Africa as job creator. However, the use of agrochemicals in different combinations among yam producing states in the Lower South region is vigorously firm.To track the extent of yam land use trends, output and changes in the core indicators and declines as a key export produce, the risks of environmental declines, and array of forces and together with the current concerns. The paper used mixscale model of descriptive statistics and GIS with secondary data under groups of socio-economic, physical, ecological, and agro-chemical indicators from percentage of change in yam production to cultivated land area. Even though the geospatial mapping of the patterns using GIS between 2006 to 2010 pinpointed the intensity and diffusion of yam farmland parameters into spots across different states actively engaged in production in the lower South zone. The rise in the use of agrochemicals including pesticides, fungicides and farm nutrients and the effluents from land use drives liabilities, destroying adjoining fragile natural areas in the zone. Furthermore, the changes in yam farmland use did not actually occur in a vacuum. They stemmed from a set of policy, socio-economic, demographic, physical and environmental and tech forces traced within the larger agricultural structure. Drawing from some of the initiatives as identified earlier in the study to assist farmers, processors and stakeholders improve productivity and contain issues faced in yam cultivation in diverse states. The paper proffered remedies ranging from education, monitoring, and regular mapping using GIS and the design of regional yam land resource information system with data on related indicators with interactive features tracking the state of the sector regionwide.
5. Conclusions
This enquiry focused on the assessment of yam farmland under production, size, and the effects on select states in Nigeria’s lower South zone with essential results enumerated below in the following captions: a) The Lower Southern zone has great potentials; b) yam in abundance; c) changes evident in land use indicators; d) mix scale methods effective; e) changes triggered by many factors; f) environmental impacts evident.The important portion of this study comes from the capacity and depth of yam in the Lower South zone of Nigeria. Since yam crops flourish profoundly in diverse locations endowed in biodiversity in damp tropical ecosystems along the Lower South under average yield ratio of 1:5. Even the common limitations, the pursuit of national and regional agricultural policy that targeted and promoted rice along with other substitute crops known to have relegated yam production to the back ground did not stop the produce in trending higher in rankings as the most sought after crop in Africa. This is indicative of the earlier impressions South Europeans visitors had of the produce along Bonny axis in the Niger Delta during the 1500s together with its introduction into the West Africa region 11,000 years ago. Since then, the natural environments in Nigeria’s Lower South region have continuously furnished the critical bio-geoclimatic parameters sustained by conducive temperature, soil, and climate essential in the recurrent growth in production. For that, in as much as yam crop types are fully spread across producing states in Nigeria, the places in the lower Southern zone still hold their own in production activities considering the size of land set aside, crop cultivation, and sheer number of growers in the sector. Seeing the great essence of the crop in the socio-cultural, religious political and economic evolution of the lower Southern region based on 4 growing periods and the festivities attached to the harvest, in many geo-ecological zones. The primary producers among the states in yam crop comprising of Cross River, Imo, Enugu, Anambra, Delta, and Rivers, Edo and host of others remain thriving locales for the transactions. Based on the size of production activities taking place in these states, indisputably yam crop, and its essential derivatives serve vital purposes as key raw material for the industrial sector involved in export and commodity transactions aimed at the orbit of global markets. In that way, yam tubber not only ranks high as vital farm produce, currency earner and calorie supplier indispensable to Nigeria’s family dinner tables and restaurant menu daily. But its various derivatives such as pounded yam, chips, amala, fufu, and fried yam are completely important in the study area and made in Nigeria commodities listed locally and globally. This is evident from Owerri, Port Harcourt, Enugu, Calabar, Asaba, Lagos, DC to New York and in the popular imagination, folklore, and economy of the Niger Delta. In underlining these capacities, this enquiry injected a new way through which the zone can draw on to strengthen the continual relevance and production outlook in the sector and country.The other essential thing that emerged out from research consist of the ratio of changes in yam land use between 2006 to 2010 in Nigeria’s Lower South. In terms of the nature of variations as demonstrated in farm operations pertaining to the two main land use indices of size of cultivated areas and the volume of yam production over the various years. The proportion of change that occurred in the temporal outline, indicates recurring signs of gains and declines. Out of the calibrated model, the scope of cultivated land areas rose in all years like 2006-2008,2007-2009 and 2008-2010 at 34.9%, 11.61 to 5.71 followed by a single gain of 10.66% and double declines in the same periods for production. Along these lines, a quartet of states from Akwa-Ibom to Ebonyi posted big gains at 33.4%-84.5% and another set of five states accounted for mostly single digit increases individually. The only two losses of -12.00% to -3.34% that occurred were mostly in Edo and Rivers state parts of the region. Along those lines, aside the statewide double gains in land areas in 2006-2008, a quartet of states from Akwa-Ibom to Ebonyi posted big gains at 33.4%-84.5% and another set of three states accounted for mostly single digit increases individually in 2007-2009. The only three declines of -29.87, -27.65 to -9.03% that occurred were mostly in Ebonyi, Edo, and Enugu state areas in the zone. Even if the changes in yam production in 2006-2008 demonstrated a big unequal split between the states at a ratio of 8 to 3 under the loss and gain columns. The biggest declines in 2008/2010 at over -31% -19.34% to-12.0 % remained visible in Delta, Imo, Rivers, and Anambra as the others experienced weaker reductions. By the same period and despite the previous losses in yam production, the cultivated areas rose by double digit levels of 19.76%, 23.69%, 10.37-25.11% at Abia, Delta, Ebonyi, and Edo. Notwithstanding, the common shortfalls in output. Recognizing these variations and the rundown of the trends as step forward in land use informatics, provides viable pathways pertinent in the design of a regional yam index and land information system for the region. Applying descriptive statistics and GIS devices under the mixscale orientation as working devices generated abilities essential in the analysis of yam farming activities. The tool stayed exceptionally efficient in spotting the trends, factors, and ecological impacts and changes. Accordingly, the use of descriptive statistics in that way stressed the scope of the systems to characterize the extent of yam production and fam cultivated areas. The applications also cover use and farm gate prices, costs of farm chemicals in the different states in the region with changes in the form of gains and declines and the ratios over time together with the environmental costs of land use. Seeing the level to which GIS mappings revealed the spatial patterns of yam output and the individual state harvests in various forms. The model injected a valued touch in visualizing the spatial clusters in the percentage of change in yam cultivated land area and production. The other aspects encompass spots in space upon which the percentage of change in costs of yam seedlings and geographic locations of the agro-ecological ecozones, and spatial distribution of diverse land cover types were concentrated. Other graphical features also pinpointed the regional flow in liability footprints because of ecological risk indices consisting of farm fertilizers and farm agrochemicals in Nigeria’s lower South region. Based on the robust efficacy in visual bio environmental informatics, analytics, and impact assessment of yam land use in Nigeria’s Lower South axis. GIS showed ample upsides in revealing the site, patterns, scale of probable environmental risks and their diffusion. Underlining these issues helps push the stress in land management in localities viewed at risk of pollution to the arena of policy making where unknown dangers could be immanent. Thus, the study, added an ecological safeguard aspect. Keeping yam producing states aware of these risks as shown in the enquiry, reduces chances of ensuing dangers.Realizing that change in yam land farming relies on many factors including policy, socio-economic, demography, physical environment, and latest tech innovations. The government’s official policy focus on the petroleum sector not only impeded the nation’s farm sector in the 1970s during the era of oil boom, in ways that hampered opportunities for yam growers, but the promotion of substitute crops when oil revenues dropped, did more harm than good for yam. The same can be said of the dismal agricultural policies in the past during which the frame of thinking among Federal policy makers and regional development agencies concentrated only on full promotion of other commodities from rice to cassava. This myopic approach occurred openly regardless of the potential backlash with consequences at the expense of yam cultivation and farming. However, regardless of such obstacles erected by the powers that be. The esteemed socio-cultural, economic, and ethno-religious usage and scientific and class appeal of yam held steady. With such practices running deep for centuries across the country, the lower south and global marketplace continues to sustain the produce as the most sought-after staple. The fact that gains or surpluses in such turnarounds stems partly also from unprecedented surge in cultivated farmland area across the lower south ecozone all through 2006-2010, one need not discount the spillovers from Nigeria’s ranking as the globe’s leading producer of yam. This is evident from the $13 billion in most recent yearly revenue from exports and the way it shaped yam land cultivation and production prompted by rising demand and population. Additionally, even if all through 1995-2015, yam production surged notably at the national level far ahead of other agricultural products through revenue generation. Granted the place of research and development institutions like IITA in advancing modern agricultural biotech in the sector over the years. Nigeria’s position as the number one producer globally relies on favourable topography, suitable soils, and climate in the lower South ecozone. As such, the climate of the Lower South categorized by substantial rains based on yearly average volume of over 4,000 mm in some areas reaffirms the links between production pace and land use as the crop thrives in biodiversity heavy wet tropical ecosystems like the zone. The enquiry in affirming the essence of these forces in the region, reinforced their capacity in the sub-sector in a way capable of shaping public policy.Basically, the impacts of yam land use on Nigeria’s Lower South ecosystem are quite evident seeing the spectre of activities that ensued in the region. For that, yam farming activities, and the related key indices relevant to various stages of production, and processing activities and preservation treatments of the crop to evade pest, produce notable effects. This is threatening the typically moist Lower South farming ecosystem. Being a region in which yam farming remains at the center of community life amidst patterns of landscape encroachments. Poor management practices, like land clearance, the applications of agrochemicals and fertilizers and certain techniques used to increase productivity do leave negative footprints deemed hazardous to the adjoining ecosystem from surface water quality to public health and biodiversity. Since farm nutrients, agrochemicals, and fertilizer effluent flow affects water access and environmental quality. The dangers to flora and fauna come through contacts and contamination. In fact, it does constitute huge risks to biodiversity as well. The fact that the risks from yam chemical effluents already threatens marine organisms such as fish stock and environmental quality. This attests to the gravity of the impacts on both natural and built environment in the yam producing areas in the lower South zone. Given the probability of sudden contacts and interaction with ecological and chemical stressors and drivers of unwanted health ailments during the production process. The enquiry deserves a thumbs up in driving home these concerns. In raising current worries regarding the environmental liabilities of yam production in the policy arena, provides opportunities to elevate them in the public agenda among managers and those in the sector. The assumption is that major stakeholders will draw heavily out of this enquiry when producers are aware of the place of Best Management Practices (BMPs) in their activities over time.In that light, decision makers and scholars require speedy responses to essential queries out of this enquiry. The probable questions include: what form will farmland use, and production assume over time? Does the zone have the capacity to regularly monitor the proportion of agrochemical flows into the ecosystem? How will the perceived limitations in efficiency and other predictors affect land use and output in the region? How will the zone gain from the design of integrated digital regional yam land use index? Which indices should be included in the system? How will the zone address underperformance of yam in the global marketplace?
Appendix
Acronym
 |
| |
|
References
| [1] | Sanusi, W. A. (2006). Food Security Among Households: Evidence from Yam Production Economics in Oyo State, Nigeria. Agricultural Journal. 1:4: 235–239. |
| [2] | Merriam Webster Dictionary. (2023). Yam Tuber Definition Merriam-Webster Inc. Springfield, MA: Merriam-Webster Inc. |
| [3] | Aighewi, B. (2021). Seed Yam Production Using High-Quality Minitubers Derived from Plants Established with Vine Cuttings. Agronomy. 11:5: 978. |
| [4] | Ema, E. (2023). Indigenous Food Yam Cultivation and Livelihood Practices In Cross River State, Nigeria. World, 4: 314–332. |
| [5] | Asiedu, R. (2022 April). Transforming Yam Seed Systems in West Africa. Ibadan, Oyo State: Nigeria International Institute of Tropical Agriculture (IITA). |
| [6] | Ejikeme, J. (2017). The Geography of Yam Production In Southern Nigeria. Journal of Ethnic Foods. 4:1:28-35. |
| [7] | Aieghewi, B. (2021). Seed Yam Production Using High Quality Minitubers In Nigeria. Agronomy. 11:5:978. |
| [8] | Bassey. E. (2020). Constraints and Prospects of Yam In Nigeria. European Journal of Physical and Agric Science. 5:1. |
| [9] | Usman, B. (2023 May). Nigeria: Yam Farmers Lament Government Negligence. All Africa. |
| [10] | Offor, C. (2023 September). Federal Government (FG) May Incur Insurance Claims on Rotten Yam Exports. This Day. |
| [11] | Zainab, O.Y. (2021 November). In Nigeria, Yam Prices Soar, and Culture Suffers. Foreign Policy Magazine. |
| [12] | Adesiyan, F. (2015 December). Effects of Policies on Yam Production and Consumption in Nigeria. Agribusiness 32:3: 363-378. |
| [13] | Khalid, I. (2017 December). Can Nigeria’s Yams Power a Nation. Abuja, FCT: BBC Africa. |
| [14] | UN Food and Agricultural Organization (FAO). (2017 August). Country Fact Sheet On Food and Agriculture Policy Trends. Rome: Italy, FAO. |
| [15] | Ayoola, O. (2022 November). Food Sovereignty vs Food Security (The Future of Yam Farming in Nigeria. The Republic. |
| [16] | Delta State University. (2006 June). Determinants of Yam Production /Eco Efficiency In Southern Nigeria. Abraka, Nigeria: Delta State University. pp337-341. |
| [17] | UN Food and Agricultural Organization (UNFAO). (2011). Agricultural Statistics: Country; Nigeria. Rome, Italy: FAOSTAT, FAO. |
| [18] | Yale Medicine Magazine (1999). What is In Yam? Clues to Fertility: A Student Discovers. New Haven, Connecticut: Yale University. |
| [19] | Eke, B.C. (2021 April). Radio Nuclide Contents In Yam Samples and Health Risks Assessment In Oguta Oil Producing Locality In Imo State Nigeria. International Journal of Physics Research and Applications. 4: 006-014. |
| [20] | Turkur, S. (2017 October). Nigeria Government To Investigate Export of Low Quality Yam to US. Premium Times. |
| [21] | Merem, E.C. (2023a). Assessing Yam Farmland Use Trends In Nigeria’s Lower South Region: Unpublished Completed Draft Manuscript. Jackson, Mississippi: Department of Urban and Regional Planning. Jackson State University. |
| [22] | Osibo O. (2009 March). Nigeria: Country Realizes N56 Billion From Yam Export. Vanguard, Nigeria. Retrieved 2023 March 28th from http://allafrica.com/stories/200903230071.html. |
| [23] | Alaneme, E. (2010, July). Nigeria: China Imports Yams from the Country. Daily Champion, Nigeria. Retrieved 2023 March 28th from http://allafrica.com/stories/201007120175.html. |
| [24] | Merem, E.C. (2023b). Assessing Yam Land Use Trends In Nigeria’s Lower South Region. Paper Presented at The 31st Joint Conference of National Association of African American Studies (NAAAS). Arlington, TX. February 16-18, 2023. |
| [25] | Merem, E. C. (2020). Appraising The Changing Trends In Oil Palm Farming In Nigeria’s Lower South Region. International Journal of Ecosystem. 10:1: 1-22. |
| [26] | Merem, E. C. (2021). The Regional Assessment of Groundnut Farmland Use in Northern Nigeria, International Journal of Food Science and Nutrition Engineering. 11:1. 1-19. |
| [27] | Merem, E. C. (2019 a). Regional Assessment of Climate Change Hazards in Southern Nigeria with GIS. Journal of Safety Engineering. 8:1: 9-27. |
| [28] | Merem, E. C. (2019b). Analyzing Land Use and Change Detection in Eastern Nigeria Using GIS and Remote Sensing. American Journal of Geographic Information System. 8:2: 103-117. |
| [29] | Merem, E. C. (2017). Analyzing Rice Production Issues In Niger State Area of Nigeria’s Middle Belt. Food and Public Health. 7:1: 7-22. |
| [30] | Merem, E.C. (2022 a). Gauging Cassava Land Use Trends in Nigeria’s Lower South Region. International Journal of Food Science and Nutrition Engineering.12:1: 1-19. |
| [31] | Merem, E.C. (2022 February b). Assessing Cassava Land Use Trends in Nigeria's Lower South Region. Paper Presented at 31st Joint Conference of National Association of African American Studies (NAAAS). Dallas, TX. February 14-19, 2022. |
| [32] | Merem, E. C. (2020 February). The Analysis of Palm Oil Production and Land Use In Nigeria’s Lower South Region. Paper Presented At 29th Joint Conference of National Association of African American Studies (NAAAS). Dallas, TX. |
| [33] | Nwachukwu, I. N. (2011). Buying Attitude of Yam consumers in Southeastern Nigeria. Tropicultura. 29:4: 238-242. |
| [34] | Ecoma, C.S. (2013). Edele Festival of The Itigidi People of Cross River State and Its Impact. International Journal Asian Social Science. 3: 1781-1792. |
| [35] | Anuebunwa, F. O. (2002). A Structural Analysis of Yam Trade Flows Into Abia State of Nigeria. Nigerian Agricultural Journal. 33: 17–22. |
| [36] | Asiedu, R. (2010). Crops That Feed The World. Yams. Food Security. 2: 305–315. |
| [37] | Degras, L. (1993). The Yam: A Tropical Root Crop. London, United Kingdom: Macmillan Press Ltd. |
| [38] | Merem, E. C. (2020). Exploring Cocoa Farm Landuse Trends in The West African Region. International Journal of Agriculture and Forestry. 10:1: 19-39. |
| [39] | Merem, E.C. (2022). Assessing Issues In Water Resources Use within Countries in West Africa. International Journal of Ecosystem. 12:1: 1-19. |
| [40] | Korieh, C.J. (2007). Yam Is King! But Cassava Is The Mother of All Crops: Farming, Culture, and Identity In Igbo Agrarian Economy. Dialect Anthropology. 31: 1-2: 221-232. |
| [41] | Obidiegwu, J.E. (2020). The Dioscorea Genus (Yam)—An Appraisal of Nutritional and Therapeutic Potentials. Foods. 9: 1304. |
| [42] | Nahanga, V. (2015 May). An Analysis of Yam Production in Nigeria. Acta Universitatis Agriculturae et Silviculturae Mendelianae Brunensis. 63:2:659-665. |
| [43] | Omotolani, (2022 March). Nigeria Is The Highest Producer of Yam, Thanks To These States. Pulse Nigeria. |
| [44] | Vanguard. (2021). Nigeria Accounts For 47 million Metric Tons of Global Yam Production. Vanguard News Paper. |
| [45] | Khan, S.K. (1987 September). Yam Production and its Future Prospects. Research Article. Retrieved 2023 March 28th From https://doi.org/10.1177/003072708701600302. |
| [46] | Grand View Research Inc (2023). Potato and Yam Derivatives Market Size, Share and rends Analysis Report By Source. San Francisco, CA: Grand View Research Inc. |
| [47] | Amusa, N. A. (2003). Yam Diseases and Its Management In Nigeria. African Journal of Biotechnology. 2:12: 497–502. |
| [48] | Reynolds. T.W. (2015). Food Security: 7:795-822. |
| [49] | National Bureau of Statistics. (2011). Yam Consumption and Production in Nigeria 2010/2011. Abuja, FCT: National Bureau of Statistics. |
| [50] | Ojeh, VN. (2014). Natural Hazard and Crop Yield in Oleh, South-South Nigeria: Flooding in Perspective. Journal of Earth Science & Climatic Change. |
| [51] | Merem, E. C. (2023 March). Assessing The Potentials of Cotton Land Use In Sudan. Paper Presented at the Conference of Minority Public Administrators (COMPA). Baltimore Mary land, MD. March 2- 5, 2023. |
| [52] | Merem, E. C. (2023 March). The Environmental Impacts of Farm Subsidy in California’s South-Central Region. Paper Presented at the 32nd Annual International (West Coast) Conference on Soil, Water, Energy, and Air (AEHS). San Diego, CA. March 20-23, 2023. |
| [53] | Merem, E.C. (2023 March). Assessing Climate Change Impacts In The US Pacific North West Region. Paper Presented at the 97th Annual Louisiana Academy of Science Conference. LSU Alexandria, LA. March 4th, 2023. |
| [54] | Merem, E.C. (2023 March). The Assessment of Climate Change Risks In Maryland’s Southern Region. Paper Presented at the 87th Annual Mississippi Academy of Science Conference. Biloxi, MS. March 23, 2023. |
| [55] | Merem, E.C. (2023 April). Analyzing Issues in Water Resource Management Within the US Northeast Zone. Paper Presented at The National Water Quality Monitoring Council Conference. Virginia Beach, Virginia, April 24-28. |
| [56] | Merem, E.C. (2023 April). The Anthology of African American Environmental History. Paper Presented at The JSU Spring Faculty Research Engagement Week Conference. Jackson, MS. April 19, 2023. |
| [57] | Merem, E.C. (2022 October). Assessing Water Resource Issues Along the US Northeast Region. Paper Presented at The JSU Research Engagement Week Conference. Jackson, MS. October 25-27, 2022. |

 Abstract
 Reference
 Full-Text PDF
 Full-text HTML