E. C. Merem1, Y. Twumasi2, J. Wesley1, D. Olagbegi1, M. Crisler1, C. Romorno1, M. Alsarari1, P. Isokpehi1, A. Hines3, G. Hirse3, G. S. Ochai4, E. Nwagboso5, S. Fageir6, S. Leggett7, J. Offiah1, S. Emakpor8
1Department of Urban and Regional Planning, Jackson State University, 101 Capitol Center, Jackson, MS, USA
2Department of Urban Forestry and Natural Resources, Southern University, Baton Rouge, LA, USA
3Department of Public Policy and Administration, Jackson State University, 101 Capitol Center, Jackson, MS, USA
4African Development Bank, AfDB, 101 BP 1387 Avenue Joseph Anoma, Abidjan, AB, Ivory Coast
5Department of Political Science, Jackson State University, 1400 John R. Lynch Street, Jackson, MS, USA
6Department of Criminal Justice and Sociology, Jackson State University, 1400 John R. Lynch Street, Jackson, MS, USA
7Department of Behavioral and Environmental Health, Jackson State University, 350 Woodrow Wilson, Jackson, MS, USA
8Department of Environmental Science, Jackson State University, 1400 John R. Lynch Street, Jackson, MS, USA
Correspondence to: E. C. Merem, Department of Urban and Regional Planning, Jackson State University, 101 Capitol Center, Jackson, MS, USA.
| Email: |  |
Copyright © 2022 The Author(s). Published by Scientific & Academic Publishing.
This work is licensed under the Creative Commons Attribution International License (CC BY).
http://creativecommons.org/licenses/by/4.0/

Abstract
Cassava, as a staple in Nigeria, is not only commonly found and cultivated across many agro-ecological zones. But it serves a variety of purposes as essential raw material for industries and export commodity. Even at that, and with cassava’s external origins as a root crop introduced into the tropics. The physical conditions in Nigeria’s Lower South axis have for years provided essential bio-geoclimatic parameters like temperature, soil and climate that enabled continual boom in output. For that, cassava crop as basic farm produce, cash earner and calorie source vital to the nation’s menu, ranks high in the popular imagination and economy considering its various derivatives from gari to fufu. In fact, many locals familiar with these derivatives know that cassava as a staple responsible for 80% of the nation’s energy intake remains at the center of daily life in many Lower South communities along the South-South and Southeast zones where the produce features prominently on the daily menu. Said that, the primacy of Nigeria among the largest cassava producers globally is so obvious that her production capacity and land areas exceeds those of her competitors. Accordingly, in the last several years came unprecedented expansion and changes in several core land use indicators. Along these lines, the study area has seen widespread use of agrochemicals, rising prices, mounting threats to the ecosystem, proliferation of diseases and degradation coupled with volatility in farm commodity trade. This paradox is compounded by the underperformance of Nigeria’s cassava industry globally compared to her competitors, knowing full well that much of the output comes from the study area. In the context of all these challenges and recent efforts by government and state agencies to stem the tide and boost efficiency, the study remains an upgrade to the literature. Yet, despite the storied relevance in the political economy of the Southern region, very little exists in the literature on the state of cassava production trends and land use across time, together with a lack of knowledge on dispersion patterns essential for decision-making and elements located within the agricultural structure. Hence, this study will fill that void in research by analyzing the state of cassava land use trends in Nigeria’s Lower South with emphasis on the issues, trends, impacts, factors, efforts, and future lines of action. From the analysis, results point to changes in the form of gains and declines in many cassava land use indicators and threats to the surrounding ecology. Also, GIS mappings pinpointed a gradual diffusion in space where production, land use changes and fertilizer use held firm. With changes attributed to several socio-economic, physical (environmental) factors, the paper proffered solutions ranging from education, monitoring, regular mapping using GIS and the design of regional cassava land resource information system.
Keywords:
Cassava, GIS, Lower South Region, Production, Land Areas, Impacts, Factors, Changes
Cite this paper: E. C. Merem, Y. Twumasi, J. Wesley, D. Olagbegi, M. Crisler, C. Romorno, M. Alsarari, P. Isokpehi, A. Hines, G. Hirse, G. S. Ochai, E. Nwagboso, S. Fageir, S. Leggett, J. Offiah, S. Emakpor, Gauging Cassava Land Use Trends in Nigeria’s Lower South Region, International Journal of Food Science and Nutrition Engineering, Vol. 12 No. 1, 2022, pp. 1-19. doi: 10.5923/j.food.20221201.01.
1. Introduction
Cassava’s origins extend to South America from where the crop started a transatlantic journey near to the inception of slave trade in the 16th century [1-3]. However, it took many years for the produce to attain the present position as essential diet in Nigeria. Cassava without doubt, stands out notably among the essential starchiest crops with is tubbers regularly served as food and pertinent industrial items. Given that the volume of cassava output in Nigeria ranks very high globally, it remains deeply entrenched as well managed farm crop cultivated by millions of small-scale producers [4]. Much of the varieties are so fully dispersed across many states in the country, that the Southern part of Nigeria maintains full dominance in production activities considering the size of areas devoted to the crop and number of farmers involved [5]. Considering that cultivation happens at the beginning of 4 growing periods in the different geo-ecological zones, the leading states in cassava production extends from Anambra, Delta, Edo to Rivers and the others [6]. Yet, in the initial 20 years in post-independence Nigeria, the new administration’s fixation with rice and wheat, prompted blanket subsidy coverages for their importation and cultivations coupled with farm assistance schemes. Cassava, mostly omitted under the state farm aid commodity lists then, was relegated as a non-priority. But, by the decade of the 1980s, when unexpected drops in revenues from petroleum triggered decreases from oil proceeds and limited export cash flows. The authorities imposed stiffer rules and duties on imported items like farm products including wheat. As this resulted in the prohibitions of imported wheat in effect from 1987-1991. The policy accelerated cassava demands and output with an eventual rise in yield by 36% from 1980-1990 [7]. This catapulted Nigeria atop of the global ranking ahead of Brazil as leading producer of cassava [7]. Accordingly, cassava, as a staple in Nigeria, is not only commonly found and cultivated across many agro-ecological zones in the country. But it serves a variety of purposes as an essential raw material for industries and export commodity [8]. Even at that, and with cassava’s external origins as a root crop introduced into the tropics, physical conditions in Nigeria’s Lower South axis have for years provided the essential bio-geoclimatic parameters like temperature, soil and climate that enabled continual boom in production [8-9]. For that, cassava crop as essential farm produce, cash earner and calorie source vital to the nation’s menu, ranks high in the popular imagination and economy considering its various derivatives from garri, to fufu. In fact, many locals familiar with these derivatives know that cassava as a staple responsible for 80% of the nation’s energy intake [10], remains at the center of daily life in many Lower South communities along the South and Southeast zones and beyond where the produce features prominently on the daily menu [11,12]. In the process, of the over 291 million tons of cassava output throughout the world during 2017, in which Africa produced more than 60%. In that same year, Nigeria accounted for 59 million tons, placing it on the prime spot as the globe’s leading producer responsible for 20% of the output. While that represents a 37% surge over a span of ten years. This puts Nigeria exports at around 3.2 million tons yearly with earnings at an all-time level of $136 million in the fiscal year 2013 [13]. Being a crop in which the production serves local and outside consumers with most of the activities in a total of 24 of the 36 states under over 40 categories nationwide [14,15]. Clearly stated, the primacy of Nigeria among cassava producers globally coincides with her capacity and vast land areas known to exceed others [16-19]. For that, the nation saw unprecedented expansions and changes in several core land use indicators over time [20]. Along these lines, the study area has seen widespread use of agrochemicals, rising prices, mounting threats to the ecosystem, proliferation of diseases and degradation coupled with volatility in farm commodity trade. This paradox is compounded by the underperformance of Nigeria’s cassava industry globally compared to competitors, knowing full well that much of the output comes from the study area [21-24]. In the context of all these challenges and recent efforts by government and state agencies to stem the tide and boost efficiency [25], the study remains an upgrade to the literature.Yet, despite the storied relevance in the political economy of the Southern region [26], very little exists in the literature on the state of cassava production trends and land use in the zone across time, together with lack of knowledge on the dispersion patterns essential for efficient decision-making in the farm sector, amidst elements located within the regional agricultural structure. Accordingly, this study will fill that void by analyzing the state of cassava land use trends in Nigeria’s Lower South zone with a mix scale method of Geographic Information System (GIS) and descriptive statistics with a focus on some selected states [27-30]. Given that the emphasis is on the issues, trends, impacts, factors, resource analysis and efforts of institutions to sustain the industry. The paper has five objectives and sections. The initial two objectives cover the analysis of current issues in cassava farmland use and to assess the production trends. The third and fourth aims measure the potentials of cassava farms, the factors, impacts, and efforts. While the fifth objective is to craft a decision support tool. The paper’s five sections cover introduction, methods, results, discussions, and conclusions.
2. Methods and Materials
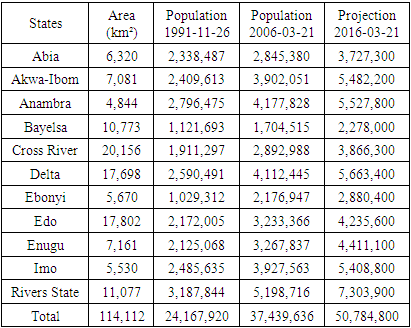
The study area (Fig 1) spans through 114,112 km2 area across 11 states in Southern Nigeria mostly in the Niger Delta region off the Atlantic Coast with a population of 50 million people (Table 1), [31,13]. They are mostly concentrated in two geopolitical zones (the Southeast and the South-south). Most inhabitants in the states also reside along low lying coastal areas where River Niger breaks into several tributaries. The major states in the Lower South region labelled the cassava belt, consists of Abia, Akwa Ibom, Bayelsa, Cross River, Delta, Ebonyi, Edo, Imo, Ondo, and Rivers and Anambra. Essentially, within the South-South area, Cross River, Akwa Ibom, Rivers and Delta outpace others in annual cassava production, while Enugu and Imo loom large as the highest producers in the Southeast [32].Table 1. The Study Area and The Population
 |
| |
|
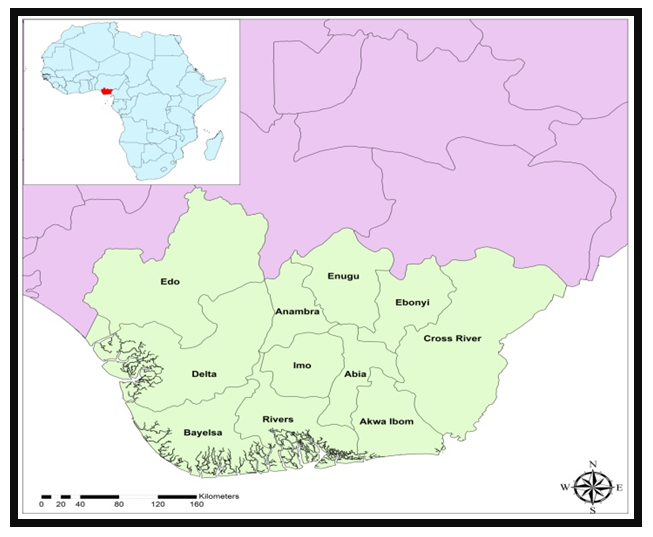 | Figure 1. The Study Area Lower South Nigeria |
Since the ecosystem of the area is highly diverse and supportive of numerous species of terrestrial and aquatic flora, fauna, and human life, it has of one of the richest wetlands in the world [33]. With much of the region divided into four ecological zones made up of coastal inland zone, mangrove swamp zone, freshwater zone, and lowland rain forest zone. There exists an extensive area of mangrove forests, farms, and estuaries on a 3,122 km2 coastline and inland areas where the soils are suitable for the cultivation of cassava crops [31]. Surely, cassava is a perennial woody shrub covered by an edible root, that thrives in tropical and subtropical parts of the globe [1-3]. While it can be grown on a fallow landscape with variations in harvesting periods of 6 to 36 months. Nigeria as the world’s largest producer of cassava boasts of conducive topography and soils in the Lower South upon which the crop thrives [13].The crop initially emerged out of the Americas and brought to the continent of Africa onto the Congo basin through the Portuguese during the 16th century. Known for its abundance in carbohydrates, calcium, vitamins B and C, and other important minerals [1-3], and as a major staple food in Southern Nigeria in a setting where the nation ranks high as the globe’s biggest source of cassava [34]. However, the nutrient composition differs according to variety and age of the harvested crop, and soil conditions, climate, and other environmental factors during cultivation. With the nutritive calorie equivalence in the daily usage of cassava nationwide measured at 238kcal. This crop is ingested in various forms as gari, chips and flour. As production tallies in the mean size of harvested areas in Nigeria rose from 3.8 million tonnes in 2007 to 6.7 million tonnes by 2017. The virtually limited presence of ethanol (a component of cassava) nationwide despite big desire for more than 1 billion litres for industry and household uses remains mind boggling [13]. Despite Nigeria’s prime spot as the leading producer, the nation’s production and processing capacity are quite inadequate. While processing provides opportunities to produce top quality, globally tradeable cassava-derivatives such as tapioca and glucose, the nation devotes countless foreign currency yearly in imports [35-36]. Looking at the number 2 ranked worldwide producer like Thailand, cassava sector therein operates as cash crop instead of staple with much of the tubers managed for exports. Even though the industrial structure differs greatly because of varying aims in production philosophy, Nigeria has much to learn from the Asian Tiger in a way that can improve the sector [37].At same time, even though the planting of numerous varieties of cassava proliferated across farmsteads stretching over the rainforest ecosystem in the zone, the cropping seems linked with use of fertilizers and agrochemicals and other liabilities like pollution, and erosion known to impact the surrounding ecosystem as well [21]. Certainly, cassava which grows all year round, is fully desirable to cultivate than the other periodic crops like yam, beans, or peas. Seeing its remarkable capacity to adjust to climatic variability and a canny capacity to endure drought and minimal soil nutrient deficiency. The study area remains heavily synonymous with frequent precipitation and fluctuating temperature essential for the cultivation of crops. With the Niger Delta area of the zone the nation’s cassava belt accounting for almost 44% of the country’s total output, the area faces the threats of deforestation and pollution emanating from the pesticides used in cassava farms, wastes and effluents [21,34]. Accordingly, cassava production activities as key driver of growth remains integral part of huge fiscal improvements in the welfare of rural people in the Lower South zone. Since cassava crops flourish in a variety of environments including biodiversity rich moist tropical environments in the Lower South at higher output thresholds of 5-8 times ahead of other crops, the trends under a mix scale method must be assessed [38-42].
2.1. Methods Used
The research uses a mix scale approach involving descriptive statistics and secondary data connected to GIS to assess the state of cassava production, uses and the issues involved along Nigeria’s Lower south region in West Africa. The spatial information for the study came through many agencies comprising of National Population Commission of Nigeria, the Federal Ministry of Agriculture and rural Affairs of Nigeria, the United Nations Economic Commission for Africa (UNECA), the United States Department of Agriculture (USDA) foreign agricultural services and The United States Department of Agriculture (USDA) Office of global analysis. Additional sources of spatial data came from the Nigerian Meteorological Agency, the office of surveyor general, the Ministry of Niger Delta Affairs, the Federal government of Nigeria, Additionally, the Rockefeller Foundation, the Government of Former Eastern Region, Government of Midwestern region, the archives of the Federation of Nigeria in the First Republic and the European Union, the Economic Community of West African States (ECOWAS), the World Bank and FAO also furnished other information needed in the research. Principally, much of the cassava crop indicators such as the area cultivated with cassava, the volume of cassava production, the farm gate prices, derivatives, consumption frequency, consumption pattern, per capita consumption, production by geopolitical zones, and the distribution of fertilizers, farm gate prices, agrochemicals, prices of seedlings essential to the region and different zones in the country were obtained from both National and state Government archives of the defunct East and Mid-Western regions of Nigeria, the National Bureau of Statistics, the Lower South Departments of Agriculture, Mundi Index and Keoma. In the same vein, the International Institute of Tropical Agriculture (IITA), the National Root Crops Research Institute (NRCRI) and the National Seed Service, and the Cassava Multiplication Programme Coordinating Unit (CMP-CU) served essential purposes in the process as well. On the one hand, the World Bank, the agricultural and data base of the United Nations FAOSTAT, USAID, International Fund for Agricultural Development (IFAD) data, Anambra state, UK Department for International Development’s Market Development program and the Bureau of National Statistics provided the extra secondary data on the numbers, quantities, trends, gains and declines in cassava indicators and the other groupings. On the other hand, National Cassava Producers Association, Keoma, Nigerian Data Portal, the Ministry of Health and Nutrition offered the assistance on historical data and other valuable information on cassava derivatives. Concerning the remaining data needs, the Central Bank of Nigeria, (CBN), the Statiststa, and the Nigerian Agricultural web portal, and the Nigerian Information Technology Development agency and the agricultural Insurance Cooperation were involved in the procurement of information on the areas cultivated, the volume produced and the highlights of changes. Given that the boundaries stayed same and unchanged, the regional and state, county and federal geographic identifier codes of the country were used to geo-code the info contained in the data sets. This information was processed and analyzed with basic descriptive statistics, and GIS with attention paid to the temporal-spatial trends at the state and regional levels in the Lower South zone of Nigeria. The relevant procedures consist of two stages listed below.
2.2. Stage 1: Identification of Variables, Data Gathering and Study Design
The starting stage in this study started with the identification of variables required to appraise the scale of cassava production and trends at the regional and state levels from 2000 to 2011. The variables encompass of socio-economic and environmental data made up of population, annual rainfall, population change, quantity, cost, average price of fertilizer by state/region, farm gate price by crop and state for cassava, costs of seed/seedlings of casava state-wide. The others consist of cassava root tuber prices, as well as cassava, derivatives, tubers, garri, fufu, starch, cassava varieties across the Lower South region of Nigeria. Added to that are the volume of quantity and price of agrochemicals, like herbicides, and insecticides, percentage of quantity and price of agrochemicals, like herbicides, and insecticides, percentage of change: quantity, cost, average price of fertilizer by state, percentage of change: farm gate price by crop and state in naira for cassava, percentage of change: cassava areas planted (in thousand hectares) and production. Notable among the variables consists of cassava production by zone, percentage of change in cassava production by zone, distribution of farm agrichemicals (quantity and price) herbicides and insecticides, cassava areas planted and production, daily consumption of cassava per capita, consumption patterns, grams per person per day and cassava producing nations. The variables as mentioned earlier were derived from secondary sources made up of government documents, newsletters, and other documents from NGOs. This process was followed by the design of data matrices for socio-economic and land use (environmental) variables covering the census periods from 2000-2011. The design of spatial data for the GIS analysis required the delineation of county and boundary lines within the study area as well. Given that the official boundary lines between the 11 states remained the same, a common geographic identifier code was assigned to each of the area units for analytical coherency.
2.3. Stage 2: Step 2: Data Analysis and GIS Mapping
In the second stage, descriptive statistics and spatial analysis were employed to transform the original socio-economic and ecological data into relative measures (percentages, ratios and rates, averages). This process created the parameters for indicating, the amount of cassava production, cultivated area, land use change, farmland deficits from activities and vital to cassava derivatives, cassava production by zone, the frequency of consumption, daily consumption of cassava per capita, and grams per person per day. Of importance in all these are the farm gate prices and the related like averages in the Lower South region and changes in land use indicators prompted by growing consumption and population surge and growth rates across the study area among the individual states through measurement and comparisons over time. While the spatial units of analysis consist of the various states, regions, shorelines, counties, the boundary, and locations where the farming, consumption and export of cassava crop thrived. This approach enables the recognition of change and the level of usage. While the graphics or tables highlight the actual frequency and impacts, casava cultivation land declines and the pace of production and the trends as well as the environmental and fiscal expenses. The remaining steps involves spatial analysis and output (maps-tables-text) covering the study period, using Arc GIS 10.4 and SPSS 20.0. With spatial units of analysis covered in the 11 states (Figure 1), the study area map indicates boundary limits of the units and their geographic locations. The outputs for each state in the region were not only mapped and compared across time but the geographic data for the units which covered boundaries, also includes ecological data of land cover files and paper and digital maps from 2000-2011. In as much as this process helped show the spatial evolution of spots clustered over the zone, various levels of usage, and the trends. The approach pinpoints the ensuing socio-economic and environmental impacts, as well as changes in other variables and factors driving the production volume, cassava land use and the effects in the study area.
3. The Results
This part of the research centers on temporal and spatial analysis of cassava landuse activities in the study area. Using descriptive statistics offers an initial spotlight on the analysis of land usage and cassava production at the regional and state levels, mainly from the large to small producing states. The other portions present the percentage composition and distribution of both land use and cassava output over the different periods together with impact assessment of the accumulated risks from farm operations in Nigeria’s Lower South region. This is followed by the continuing parts of the section comprising of GIS mappings, and the recognition of the factors behind variations in the Lower South zone’s cassava cultivation activities and the efforts of several stakeholders in therein.
3.1. Regional Land Use and Production
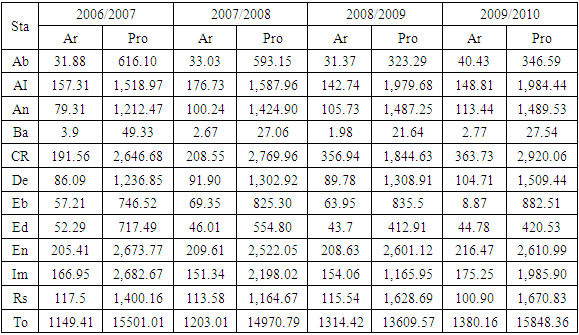
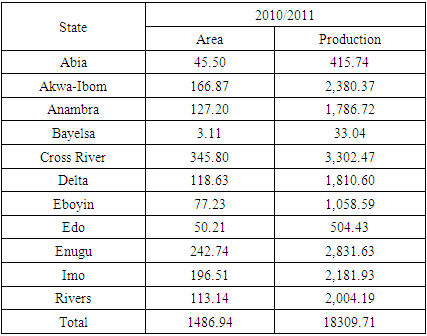
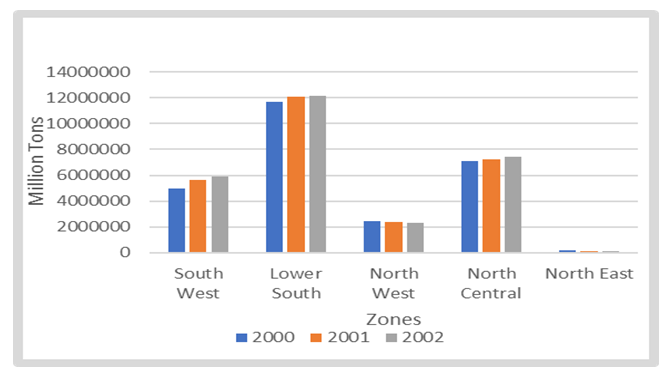
In the context of analysis and taking into consideration the info in the metrics during 2006-2007-2008 in which the study area cassava planted land opened from 1149.41to 1203.01 thousand hectares. By the next fiscal years of 2008/2009 to 2009/2010 and 2011, the land base rose further by 1314.42 hectare-1380.16 thousand hectares, to 1486.94 as well. In a slight contrast, the output of cultivated land areas for the entire region during the periods yielded vast quantities of cassava estimated at 15501.01-14970.79 thousand Metric Tons (TMT). This is followed by another batch which stood at 13609.57 thousand Metric Tons and 15848.36 TMT in 2011 at a level close to 2007 to an all-time high of 18309.71 TMT (Table 2-2.1). Realizing the prime spot of the Nigeria’s Lower South in cassava production all these years compared to other zones, the study area combined for over 11,652,244 million tons to 12,076,356, 12,167, 984 million tons in the periods 2000 through 2001 and 2002. This not only amounts to the individual totals of 26,363,099, 27,521,016 to 27,938,049 million Tons, but it surpasses the levels for the North central region at 7,000,0000 plus tons during the years 2000 to 2002. At that time, the Southwest zone’s outputs of 4,993,380-5,663,614 million Tons and 5,883,805 million tons still fell below the Lower South production levels as the Northeast production capacity stayed abysmally meagre. In terms of the ratios, the Lower South in those different years accounted for about 44.19%, 43.88% to 43,55% of the national totals respectively at growth rate of 4.42% compared to 5.97% surge for the nation from 2000-2002 (Figure 2).Table 2. Cassava Areas Planted (in thousand Hectares) and Production (in Thousand Metric Tons) by State
 |
| |
|
Table 2.1. Cassava Areas Planted (in thousand Hectares) and Production (in Thousand Metric Tons) by State
 |
| |
|
 | Figure 2. Regional Distribution of Cassava Production, 2000-2002 |
3.1.1. Cassava Cultivated Areas
At the state level and among the big 4 comprising of the neighboring Eastern states of Enugu, Cross River, Imo and Akwa Ibom in 2006-2007-2007-2008. Cassava planting not only rose, but it covered large swaths of areas of about 205.41, 209.61 hectares to 191.56-208.55 Thousand hectares to 166.95-151.34 Thousand hectares. Further along the years in 2008/2009-2009-2010, even though Enugu and Imo state(s) cassava land area saw increases of 208.63-216.47 Thousand hectares and 154.06 -175.25, they still fell below Cross River state whose land base as the highest therein reached 356.94-363.73 Thousand hectares. This trend extended deeper into 2011 with cassava cultivated land areas of 242.74 to 196.51 thousand hectares in both Enugu and Imo deemed lower than Cross Rivers State at 345.80 hectares. By 2006-2011, in the second tier of states, a group of quartets of them headlined by Akwa Ibom, Rivers, Delta, and Anambra used up notable swats of land that surged during the planting seasons throughout the years. For Akwa Ibom land areas set aside for farming ranged from 157.31, -176.73 Thousand hectares and 142.74-148.81 Thousand hectares to 166.87 thousand hectares respectively. In the case of Rivers state, in as much as the state’s planted cassava land plots plummeted visibly back-to-back by 117.5-113.58 Thousand hectares and 115.54-100.90 hectares until slight jump of 113.14 hectares. Both Anambra and Delta saw surges of appreciable lengths in cultivated areas. For the former, the land use in 2006-2008 which started with the initial size of farm plots for cassava of 79.31-100.24 Thousand hectares, surged by 105.73-113.44 to127.20 thousand hectares. In the later, Delta state’s farmland surge at 86.09-91.90 Thousand hectares, went up further by 89.78-104.71 Thousand hectares and up to 118.63 in 2011. Among the 3rd (lower) tier group of areas, Abia, Bayelsa, Ebonyi and Edo rounded out the list regarding cultivated areas. In the individual places, even though the sizes were much smaller than the big states, the patterns that emerged in the temporal profile of cassava land use involves a mix of outright surges in some places with occasional drops in others. In the adjoining states of Abia and Ebonyi, cultivated areas for the crop which rose all the time, covered about 31.88-33.03 Thousand hectares, 31.37-40.43, to 45.50 thousand hectares in the last period in 2011 at Abia. In the same manner, Ebonyi’s cassava land size rose by 57.21-69.35 Thousand hectares to 63.95-68.87 Thousand hectares between 2006 through 2010 followed by a late rally of 77.23 thousand hectares. In Edo state where Cassava plantations fell from 52.29-46.01Thousand hectares, by 2009 and 2010-2011, the number jumps from 43.7 Thousand hectares to 44.78 hectares and 50.21 Thousand hectares. The state of Bayelsa as underperforming area among its neighbors experienced a drop from 3.9-2.67 hectares in 2006-2008, by only to peak up slightly by 1.98- 2.77 to 3.11 thousand hectares.
3.1.2. Cassava Production Levels
The extent of cassava output capacity of the states as the info indicates, highlights the strong cassava activities in the 3 major producers made up of Enugu, Cross River, Akwa Ibom and Imo in which they surpassed the entire states during 2006-2011. From the individual distribution of the actual production, Cross Rivers held on to the top spot far ahead of the others with 2,646.68-2,769.96 to 3,302.47 TMT in output with increments. The production activities in Enugu, Akwa Ibom and Imo shows cassava yields of 2,673.77-2,522.05 to 2,682.67-2,198.02 TMT to 2,831.63-2,181.93 TMT. Even though impressive by the volumes, they still culminated in downward slides. Elsewhere in group 2 list of producers comprised of (Rivers, Delta, and Anambra), the momentum of cassava output stood firm (at 1,518.97-1,587.96, 1,979.68-1,984.44- TMT), The same goes for Anambra at 1,212.47-1,424.90TMT, to 1,487.25-1,489.53 and 1,786.72 TMT. Similar pattern for the upswing in cassava capacity in Delta state at 1,236.85-1,302.92, 1,308.91-1,509.44- 1,810.60 TMT exemplifies the potentials of the area as a tier 2 actor in the produce along the Lower South all through 2006-2011. Despite initial fluctuations in output for Rivers state at 1,400.16-1,164.67 TMT by 2006-2008 and 2011, in the ensuing periods of 2009-2010, the state’s cassava production rose from 1,628.69-1,670.83 to 2,004.19 TMT.Looking at the group 3 states (Abia, Bayelsa, Ebonyi, Edo) the consistency of Abia and Ebonyi in the cassava production volumes of 616.10-593.15 TMT to 323.29- 346.59, to 415.74 TMT and 746.52-825.30 TMT, 835.5 TMT- 882.51 TMT to 1,058.59 seemed remarkable. The two other remining states (Edo and Bayelsa) whose production forms followed identical paths accounted for outputs relative to their capacities. In the former, cassava output fell or changed from 717.49-554.80 TMT followed by an uptick of 412.91-420.53 and 504.43 TMT in the periods 2006 through 2011. Bayelsa saw its meagre opening production of 49.33 TMT drop to 27.06 TMT in 2006-2008 but moves up from 21.64 TMT to 27.54 TMT and 33.04 TMT during 2009 -2011. In the second tier of states, a group of quartets of them headlined by Akwa Ibom, Rivers, Delta, and Anambra accounted for the delivery of vast quantities of cassava in the order of 1,518.97, -1,400.16, TMT to 1,236.85-1,212.47 TMT all through 2006-2007. Among the lower tier group of areas, Abia, Bayelsa, Ebonyi and Edo rounded out the list with cassava output of 616.10 thousand Metric Tons during 2006-2007. Furthermore, the cassava farming trends continued with 49.33 TMT, 746.52 TMT. This is followed by another round of activities measured at 717.49 TMT as well.
3.1.3. The Percentages of Change and Composition
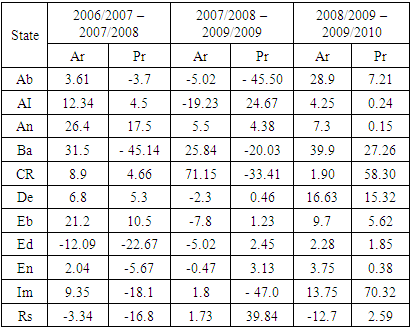
The changes in the land use indicators of areas under cassava cultivation and production in the zone during different years consists of a mix of gains and declines with 2008/2009-2009-2010 as the period of most complete increases, and 2009/2010-2010-2011 tied to losses compared to the other years. In the period 2006-2008, the areas under cassava were up in 9 states while the other two states saw declines. Under such a scenario, the high double-digit gains of 26.4%, 31.5%-21.2% -12.34% were quite pronounced in the first four states of Akwa-Ibom, Anambra, Bayelsa and Ebonyi as five others (Abia, Cross River, Delta, Enugu, Imo) made mostly single gains of 3.61%,8.9, 6.8 - 2.04, 9.35% correspondingly. On the loss column, Edo and Rivers State cassava land areas drooped by -12.00 to -3.34% (Table 2.2). The changing trends pertaining to production involved a split among the states with declines in 6 and gains in 5 others, in that way the heaviest drops (- 45.14% to 22.67%-, -18.1% -16.8%) occurred in Bayelsa, Edo, Imo, Rivers Anambra with lower declines of -3.7 to 5.67 at Abia and Enugu states. Conversely, the soft gains of 4.5%-4.66%-5.3% at Akwa-Ibom, Cross River and Delta were followed by notable rallies of 17.5-10.5% for Anambra and Ebonyi states during the same periods of 2006-2008. In 2007-2009, the land planted with cassava crop fell in 6 of 11 states with largest declines of -19.23, -7.8, in Akwa-Ibom, Ebonyi followed by -5.02% -2.3 drops at Abia, Edo, and Delta coupled with meagre declines of -0.47% in Enugu as well. The only gains started with huge ones that occurred in Bayelsa, and Cross River estimated at 25.84-71.15%. This later evaporated gradually in trio of states from Anambra, Imo, to Rivers by 5.5%, 1.8%, and 1.73%. At the same time, the frequency of gains appeared more pronounced, but the huge double-digit declines of over -45.50%, -33.41%-20.03 in cassava production in Abia, Imo, Cross River and Bayelsa were so prominent in values that they surpassed the highest proportions of gains of 24.67%-39.84% in only Awka-Ibom, and Rivers. This faded into lower single digit points despite a combined total and average of 11.65%-2.33% posted in a quintet of states including Anambra, Delta, Ebonyi, Edo and Enugu along the way (Table 2.2). Table 2.2. Percentage of Change: Cassava Areas Planted (in thousand Hectares) and Production (in Thousand Metric Tons) by State
 |
| |
|
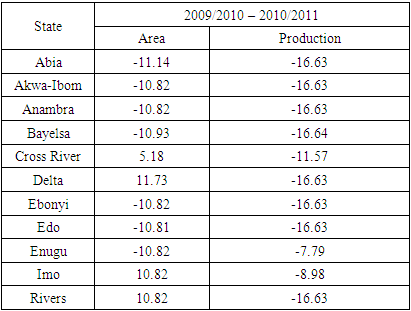
In deep contrast with the other periods, during 2008/2009 -2009/2010 except for -12.7% declines in planted fields in in Rivers state, both cassava output and cultivated land value surged notably in every state in the study area. Worthy of note in the use of cassava land is the high gains of 28.9- 39.9% to 16.63%-13.75% in 4 states (Abia, Bayelsa, Ebonyi, Imo) as the remaining ones from Akwa-Ibom, Anambra to Enugu states only finished with single digit increases of 4.25%, 7.3% -3.75%. With the gains in cassava output far much more pronounced in Bayelsa, Cross Rivers, Delta, and Imo by 27.26, 58.30, to 15.32-70.32%, the rest of the states only held on single increases at levels below the quartet of lower south states. In 2009/2011, the extent of losses in both cassava land under cultivation and production in mostly double-digit levels were so heavy that only Rivers, Imo, Cross Rivers, and Delta accounted for gains of 10.82, 5.18%-11.73% in land areas (Table 2.3).Table 2.3. Percentage of Change: Cassava Areas Planted (in thousand Hectares) and Production (in Thousand Metric Tons) by State
 |
| |
|
3.2. Impact Assessment
Given the rise in cassava production activities amongst the states in the study area. There are far mounting risks regarding the impacts of various scales over the usage and purchase of chemicals among farmers in Nigeria’s Lower South cassava producing hub with environmental and socio-economic fallout.
3.2.1. Ecological Risks from Surge in Fertilizer Use
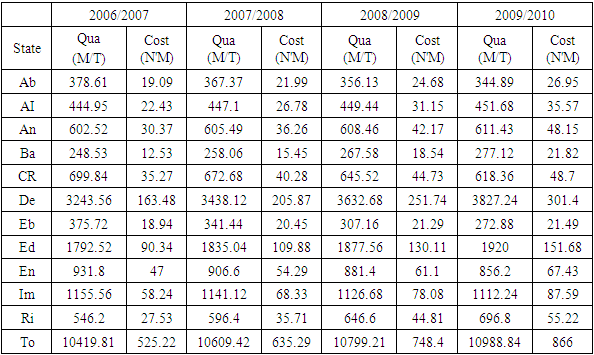
Looking at the concerns and alarm over numerous ecological risks from cassava production. The mounting liabilities from cultivation, land treatment with chemicals, processing and the attendant nuisance from odours and effluent flows and run offs are sometimes big reminders of the dangers posed to both the built and surrounding natural ecosystems [43]. Being in a predominantly moist ecozone with the vast presence of lakes, streams, and major head waters. One would expect some degree of caution in the cassava farm use of chemicals in the Lower South region. Still in the fiscal years 2006-2010, the volume of fertilizers sprayed during farming periods in the cassava producing states of the study area surged to notable levels. The applications reached 10419.81, 10609.42, 10799.21 MT and 10799.21 TMT-10988.84 TMT with some ecological and human health repercussions from 2006 to 2010 (Table 3). While the price index showed a consistent surge of N525.22, N635.29, N748.4 to N866.7, of the 11 states, (Akwa-Ibom, Anambra, Bayelsa, Delta, Edo, and Rivers) experienced increases in both the quantity and costs of their fertilizers. Elsewhere, 4 other states (Abia, Cross Rivers, Eboyin, and Enugu, Imo) saw a split in the distribution of both indicators (Table 3). Table 3. Quantity, Cost, Average Price of Fertilizer by State, 2006/07 - 2009/2010
 |
| |
|
Beginning with the 3 big users and spenders in the zone in 2006-2010 in which Delta surpassed everyone in all categories. The state’s fertilizer uses of 3243.56 MT -3438.12 MT to 3632.68 MT-3827.24 MT amounted to the highest costs of  163.48-
 205.87 and
  251.74-
 301.4. This coincides with activities in nearby Edo where fertilizer applications at relatively high quantities stayed on the rise (at 1792.52-1835.04 MT to 1877.56-1920 MT). With that came expenses (
 90.34,
  109.88,
  130.11 to N151.68) ranked second in the regional classification of the most active states as Anambra and Rivers average fertilizer use and costings hovered around identical values of 606.9 MT-625.5 MT to
  39.23 -
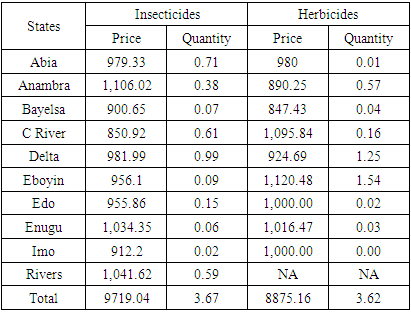
  40.81. Thus, from the tabular snapshots, it is evident, that the applications of fertilizers amongst cassava farms in the region seems on the rise at levels deemed quite risky to the adjacent lakes and rivers and the farm operations (Table 3).However, the use of agrochemicals in different combinations among cassava producing states in the Lower South region remained vigorously firm. This started with massive spraying of cultivated areas with herbicides to protect crops, together with insecticides to keep insects from menacing the harvests and output of the cassava tubers in the zone. From the vulnerability of the lower south to the flow of both non-point and point source pollutants, the price totals of
  9719.04-
 8875.16 in the procurement of insecticides and herbicides measured at 3.67-3.62, in TMT during 2010 are indicative of the intensity of cassava farming activities and the risks posed to benthic environment (Table 4).
 Table 4. Distribution of Farm Agrichemicals (Quantity and Price)'000 metric tons price per kg (N) by State, 2010
 |
| |
|
3.2.2. Mixed Economic and Environmental Effects
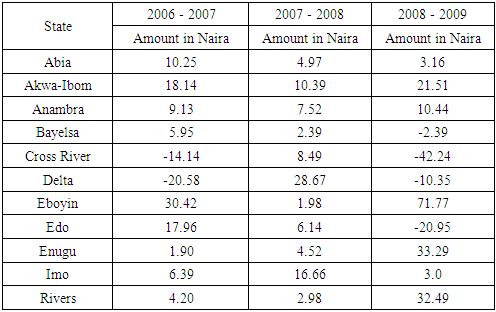
Considering that the same thing also goes for farm gate prices which rose visibly in 2006-2009 despite the occasional drops at times. Consequently, in 7 of the 11 states, farm gate prices in Abia, Akwa-Ibom and Anambra surged 10.25%-18.14% to 9.13% and 4.97, 10.39, 7.52% during 2006-2007 to 2007-2008. In 2008-2009, it held firm at 3.16, 21.51 to 10.44%. In the other states, the highest farmgate price changes of 30.42%, 1.98 to 71.77% surfaced at Ebonyi whereas at Enugu, the variability in cassava farmgate expenses stood at 1.90-4.52 to33.29%. Also note that in 2006-2007 to 2007-2008, at Imo and Rivers, the price changed by 6.39, 4.20 % to 16.66-2.98 coupled with 3.0 and 32.49% by 2008-2009. Even at that, one need not overlook the highest farmgate price declines of -14.14-to -20.58 to -42.24 to-20.95 in Cross River, Delta, and Edo in the fiscal years 2006-2007 and 2008-2009 (Table 5). The variability in the farm gate transactions and money exchanges creates winners and losers. This keeps the lower tier producers worse off and unable to match up with the solid fiscal trajectory at the disposal of large corporate farms built to thrive under market price shifts. With no capacity to sustain changes in prizes at farm gates often dictated in the international marketplace. The small grower’s inability to benefit from an equal level playing field in those circumstances is an indication of the role in the state of cassava land use in the Lower South. However, on the fiscal upsides, the place of intense cassava production in the economy of the nation and the Lower South cannot be discounted. In a nation where the processing of cassava onto valuable food items, stands at the center of economic welfare of many homes in the countryside. Marginal producers have not only been dominant in the sector prior to the national cassava initiative in 2002-2003. But they account for more than 80% of cassava output together with the actual processing into staple food for the country. Aside from oil and gas, cassava ranks high as a key feature of Nigeria’s gross domestic product (GDP) [44]. This would not be this way, without the pace of activities in the cassava production subsector hence, the role as an underlying factor. Table 5. Percentage of Change: Farm Gate Price by Crop and State In Naira For Cassava by State, 2006-2009
 |
| |
|
With cassava tuber made of at least 70% water, the transformation to garri leaves in its wake different by-products in the order of cassava peelings (21.8%), cassava mill effluents (CME) (16.2%), sieviates (7.5 %), air emission (19.8%) as well as cassava flour (25.0%). As such, the untreated wastes generate unpleasant sewage pools through which potent odours emanate. Given the nuisance from pollution, there appears to be a linkage between cassava production, environmental degradation, and water shortage. Thus, since these by-products mostly solid and liquid trash end up into the surrounding ecology in the absence of processing [45]. They really represent serious health dangers. The endless flow of cassava wastewater from processing farms constitutes very severe challenges. Because the capacity of CME to trigger acidification within marine environments, poses enough danger to different life forms or biodiversity therein like fishery stocks and other organisms in the ecosystems. Most fish populations often become endangered because of diseases, destruction of eggs, as well as high mortality level for oyster and types of crustaceans. The acidification of surrounding water and soil amounts in that way results into declines in food sources and loss of fishery stocks over time with effects on people who rely on fisheries as protein source [46]. Consequently, with many areas adjacent to the head waters reliant on fisheries as income source among local folks in the study area [47]. Communities especially in the lower South states like Bayelsa state, Delta and Imo in Niger Delta zone of Nigeria face serious and incalculable risks since it impedes cultivation as well [46-49].
3.3. GIS Mapping and Spatial Analysis
The GIS analysis covers the graphic flash of spatial patterns highlighting production, land use, and the costs of seedlings used. In addition to that, are the differing pursuits representing spraying of chemicals and the agro-ecosystem dimension of the region vital in cassava land use activities in the various states and periods. From the characterizations of the indicators in space, including the variations, along with the output levels in Nigeria’s Lower South cassava hub. The information as communicated via geo-visual analytics in different scales and colors symbolize the changing paths of the sector. The capacity to visualize spatial-temporal evolution of the production activities at the swaths of vast agricultural lands notwithstanding. Applying GIS as the analytical tool, remains essential in capturing the state of cassava farmland use and the capacities in Nigeria’s Lower South in the march towards continual resurgence in the sector. The GIS mappings of the trends shows continuing dispersion and extension of cassava producing locales onto various parts of Lower Southern Nigeria. From the tempo of that dispersal along the Southern part of the nation. It is obvious that the harvesting of cassava products appears concentrated principally on portions of the map denoted colourfully under the textures of landuse and production from the South to the East sides of the zone. The spatial aspects of cassava land use activities not only exemplify the state and evolution of the subsector, but it offers a portrayal of the shifting patterns in space of the core indicators germane to the continual success of the crop in the zone over the years. To that effect, the extent of change pertaining to cassava farmland size and the production volume in red and blue colors from 2009 to 2011 indicates the emergence of Imo as the only area in the Southeast that stood out with increases in both cultivated area and output. This change occurred at rates fully different from the notable diffusion of outright declines for the group of other six states in the study area. Accordingly, based on the info contained in the map legend. The spatial distribution of those half a dozen states that saw full declines in land area and output, stretches from the west side consisting of Edo, Bayelsa to Akwa Ibom in the lower South with further presence in the central and northeast areas where another trio of Eastern states Anambra, Enugu and Ebonyi incurred losses, mostly in the double digits. Being the only exceptions in the process of change, the South-South states of Cross River, Delta and Rivers settled for mostly even split in the form of uptick in the percent of land areas under production and declines in cassava production (Figure 3).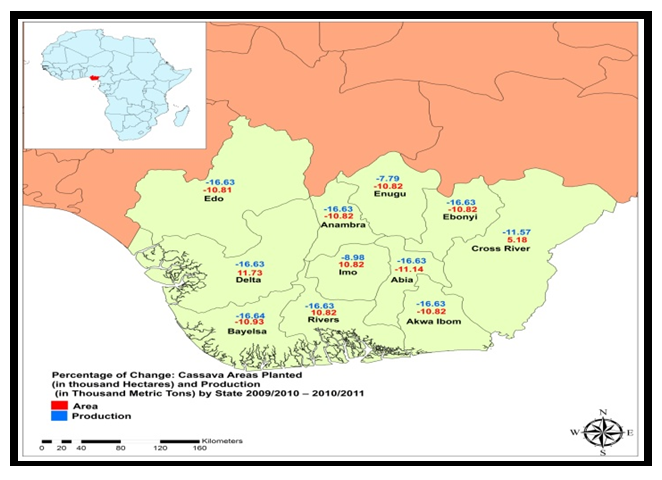 | Figure 3. Percentage of Change Cassava Plated Areas and Production, 2009/2011 |
The geographic analogy of the cassava cultivation area and the pace of production volumes among the states in the area clearly affirms the multiple thresholds in their activities. This involves Cross Rivers and Enugu along the Northern axis and southeast solely atop on the classification order, as the largest producers with more land areas devoted to cassava farming between 2009-2010. In the second ranking comes the neighboring Imo and Akwa Ibom out of the old Eastern Region, while Delta, Rivers, and Anambra close to the Lower south rounded out the listing among the third leading group of places where the size of cultivation and production of cassava reached appreciable levels all through 2009-2010. The fourth group of states under the spatial distribution metrics on cassava cultivation and output runs through the upper west and south or south-south sates of Edo and Bayelsa up to southeast states of Abia and Ebonyi. In these places, the values seemed relatively lower than the states in the first 3 categories of areas throughout the 2009 to 2010 periods (Figure 4).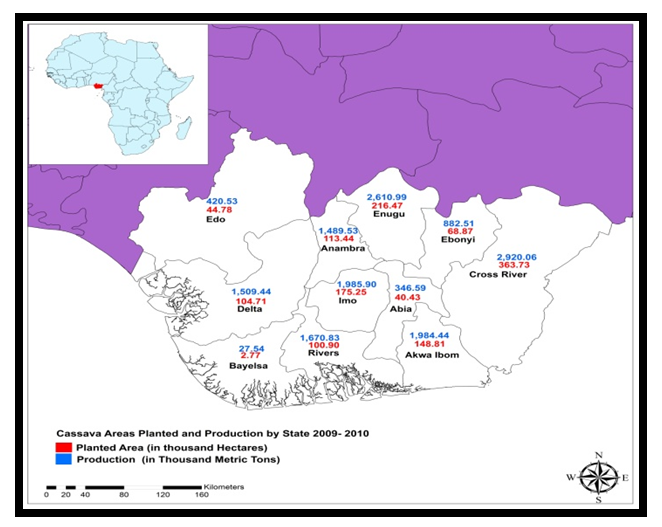 | Figure 4. The Distribution of Cassava Planted Areas and Production, 2009/2010 |
With the evolving patterns of cassava planted areas and output showing the emergence of Cross River in the Southeast corner of the map as the standalone leaders in all the categories far ahead of the others from 2010-2011 in terms of output and land size under cultivation. The same quartet of states in the defunct Eastern region made up of Enugu, Imo, and Rivers State and Akwa Ibom clearly closed out as the second most active areas in cassava production activities in the study area. While the neighboring states of Delta, Anambra and Ebonyi whose locations spans through the southwest part and Eastern region ranked third on the spatial listing with land areas, maintained noticeable averages in planted areas and varying levels of cassava output. Further along those lines, Edo, Bayelsa and Abia ranked fourth held the lowest cultivated land area and production levels relative to the activities in their respective states (Figure 5). Accordingly, the geographic summary of the overall production to some degree captured the levels with some of the dominant states represented under the very high category in green, followed by the high ones in light green areas of Ebonyi and Delta as the others in light purple held firm in Edo and Abia with Bayelsa in lower area represented in orange (Figure 6).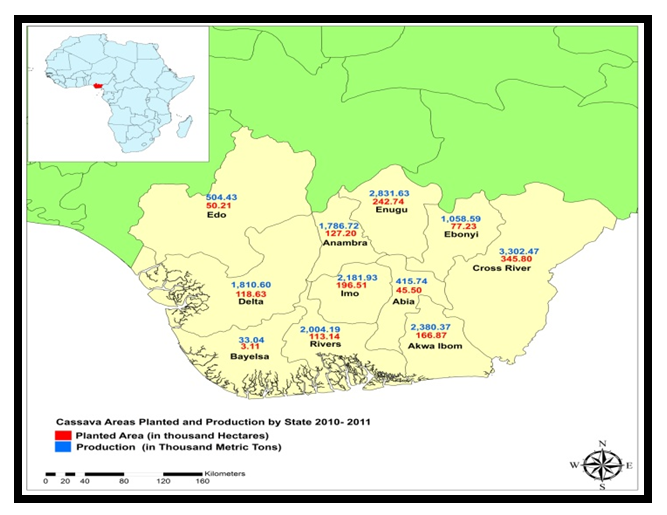 | Figure 5. The Distribution of Cassava Planted Areas and Production, 2010/2011 |
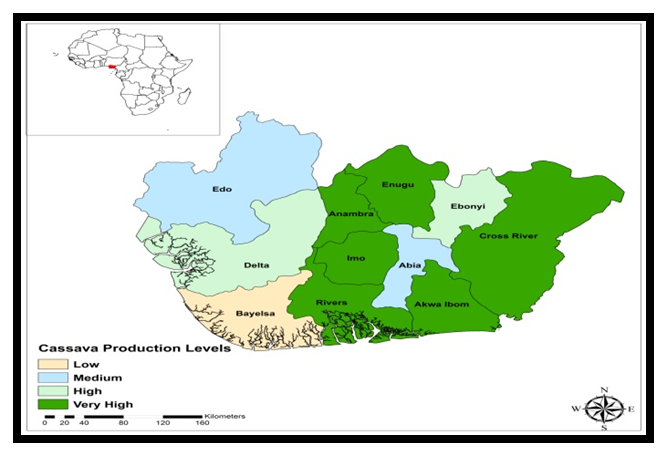 | Figure 6. Spatial Distribution of General Production Levels For Cassava |
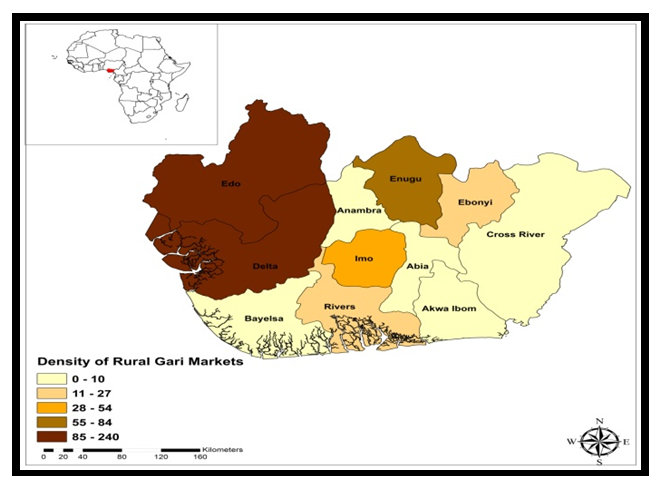
On the economic side, considering the place of seeds/ seedlings of cassava in the actual planting and production of the produce in all the states. Cross River and Anambra posted the most balanced rates of change. In other words, in both places, the percentages of change saw surges during 2006-2007 to 2008-2009. In the same periods, aside from the outright declines in Edo with instant spread into Bayelsa and Rivers in the South-South side under similar scales. In the group of 5 other states from Delta, Akwa Ibom, Enugu to Abia, Ebonyi and Imo, note that all of them experienced a mix of increments and declines during the two different periods of 2006-2007 to 2008-2009 (Figure 7). Further along comes additional economic forces shaping production activities and consumption patterns. The dispersal of spatial density of rural gari market reaffirms the significance of that factor with the very highest and high-density indices of 85-240 to 55-85 fully concentrated at former Bendel and Midwest states of Delta and Edo followed by slight dispersal onto Enugu state towards the northeast part of the map as Imo represented in the yellow spot in space held on to the market density medium index of 28-54. The group of 7 other states from Bayelsa to Cross River, Rivers to Ebonyi ended with lower indices of 01-10 to 11-27 as well as the highest on the list (Figure 8).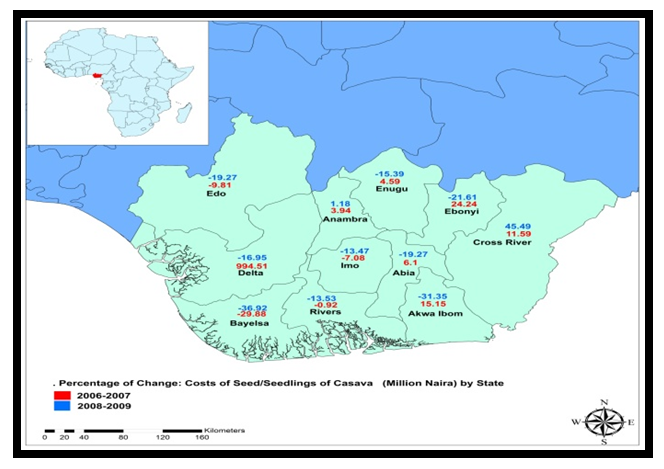 | Figure 7. Percentage of Change/Costs of Cassava Seeds |
 | Figure 8. The Density of Rural Gari Markets In The Lower South Zone |
Being an indication of the intensity of operations and the ecological risks involved in land use and production in the vast swaths of farm fields. The maps exemplify the distribution, rates and volumes of chemicals sprayed and the attendant liabilities to the ecology. The spatial distribution of the rates of change in the applied quantity of fertilizer among the areas in the Lower South axis of Nigeria shows the states in the left corner of the zone along the western frontiers most notably the northwest, lower south states of Edo, Delta and Bayelsa where the upticks in usage during 2007-2008 and 2008-2009 periods vacillated by over 2%, 5% plus and over 3%. Within the same periods, the other indications of increases in the percentage change in the use of fertilizer by states includes the surge at rates of 7.76% to 8.42% in the Lower Southeast for Rivers, as well as the identical insignificant gains in Akwa Ibom and Anambra. From there, comes a cluster of states in the central and the northeast from Imo, Abia, Enugu, Ebonyi and Cross River with concentration of single and double-digit rates of declines in fertilizer use. Of these, Ebonyi in the northeast part of the study area saw the highest declines at double digit levels than the other states in the zone in terms of fertilizer use between 2007-2008 and 2008-2009 (Figure 9).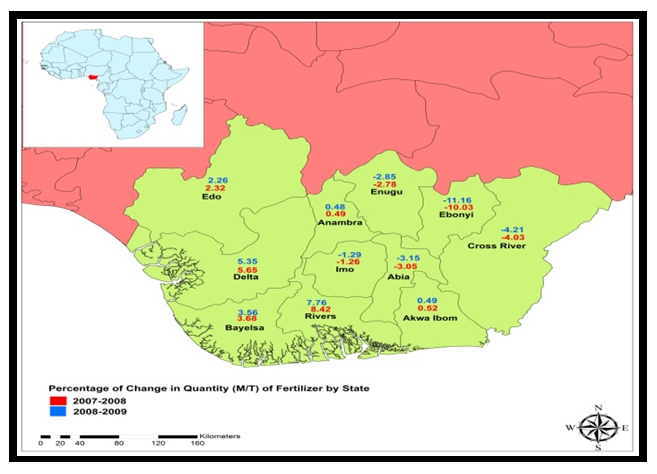 | Figure 9. Spatial Distribution of Percentage Change of Fertilizer Volume, 2007-2009 |
Looking at the geography of farm agrochemicals as distinguished in red and blue colors for insecticides and herbicides. The distribution patterns based on the accumulated percent of individual states usage in the study area during the fiscal year of 2010 highlights the consistency of Delta and Anambra states along the west and central spots of the map in posting double digit rates. This involves the treatment of farm areas with insecticides and herbicides even though the ratio of usage reached an all-time high of 42.54% and a low of 2.45% in Ebonyi state in 2010. Having said that, Delta state in the western axis of the map outpaced all its neighbors in every category by 34.5-26.97% followed by neighboring Anambra whose proportion in the distribution of the duo of farm chemicals clocked back-to-back double-digit rates of 16.74% to 10.35% (Figure 10). 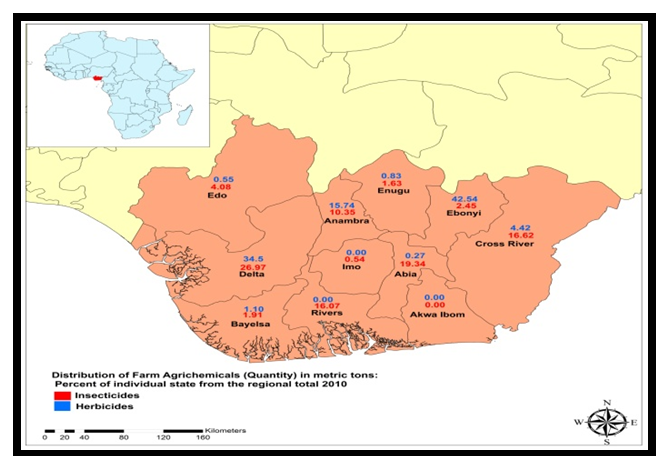 | Figure 10. Distribution of Agrochem Quantity Percentage of Individual State, 2010 |
Elsewhere in the zone, during the period 2010 again, the trio of old Eastern region states of Rivers, Abia, and Cross Rivers all maintained relatively double digits percentage levels in the use of insecticides as clusters of points in space associated with herbicides distributions gradually faded in values. Among the remaining states of Edo, Bayelsa, Enugu and Imo, the percent of the individual places relative to accumulated usage seemed quite miniscule coupled with zero activities in Akwa Ibom. In the actual distribution of these same agrochemicals by volume. It comes as no surprise on how Delta, Rivers, Anambra, and Cross Rivers stayed active in the procurements of these items to the management of their respective cassava farms in 2010. But the major worry therein remains the proximity of the coastal states to fragile marine ecosystem and the risks from effluent discharge over time. Added to that are the visible dispersal in the distribution of agrochemicals in the group of the other six states from the southwest axis in Edo, Bayelsa to Abia along the Southeast (Figure 11).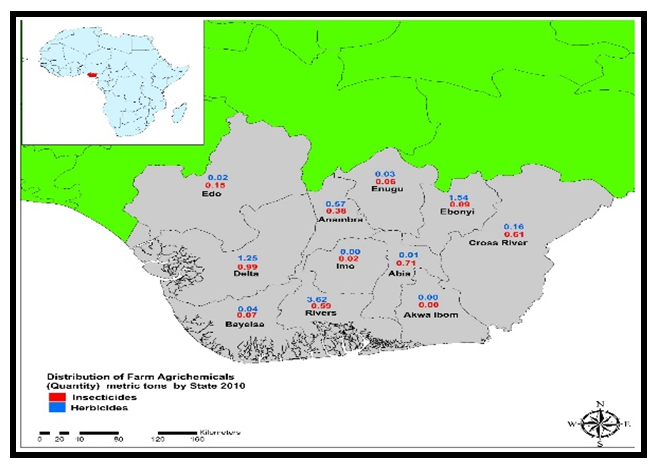 | Figure 11. Distribution of Agrochemicals By State, 2010 |
From the ecology of the zone, the agro-ecology and landcover parameters therein are not only in play, but they are in full color display buttressing their relevance in cassava production. The geographic analysis of the physical elements, of agroecological elements involves different shades and colors from green, red, light green, yellow and red dispersed relatively under different scales from the west, north, east to the south parts of the study area. With the low-lying coastal areas of Bayelsa, Rivers, parts of Delta and Akwa Ibom and parts or half of Cross Rivers under the yellow color grouped under tropic, warm and humid. The upper most states like Edo, Anambra, Enugu, Ebonyi, Abia and Imo fall under the tropic, warm and sub-humid parts of the ecozone coupled with a slight pocket of spots in upper Cross River in green color classified under the tropic cool/humid agroecological category of the map (Figure 12). 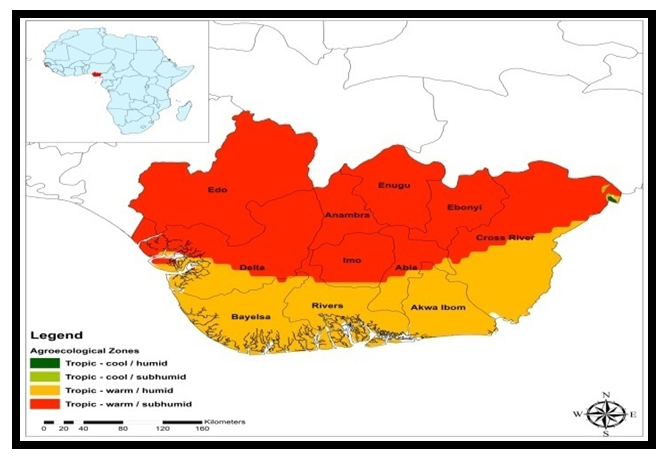 | Figure 12. The Geographic Distribution of Agro-ecozones In the Lower South |
With much of the landcover along the coast and neighboring inland mostly the broad leaf ever green forest, mangrove in blue/purple and pockets of cropland. Note a tapestry of features denoting wetlands, tree open, shrub, urban and paddy land in the map. Generally, as you move away from the coast, there begins to emerge clusters of tree open, cropland and other vegetation mosaic dispersed especially along the upper and central states of the study area. Added to that, are places classified under the category of bare area consolidated gravel rocks in pink germane to land use (Figure 13). 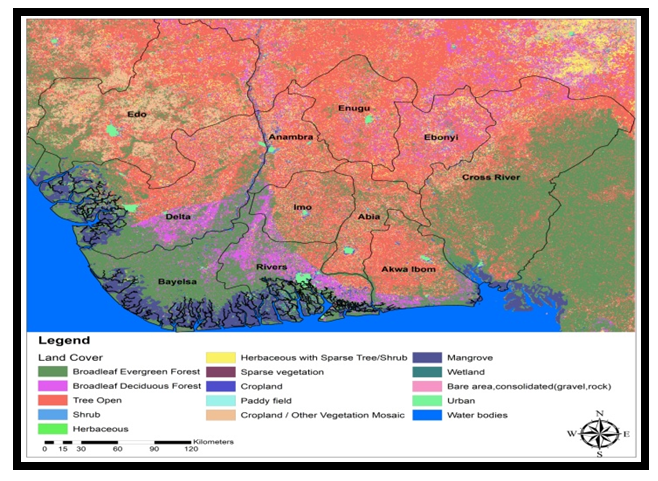 | Figure 13. Spatial Distribution The Land Cover Types In the Lower South |
3.4. Factors Driving Changing Groundnut Land Use
The fundamental factors responsible for the changing cassava landuse and production trends in Nigeria’s Lower South do not operate in a vacuum. They are linked to different elements located in the regional agricultural structure. This encompasses a host of policy, socio-economic, and physical (environmental) factors. These forces are described briefly in the paragraphs below.
3.4.1. Policy Elements, Infrastructure and Technology
The government’s involvement in the last 4 decades reflects moves by organizations in the subsector prompted by actions backing the manufacture, handling, and distribution of cassava. These encompasses government programmes like the National Accelerated Food Production Programme (NAFPP), Operation Feed the Nation (OFN), the Agricultural Development Projects (ADPs) and other initiatives. With a relatively well-developed market access infrastructure through improved processing technology and a well-organized internal market structure. The site of the International Institute for Tropical Agriculture (IITA) which runs central research base at Ibadan, has helped in driving innovations beneficial to the sub sector. Since the Institute carries out research focusing on releases of new species of tuber yields within the sub-Saharan African region, it has a major influence in cassava productivity. Out of a commitment towards self-reliance, the government advanced the consumption of cassava while limiting the importations of rice and wheat nationwide. Under a Federal Presidential Initiative in July 2002, the government directives sought a 5 million hectare increase in areas under cassava cultivation in the fiscal year 2010 at yearly output of 150 million tonnes with projected export revenues of U$5 billion. Under the government’s innovative roll out of cassava species fully enriched with Vitamin A nutrients. The Federal authorities in Nigeria then began a program to formalize the distribution of Vitamin A cassava types to about 1.8 million planters for adoption across the nation.
3.4.2. Socio- Economic Forces and Demography
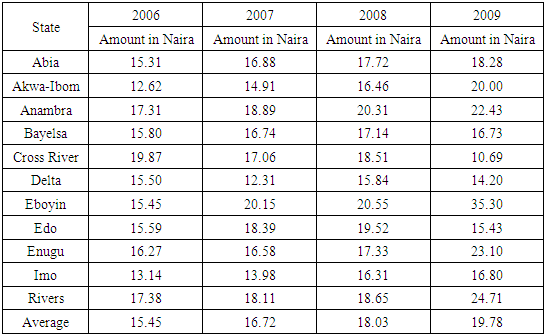
With the encroachment of city development onto the agricultural districts adjacent to peri-urban area, land under cassava face serious threats. While this results in the loss of extra earnings and migration out of the country sides lacking better quality of life amenities. The burden of such discomfort pushes more farmers in the peri-urban area to abandon cassava farming and engage in other enterprises as the declines in agricultural land intensifies. For that, the intensity of urbanization determines the downward trajectory of cassava production. Thus, the incidence of urban encroachment into the countryside does trigger forced migration of youths into cities in their search of greener pastures to the detriment of cassava farming. Such a trend forces remaining planters into giving up farming in the search for better opportunities instead of cassava cultivation due to loss of farmland. In as much as rapid pace of urban expansion shapes the plunging of cassava farming activities, changing demographics based on the aging of farmers in the rural areas is also to blame. Since the rapid migration of young folks into cities is resulting in the falling labour pool. The sub sector faces declining output in cassava capable of triggering food insecurity. This in turn affects the deficits in cultivated area and output.Seeing that the state of cassava production reached a sustainable level allowing Lower South growers to regularly partake in harvesting. Some of these farm operators often bear the brunt of big farmgate and transportation expenses of ( 15.45 to
  19.78) on the average. This occurs amidst the sorry state of the highways limiting supply and accessibility to markets and consumers (Table 6), despite exorbitant surge in the prices of seeds throughout lower South zone from
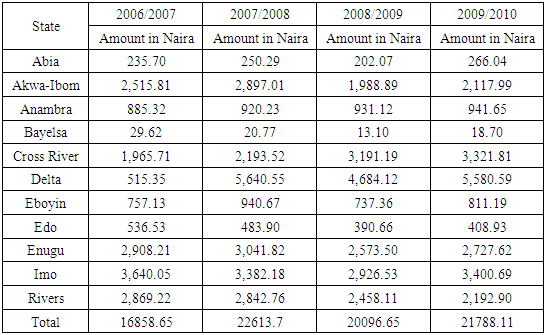
  16858.65, -
  22613.7 to
  20096.65,
  21788.11 (Table 7). This places a huge burden on the shoulders of community growers often forced to endure price volatility in absence of a strong safety net to temper sudden fiscal shocks whenever it sets in. Such situations have the capacity to take away land meant for cultivation to competing land uses given the surge in populations within the region. Meeting the requirements of a growing population and others afar from the zone and localities in the nation and the stresses triggered by the expansion of urbanization onto farm fields, to some degree left some damaging imprint on the region’s agro ecosystem.
 Table 6. Farm Gate Price by Crop and State In Naira For Cassava by State, 2006-2009
 |
| |
|
Table 7. Costs of Seed/Seedlings of Casava (Million Naira) by State, 2006-2010
 |
| |
|
3.4.3. Physical Environment, and Diseases
Given that the moist climate of the Lower South Ecozone and forest belts and land cover fully support the production of cassava across states in the growing seasons. The states in the Lower South share conducive topography and soils upon which the crop thrives. Clearly, the crop thrives abundantly in states located in the lower region as can been manifested from the output levels and the size of cultivated land areas therein compared to the other zones in the country. However, the capacity to produce and harvest cassava and its derivatives from gari to fufu depends highly on the propensity to pests and the diseases that are capable of influencing productivity at any cassava plantations and the actual returns. With some of the pests and diseases listed as cassava green mite and cassava bud necrosis, the spiralling whitefly and cassava anthracnose. Understand that regardless of the various composition of cassava derivatives from garri, fufu to caustic soda and others. Let no one ignore the risks posed to cassava from the attacks unleashed by the pests and diseases. The frequency of their outbreak on production within most cassava farms can shape the changes in land use and output over time as we saw in the study area. For that, very many pests and diseases have the lethal capacity to impact the time, labor and capital expended towards the cultivation and harvest of cassava tubers. They can also stop the farmers from profiting and reaping the benefits that accrue cassava cultivation activities in the zone.
3.5. Efforts and Initiatives
Seeing the privileged place of the of cassava production in the Lower South’ popular imagination, history, and culture as well as the prestigious ranking of Nigeria on the world stage as the prime source. Despite the brief neglect of the sector in 1960s and the present moves towards a revival. Several moves have been undertaken jointly through state actors and other backers to reclaim the rightful place of the crop in the past and enhance the growth of cassava industry in Nigeria’s Lower South region.
3.5.1. Moves Towards Sectorial Revival
Out of current concerns over the sector, the Federal Government remains bothered about Nigeria’s cassava output. This stems from current yield level of 10 metric tonnes per hectare deemed below government expectations. Even if the nation ranks high as the biggest cassava producer globally, it possesses the capability to be at 40MT per hectare. Accordingly, the cassava sub sector has endured serious impediments due to meagre harvests from the various varieties, inadequate and outdated farmhouse management techniques, and dwindling productivity. The others encompass limited use of existing tillable land and the lack of financial capital among small scale planters. These may be linked to improper policies, farming practices as well as harvesting methods. In response to these challenges, the Central Bank of Nigeria (CBN) stepped up with the needed funds and provided support to 15,000 farmers as part of the move to till over 15,000 hectares of cassava farmland in 19 states. This is also in line with moves to use the farming of 10 crops to generate 10 million jobs over a 5-year period.Other measures are also being taken presently to boost harvests and farmland size to drive the output of cassava nationwide. Part of these new approaches consists of efforts to enhance production under the auspices of the Cassava Growers Association. The group has been setting aside big lots of land in every Local Government Authority (LGA) with the intent of converting 1000 ha of fallow land for industrial cassava farming. Added to that are the growers group use of mechanical gears and fast-growing cassava types in promoting productivity. This involves requests for the harvests of 30 tonnes per ha as an anticipated goal. With the 547 LGAs slated for participation in the project, there are possibilities for any of the LGAs to cultivate 1000 ha of fast-growing cassava species as well. This will drive up output by 16.5 million tonnes at over 50% of the 2007 projected surge of 26 million tonnes. The International Institute of Tropical Agriculture (IITA) has participated significantly in the breeding of better cassava brands in the last several years. As such, the level of dispersion of those enhanced cassava production devices at different scales has been contributory. Part of that involves the use assessment census taker, overseeing community focus group discussion among cultivators along the Southeast zone of the nation. Such diffusion data on new cassava varieties, remains essential to the sector as a novelty which has not been undertaken to capture adopted techniques and patterns of dispersal at the local areas. While the findings do not assume to have all the required answers, rather it serves very useful purpose as a device vital for managers in disbursing assets efficiently. Also, since post-harvest deficit is always on the rise for cassava tubers given the poor storage facilities and the perishable nature of cassava and limited access to high-tech cassava processing devices. The Federal Institute of Industrial Research, Oshodi (FIIRO) has designed and tested a processing device vital for casava starch production in the sector. The design of such operable machinery stands as a game changer for managers and cassava production.
4. Discussion
The enquiry focused on the scope of cassava farmland use by analysing the state, trends, relating to structure and presence based on a range of related parameters like cassava cultivated areas, and production capacities throughout the Lower South zone. This also covered the states and the number of fluctuations therein based on increases and decreases in cassava land use indices and the issues. Another dimension to the analysis involves the description of connections amongst cassava land use, production activities, self-sufficiency in agriculture and the set of policy, socio-economic and ecological and biological elements. With all these manifested under various themes from institutional presence, urbanization, demography to the occasional outbreak of common plant diseases. The same evaluation covered changing costs in farm produce, growing use of fertilizers and agricultural-chemicals and potential contamination risks in a zone with vast network of lakes and rivers. From the outcome of the study, the state of cassava land base and usage in Nigeria’s Lower South region looks encouraging and complete with abundance ahead of other zones in the nation. The upsides based on array of derivatives, global market profile and the potentials, confers a broader appeal on the produce as a staple, despite the occasional risks presented by crop disease outbreaks and changing climate. Of considerable importance in all these is the massive presence of both high production volumes and cultivated land areas in quartet of former Eastern region states (Cross River, Enugu, Akwa Ibom and Imo) classified under the leading groupings and the others ranked in lower (second and third) tier classes solely on their individual performances across time. As major actors and no spectators in the market among their adjoining competitors, the lower tier states in both production and cultivated land size in the Lower South axis stayed equally remarkable also. Being in different ecological zones from coastal inland, to mangrove swamp, and lowland rain forest with proper soil conditions essential to cassava cultivation. In the evolution of Nigeria’s political economy, the timely turnaround mounted by cassava farming and the way it happened stands as one for the ages. Despite post-independence Nigeria’s obsession with rice and wheat, and cassava’s exclusion by the official farm policy assistance areas of priority. During the era of 1980s, in which the slump in oil price resulted in dismal revenue generation via export. The nation’s ban on farm imports like wheat by 1987-1991 under the policy, drove up cassava demand and production at triple digit rates between 1980-1990. This not only pushed the nation ahead in the global classification, but it also occupies important spot in the economy with an output of 33 TMT from 1999-2009. Thus, the Southern region’s position as global cassava hub stands as a testament of its place in countryside development. Aware of such capacities, and gaps in production due to underperformance. The central authorities set as their targets, the coverage of additional swats of large cultivable land as stimulus to the market. This reflects the activities of IITA, whose researchers perfected the art of breeding better cassava species at scopes deemed beneficial over the years. Under its commitment towards food security in the use of cassava while shunning rice and wheat imports. The government stepped up with novel promotion of edible cassava types totally supplemented with Vitamin A nutrients. In the process, the government initiated a scheme for over a million growers to adopt vitamin A rich cassava species across the country in 2012. To track the extent and form of cassava land use trends, output, changes in the core indicators and declines in cassava as a key export produce, the risks of environmental declines, and array of forces, together with current concerns. The paper used mixscale model of descriptive statistics and GIS with secondary data under the groups of socio-economic, physical, ecological, and agro-chemical indicators from percentage of change in cassava production to cultivated land area. Overall, the region being a key hub has shown immense capacity in cassava farming over the years beginning from the way it outpaced other zones in the country in 2000-2002 in production levels by averaging almost 44% of the national total. Although the geospatial mapping of the trends through GIS between 2000 to 2011 pinpointed the intensity and spread of casava farmland parameters into diverse states involved in production in the lower South zone. The rise in the use of agrochemicals, cassava effluents and wastes indicated the risks to the ecology of the region. Additionally, the variations in cassava farmland use never really happened in isolation. They emanated from various policy, socio-economic, demographic, and environmental and tech forces located in the larger agricultural structure. Building on the numerous advances shown in the enquiry to help managers assess issues encountered in cassava farming within the various states. The paper tendered solutions ranging from education, monitoring, and regular mapping using GIS and the design of regional cassava land resource information system with data on related indicators and interactive features tracking the state of the sector regionwide.
5. Conclusions
This study focused on the analysis of cassava farmland use under production, size, and the impacts on certain states in Nigeria’s lower South region with vital outcomes listed under the following headings: a) The Lower Southern zone has great potentials; b) cassava in abundance; c) changes evident in land use indicators; d) mix scale methods effective; e) changes prompted by various factors; f) environmental impacts evident.The essential part of this enquiry emanates through the capacity and richness of cassava along the Lower South zone. Because cassava thrives under diverse settings made up of biodiversity in damp tropical ecosystems along the Lower South better than other crops. The sub-sector never quite lost a bit, despite the origins elsewhere and the introduction into the tropics, given the suitability of the natural environments in the Lower South region. While this includes the presence of the critical bio-geoclimatic parameters like conducive temperature, soil, and climate, vital in the rising output. The fact that, many of the crop types are in several other states in Nigeria. The Lower Southern axis of the nation still retains ample domination over production and planting. Realizing the enviable importance in the evolution of Southern region’s political economy and occurrence of planting under 4 growing periods. The chief producers among the states in cassava crop, comprises of Cross River, Imo, Enugu, Anambra, Delta, and Rivers, Edo, and host of others. Unsurprisingly, the primacy of Nigeria’s Lower South in cassava production in comparison to the other zones seems further evident from its combined totals of more than 11,000,000-12,000,000 TMT by 2000 to 2002 ahead of the other regions. In underscoring these potentials, this study added a novel mode upon which the zone can build on to consolidate the continual dominance and production outlook in the industry and nation.The other important way to look at the intriguing outcome that came out of the study involves the extent and proportion of changes in cassava land use between 2008 to 2011. The ratio of change that emerged in the temporal contour, suggests recurrent glimpses of gains and declines. From the calibrated model, the size of cultivated land areas and production capacity rose in some years like 2008-2010 in the face of back-to-back losses for both indicators during the fiscal year 2009-2011 in much of Lower South’s cassava producing states in comparison to the other periods. By the fiscal years 2006-2008, levels of gains in cassava cultivated areas loomed so large, that it penetrated far deeper into in 9 states as only two of them posted decreases. With that being the case, a quartet of states from Akwa-Ibom to Ebonyi staked their claims by huge gains at 26.4%-31.5% and another set of five states accounted for mostly single digit increases individually. The only two losses of -12.00% to -3.34% that occurred were mostly in Edo and Rivers state parts of the region. Although the variations in casava output indicated a slightly identical split among the states at a ratio of 6 to 5 under the loss and gain columns. The biggest declines at - 45.14% to 22.67%-, -18.1% -16.8% held firm at Bayelsa, Edo, Imo, Rivers, and Anambra while others saw softer drops. Recognizing those variations and the rundown of the trends as a step forward in land use informatics, provided the viable pathways pertinent in the design of a regional cassava index and land information system.Utilizing descriptive statistics and GIS devices of the mixscale orientation as operating tools brought a better understanding of the assessment of cassava farming operations. The model remained effective in spotting the trends, elements, efforts, environmental effects, and variations. Accordingly, the use of descriptive statistics in that form emphasised the capacity of the systems to sort the scope of cassava output and fam areas. The other dimensions embody spots in space upon which the percentage of change in costs of cassava seedlings and spatial locations of the agro-ecological ecozones, and land cover types emerged. Additional graphical features also located the regional flows in liability footprints comprising of farm fertilizers and agrochemicals. From the utility in visual environmental informatics, and impact appraisal of cassava land use. The GIS proved ample upsides in indicating the sites and patterns of probable environmental threats and their dispersion. Underlining such challenges, helps move the stress in land management in areas deemed at risk of contamination to the centre stage of policy in places where dangers to the ecology are looming. In that way, the enquiry injected an environmental protection dimension. Keeping cassava planting states cognizant of such dangers as manifested in the research, diminishes the possibilities of eventual liabilities.Recognizing that the variation in cassava land farming depends on several elements encompassing policy, socio-economic, demography, physical environment, and latest tech innovations. The appalling policies in the late 1960s through 1970s involved outright rice and wheat subsidy through imports that were mostly detrimental to farming. But the reversal of fortunes during the decade of the 1980s prompted partly by the dip in Nigeria’s oil revenues and the federal government’s decision to ban rice and wheat imports, accelerated cassava production through rising demand and population. While this pushed productivity onto unprecedented levels with Nigeria ranked the number one producer globally in 2017. The elements located within the larger agricultural structure under the aegis of policy, the efforts of groups involved in the supply, research, and development augmented cassava production. Of these are national schemes like the Operation Feed the Nation (OFN) and the joint ventures with the International Institute of Tropical Agriculture (IITA) and others to boost output via new tech tools. In as much as the CBN provided incentives and capacity building under federal initiatives towards food security. The role of the IITA in enhancing consumer knowledge and awareness remained effective in promoting consumption and access. With Nigeria’s position as the number one producer predicated on topography, suitable soils, and climate. The climate of the Lower South categorized by sizable precipitation at yearly average volume of more than 4,000 mm in some spots reaffirms the correlation between high production pace and land use as the crop thrives in biodiversity heavy wet tropical ecosystem like the zone. The enquiry in affirming the essence of those forces, in the region’s cassava farm operations re-asserted their power in the sub-sector in a manner capable of influencing public discourse.Fundamentally, the impacts of cassava land use on Nigeria’s Lower South environment are obvious given the range of activities therein. Since cassava farming operations and the related key indices relevant to various stages of production, and processing generate impacts. The nascent adverse imprints like cassava mill effluents (CME), liquid waste, and odour nuisance constitutes massive hazards to the surrounding ecology through declines to surface water quality, air quality and public health. The fact that the risks from cassava effluents already threatens marine organisms such as fish stock and air quality. This attests to the gravity of the impacts on both natural and built environment in the cassava producing areas in the Lower South zone. This is compounded by the proliferation of fertilizer applications and agrochemicals use among producers across the states. Given the probability of interactions with ecological and chemical stressors and drivers of unwanted health ailments in the production process, the enquiry deserves a thumbs up in driving home these concerns. Despite the economic effects of jobs and contribution to the GDP. In raising current worries regarding the liabilities of cassava production in the policy arena. There are ample opportunities to elevate them in the public agenda among managers and those in the sector. The assumption is that major stakeholders will draw heavily out of this enquiry as producers become more aware of the place of best management practices over time.In that light, decision makers and scholars require speedy responses to essential queries out of this enquiry. The probable questions include: what form will cassava land use and production assume over time? Does the zone have the capacity to regularly monitor the proportion of agrochemical drift into the environment? How will the zone gain from the design of integrated digital regional cassava land use index? How will the region meet the current gaps in the supply of cassava powder and starch? In what ways will present plans to boost efficiency and output affect the ecosystem? Through these queries, there are ample possibilities to keep the sector focused on innovation given the region’s primacy in cassava land use and production approaches based on wise use of the ecosystem.
References
| [1] | Courage, Steve. (2016 December). Cassava Farming and Gari Processing Method in Nigeria. Africa Business. Online Available: https://www.africabusinessclassroom.com/cassava-farming-processing-nigeria/. |
| [2] | Finelib. (2017). Cassava Production In Nigeria and The Main Producing States. Online Available: http://985.so/kgex. |
| [3] | Wikipedia (2021). Cassava Production In Nigeria. Online Available: https://en.wikipedia.org/wiki/Cassava_production_in_Nigeria. |
| [4] | Isaac, Nkechi. (2021 March). Nigerian Farmers Welcome New Cassava Varieties. Online Available: http://985.so/kgea. |
| [5] | Food and Agriculture Organization. (2005). Cassava Development in Nigeria: Country Case Study Towards a Global Strategy for Cassava Development.: A Review of Cassava In Africa. Rome, IT: FAO UN. |
| [6] | Bankole, Evelyn. (2018 December). Cassava production in Nigeria by State. Legit. |
| [7] | Grow Intelligence. (2015 April). Cassava Production and Processing. |
| [8] | The Foundation for Partnership Initiatives in the Niger Delta PIND (2020 December). Mapping Cassava Clusters In Niger Delta States. Abuja: FCT NG, PIND. |
| [9] | Akinwumiju, Akinola S. (2020). Agro-Climato-Edaphic Zonation of Nigeria For a Cassava Cultivar Using GIS-Based Analysis of Data from 1961 to 2017. Scientific Reports: 10: 1259. |
| [10] | Umazi (2020). Taping Into Nigerians Cassava Production Potential. Online Available: https://umaizi.com/tapping-into-nigerias-cassava-production-potential/. |
| [11] | Adeniji, A.A. (2005). Cassava Development in Nigeria. Abuja: FCT NG. Department of Agriculture Federal Ministry of Agriculture and Natural Resources Nigeria. |
| [12] | The Foundation for Partnership Initiatives in the Niger Delta (PIND). (2022). Cassava Value Chain Project. Abuja, Abuja: FCT NG, PIND. Online Available: https://pindfoundation.org/project/cassava-value-chain-project/. |
| [13] | Merem, EC. (2022, February). Assessing Cassava Land Use Trends In Nigeria’s Lower South Region. 31st Joint Conference of National Association of African American Studies (NAAAS). Dallas, TX. February 16, 2022. |
| [14] | USAID (2013 September). Cassava Online Available: https://Nigeriamarkets.org/index.php?option=.com. |
| [15] | International Potato Center and International Institute of Tropical Agriculture (1992). Cassava. Ibadan: Oyo. St NGN.. IITA. |
| [16] | Oruonye E.D. (2021). Cassava Value Chain and Food Security Issues in Nigeria: A Case Study of IFAD-VCDP Intervention in Taraba State. GSC Advanced Research and Reviews. 06: 03: 019-028. |
| [17] | Olutosin A Otekunrin (2019 August). Cassava, a 21st Century Staple Crop: How Can Nigeria Harness Its Enormous Trade Potentials? ACTA Scientific Agriculture. 3:8. |
| [18] | IDH. (2020). The Sustainable Trade Initiative. Utrecht The Netherlands: IDH. |
| [19] | Aboajah, F.N. (2018 Mar-Apr). Determinants of Cassava Production in Benue State, Nigeria. International Journal of Environment, Agriculture and Biotechnology (IJEAB). 3:2. |
| [20] | Ogunyinka, Ola. (2020 January-June). Analysis of Cassava Production and Processing By Various Groups in Support of Cassava Value Chain in the South West of Nigeria. ISABB Journal of Food and Agricultural Sciences. 9:1:11-19. |
| [21] | Izah, S.C. (2018). Impacts of Cassava Mill Effluents in Nigeria. Journal of Plant and Ecology. 1: 1-14. |
| [22] | Premium Times (October 2020). Price of Garri Soars In Enugu Markets. Premium Times. |
| [23] | Okoli E.N. (2021). Analysis of Factors Influencing Cassava Exports in Nigeria. Nsukka: University of Nigeria, Department of Agricultural Economics, University of Nigeria. |
| [24] | Esan, Bolaji. (October 2020). Harnessing the Economic Potential of Cassava production in Nigeria. Online Available: http://985.so/kgeu. |
| [25] | New Agency of Nigeria. (2021 March). Anambra Government Pledges More Support to Cassava, Rice, Farmers. NAN. |
| [26] | Southern Region Merem, E. C. (2017). Assessing ecosystem liabilities of oil and gas activities in southern Nigeria. Public Health Research. 7: 1: 3-26. |
| [27] | Merem, E. C. (2020). Exploring Cocoa Farm Landuse Trends in The West African Region. International Journal of Agriculture and Forestry. 10:1: 19-39. |
| [28] | Merem, E. C. (2021). The Assessment of China’s Scramble for Natural Resources Extraction in Africa, World Environment. 11: 1: 9-25. |
| [29] | Merem, E. C. (2021). The Regional Assessment of Groundnut Farmland Use in Northern Nigeria, International Journal of Food Science and Nutrition Engineering. 11: 1: 1-19. |
| [30] | Merem, E. C. (2019). Analyzing the Tragedy of Illegal Fishing on the West African Coastal Region. International Journal of Food Science and Nutrition Engineering. 9:1: 1-15. |
| [31] | Merem, E. C. (2020, February). The Analysis of Palm Oil Production and Land Use In Nigeria’s Lower South Region. 29th Joint Conference of National Association of African American Studies (NAAAS). Dallas, TX. |
| [32] | Merem, E. C. (2020). Appraising the Changing Trends In Oil Palm Farming in Nigeria’s Lower South Region. International Journal of Ecosystem. 10:1:1-22. |
| [33] | Iyayi, F. (2004). An Integrated Approach to Development In the Niger Delta. Lagos: Nigeria The Centre for Democracy and Development (CDD). |
| [34] | FAO. (2004). The Global Cassava Development Strategy A Cassava Industrial Revolution in Nigeria. The potential for a New Industrial Crop. Rome, Italy: UN Food and agriculture organization of the United Nations. |
| [35] | Akano, Biodun. (2020 November). Nigeria: CBN Intervention in Cassava Production. The Vanguard. |
| [36] | Simpa, James. (2014). Technical Efficiency of Smallholder Cassava Farmers in Selected Local Government Areas In Kogi State. Nigeria. Nasarawa: Nigeria, Department of Agricultural Technology, The Federal Polytechnic. |
| [37] | Ikuemonisan, Edamisan, Stephen. (2020). Cassava production in Nigeria: trends, instability, and decomposition analysis (1970–2018). Heliyon. 6:10. |
| [38] | Merem, E. C. (2019). Regional Assessment of Climate Change Hazards in Southern Nigeria with GIS. Journal of Safety Engineering, 8:1: 9-27. |
| [39] | Merem, E. C. (2018). Appraising Variations In Climate Change Parameters Along The Lower West African Region. Journal of Safety Engineering. 7:1: 1-19. |
| [40] | Merem, E. C. (2019b). Analyzing Land Use and Change Detection in Eastern Nigeria Using GIS and Remote Sensing. American Journal of Geographic Information System. 8:2: 103-117. |
| [41] | Merem, E. C. (2017). Analyzing rice production issues in Niger state area of Nigeria’s middle belt. Food and Public Health. 7:1: 7-22. |
| [42] | Merem, E. C. (2012). Using GIS to analyze the changing agricultural landscape of southern Louisiana. The National Water Quality Association Conference NWAQC, Portland, OR, April 2012. |
| [43] | Kolawole, O. P (2014). Cassava Processing and the Environmental Effect. The 4th World Sustainability Forum. |
| [44] | Jackson, B A (2013). Cassava: A Potential Crop for Industrial Raw Material in Nigeria. International Journal of Life Science. 3:3:105-112. |
| [45] | Ohimain, E. I. (2013). Biowastes Generation By Small Scale Cassava Processing Centres In Wilberforce Island. Bayelsa State, Nigeria. Greener Journal of Environmental Management and Public Safety. 2:1: 51-59. |
| [46] | Ohimain. E. I (2014). The prospects and challenges of cassava inclusion in wheat bread policy in Nigeria. International Journal of Science, Technology and Society 2:1: 6-17. |
| [47] | Elijah, A. I. (2014). Molecular Characterization and Potential of Bacterial Species Associated with Cassava Waste. Nigerian Food Journal 32:2: 56-65. |
| [48] | Izah, S.C. (2017). Assessment of Heavy Metal In Cassava Mill Effluent Contaminated Soil In a Rural Community In The Niger Delta Region of Nigeria. EC Pharmacology and Toxicology 4:5: 186-201. |
| [49] | Bassey, S.E. (2017). Assessment of Pollution Load Indices of Heavy Metals In Cassava Mill Effluents Contaminated Soil: A Case Study of Small-Scale Cassava Processing Mills In a Rural Community of The Niger Delta region of Nigeria. Bioscience Methods 8:1: 1-17. |

 Abstract
 Reference
 Full-Text PDF
 Full-text HTML