-
Paper Information
- Paper Submission
-
Journal Information
- About This Journal
- Editorial Board
- Current Issue
- Archive
- Author Guidelines
- Contact Us
International Journal of Food Science and Nutrition Engineering
p-ISSN: 2166-5168 e-ISSN: 2166-5192
2021; 11(2): 43-51
doi:10.5923/j.food.20211102.02
Received: Aug. 23, 2021; Accepted: Sep. 6, 2021; Published: Sep. 15, 2021

Dietary Supplement Use and Dietary Intake among Adults in Westlands Constituency, Kenya
Nomfundo Dlamini1, Angela A. Andago1, Sophia Ngala1, Paul Junior2
1University of Nairobi, Department Food Science, Nutrition and Technology, Nairobi, Kenya
2University of Witwatersrand, Chemistry Department, Johannesburg, South Africa
Correspondence to: Nomfundo Dlamini, University of Nairobi, Department Food Science, Nutrition and Technology, Nairobi, Kenya.
| Email: |  |
Copyright © 2021 The Author(s). Published by Scientific & Academic Publishing.
This work is licensed under the Creative Commons Attribution International License (CC BY).
http://creativecommons.org/licenses/by/4.0/

The aim of the present study was to determine the nutritional practices of adult dietary supplement users and non-users in the Westlands constituency, Nairobi County. The comparison of food consumption data was obtained using a single 24-hour dietary recall and food frequency questionnaire that was administered at the time of the harvest season (November 2019). Of the 139 adults who took part in the study, 14.4% (n= 20) took dietary supplements. Multivitamins were the common and widely used dietary supplements of 70% of dietary supplements. The main reason a majority of women took supplements was largely due to anaemia or Osteomalacia. In, contrast, the men who used supplements in this study wanted to alter the structure of the body (muscle hypertrophy), which led to the use of creatine and whey protein supplements. In contrast to Bennett’s Law, the nutritional assessment showed that 100% of the adults consumed foods belonging to the food group grains, roots, plantains and tubers. Eggs were consumed sparingly in this study and this was only by the proportion (25%) of men. The second largest group of foods consumed by 62.5% of adults was other fruits and vegetables. The average dietary diversity score given to adults in the Westlands constituency was low (3.09±1.201) and no adult scored high for dietary diversity score (6-7 food groups consumed). However, the values of nutritional diversity between dietary supplement consumers and non-consumers were not statistically significant (X2 /Likelihood ratio= 1.238, df= 1, p= 0.338). The average daily intake of calcium (mg) 134.341±103.253, folic acid (µg) 117.056±91.895 and vitamin C (mg) 34.953±41.057 were less than 50% of the recommended daily dose. While, the average daily intake of iron (mg) 8.034±5.728, magnesium (mg) 218.078±162.244 and vitamin E (mg) 10.253±12.375 was over 50% of the recommended daily dose. The nutrient uptake assessment showed that, with the exception of vitamin E, none of the adults reached the recommended daily allowance for the selected nutrients. However, the nutrient uptake for the supplement consumers in this study was slightly higher than that of the non-supplement consumers. Overall, a low prevalence of dietary supplement use and poor eating habits were observed in this study. This makes the study participants susceptible to micronutrient diseases. Therefore, public awareness of supplement use and the effects of micronutrient deficiencies due to poor eating habits are imperative. As a result, health professionals and nutritionists play a critical role in educating the general public about the importance of using nutritional supplements properly and in educating them about cost-effective ways to transition to healthier diets for better health outcomes.
Keywords: Dietary supplements, Calcium, Iron, Folic acid, Magnesium, Vitamin C and E, Kenya
Cite this paper: Nomfundo Dlamini, Angela A. Andago, Sophia Ngala, Paul Junior, Dietary Supplement Use and Dietary Intake among Adults in Westlands Constituency, Kenya, International Journal of Food Science and Nutrition Engineering, Vol. 11 No. 2, 2021, pp. 43-51. doi: 10.5923/j.food.20211102.02.
Article Outline
1. Introduction
- Before the era of globalization, most people’s diet included seafood and plant based foods, which were gathered. Hunters then contributed meat products and this was the diet of most people until 10,000 BC. The development of livestock and agriculture introduced grains and more meat into the diet [7]. At that time, little was known about knowledge on macronutrients and micronutrients and their function in human nutrition. Every day, the diet of different people of different age groups was supplemented by local cultural wisdom in order to prevent nutrient deficiencies. The study of the relationship between food, nutrition health and disease began in 1749 by Dr. James Lind who discovered that eating citrus fruits cured scurvy because they were high in vitamin C content [19]. Later in the years, the scientific community became interested in the potential of dietary supplements and initiated numerous research projects in the 1980s [12]. Today, the development of degenerative diseases in the population through the consumption of low calorie diets offers more opportunities for the nutraceutical industry to penetrate the world market [24].The dietary supplement market is a lifestyle driven industry driven by wellness and a healthy lifestyle of the population. The word nutraceutical was derived from Nutrition pharmaceutical in 1989 by the founder and chairman of the Foundation for Innovation in Medicine (FIM) named Stephen Defelice MD of Nutrition Pharmaceutical [15]. The term itself (nutraceutical) refers to anything that is a food or a component of food that offers medicinal or health benefits [22]. The various compounds listed as nutraceuticals range from nutritional supplements to specific genetically modified diets to isolated nutrients [10]. In the African context, South Africa and Nigeria are the leading front runners in the nutraceutical market respectively [23]. With other African countries such as Kenya, the trends towards healthy living, wellness and fitness are catching up, driving nutritional supplements upwards. Millions of people in Kenya do not have adequate access to a nutritious and varied diet. Therefore, initiatives that provide dietary supplements and fortified food directly to vulnerable populations target hidden hunger and remain essential services in the country [12]. Kenya’s population is slowly catching up with other countries in the consumption of dietary supplements. However, this is currently a common practice among gym users and athletes [5].Like other African countries, Kenya is experiencing rapid urbanization and changing eating habits, accompanied by higher levels of obesity and diet-related non-communicable diseases, especially among urban dwellers and mostly women in particular [16]. For that reason, one of the most notable effects of urbanization and economic growth in nutrition has been a shift from traditional African dietary patterns to more westernized diets, including the use of dietary supplements [11]. Although studies on the benefits of dietary supplements have increased worldwide, population studies of consumers are limited in Kenya [1]. Previous studies have indicated that there is a link between long-term use of dietary supplements and the occurrence of certain lifestyle diseases such as obesity and chronic diseases [24]. Therefore, extensive research is needed to find out the relationship between supplement use, food intake, and the morbidity rate. Recent studies have shown that the majority of supplement users; often prescribe dietary supplements themselves without consulting medical experts, which in some cases leads to fatal accidents due to the use of counterfeit products available on the market [27]. However, data on the knowledge and practices of dietary supplements users in Kenya is still very limited in Kenya as most of the data available comes from commercial market research that focuses primarily on athletes rather than the general population, for marketing purposes rather than consumer health surveys [29]. Therefore, it is important to apply research methods to identify problems related to long-term use of dietary supplements and the morbidity status in the population. In South and West Africa, the popularity of nutritional supplements in the nutraceutical market has increased aggressively due to the rigorous media advertising and the general belief that these substances have no side effects, leading to a need for continuous monitoring of the dietary supplement industry for consumer safety guarantee. Therefore, population based studies of dietary intake practices and dietary supplement use will be used to estimate total exposures to bioactive compounds that may be associated with adverse health conditions [17].
2. Materials and Methods
- The cross-sectional comparative study was conducted in the Westlands constituency, Nairobi County, Kenya among adults aged 18 to 64 years. Food consumption data were collected using a single 24-hour dietary recall and food frequency questionnaire in the harvest season (November 2019). The dietary diversity scores (DDS) were derived based on 7 food groups with a minimum intake threshold of 0-10g per food group respectively. A cut-off for DDS ≤4 was established to indicate adequate micronutrient intake.A semi-structured questionnaire was adopted from Wachira and modified in order to collect detailed qualitative and quantitative data for comparisons on dietary supplement use among the study participants [31]. The practice of dietary supplement use examined the types of dietary supplements used by the adults over past 12 months; Prescription type and source of the dietary supplements. The comparison was made between the 20 adults who consumed supplements and 119 adults who did not consume any supplements. The data was exported from Open Data Kit (ODK) to SPSS in an excel format. Nutri survey software was used to compute the selected nutrient intakes of the adults in comparison with the daily recommended daily allowance. The Statistical Package for Social Sciences (SPSS Inc. version 20) was used for data analysis. Descriptive statistics (frequencies, means, medians, percentages and standard deviations) were used to analyse data for socio demographic and socio economic variables. An independent t-test was computed at p=0.05 level of significance to test for the difference in the mean of different variables. Chi square/Likelihood ratio analysis was computed at p=0.05 level of significance for dietary supplement practices between the groups.
3. Findings
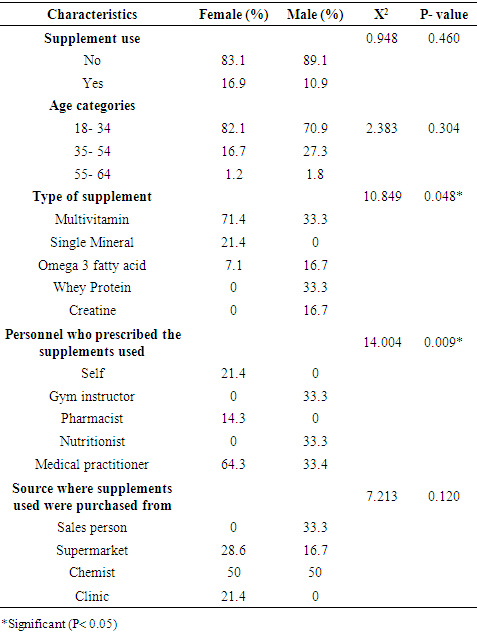
- Supplement use and the distribution of the type of dietary supplements used by the adults in Westlands constituency grouped by gender.Only 14.4% of the study population stated that they had taken dietary supplements in the past 12 months (Table 1). Around 70% of the total population of dietary supplement consumers were female, mostly in the 18-34 age groups.
|
|
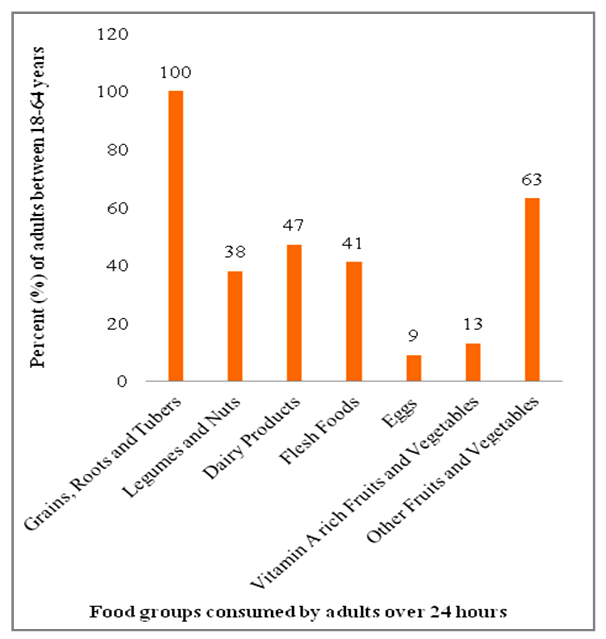 | Figure 1. Distribution of the seven food groups consumed by adults between the ages 18-64 in Westlands constituency |
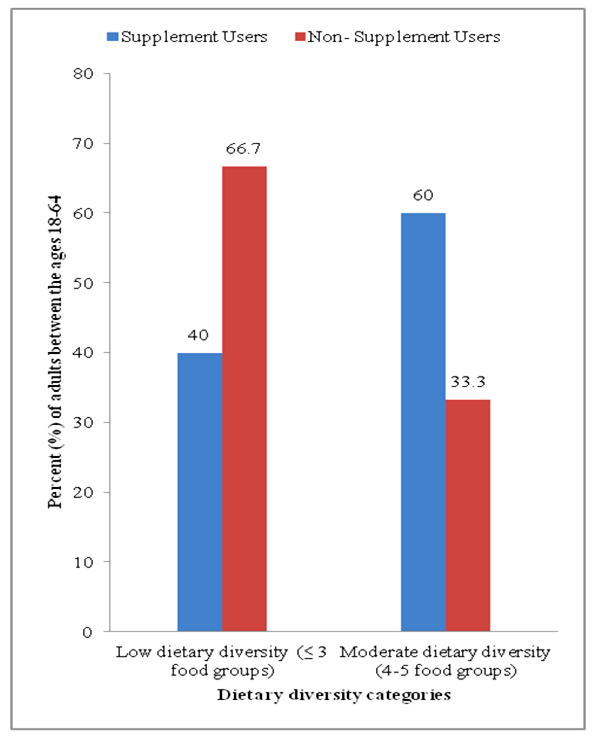 | Figure 2. Dietary diversity scores of the adults in Westlands constituency grouped by supplement use |
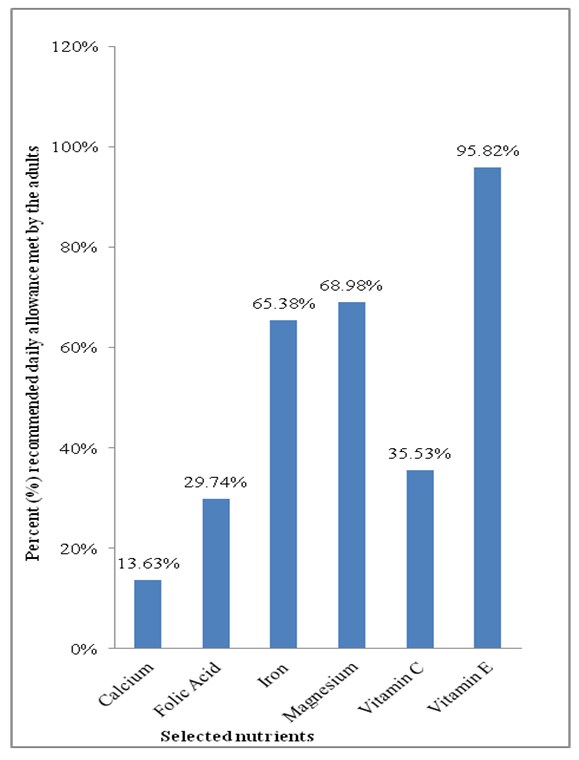 | Figure 3. Selected nutrient daily intake of adults in Westlands constituency |
|
4. Discussion
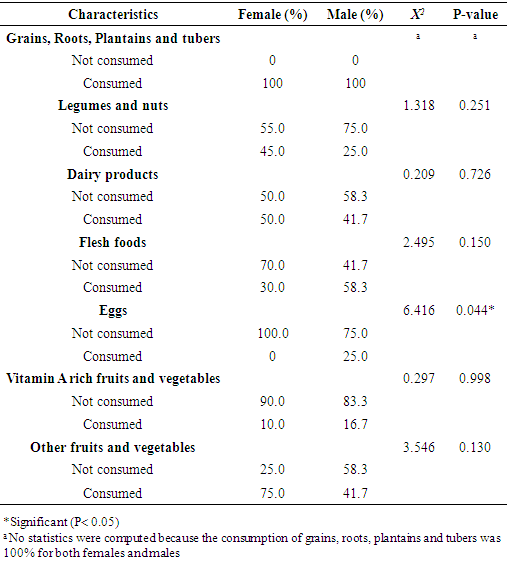
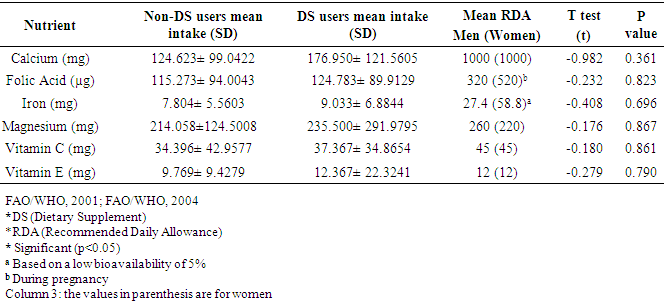
- Supplement use and the distribution of the type of dietary supplements used by the adults in Westlands constituency grouped by gender.A low prevalence of dietary supplement consumption was found in the study population. The most commonly used supplements were multivitamins with the intention of reducing fatigue, improving appetite, and improving brain and heart health. Multivitamins are reported to have many health benefits, including acting as coenzymes and cofactors to enzymatize various enzyme systems, tooth and bone formation, tissue maintenance, aiding in the regulation and coordination of most bodily functions, and other physiological and biochemical functions in the body [4]. In pparticular, the youth were the main consumers of dietary supplements compared to older adults. The main reason the women used multivitamins was due to an underlying health issue compared to the men who used creatine and whey protein supplements for non-medicinal reasons. The main reason men used supplements were to reduce fatigue and increase muscle hypertrophy. In contrast, the reason for using supplements in the females was for heme synthesis. It has been shown that providing multiple micronutrients can be more effective in improving maternal outcomes than taking Iron/folic acid supplements alone in pregnant women [32]. As a result, the World Health Organization may need to revise the Prenatal Care Guidelines (ANC). Similar results have been reported in adult outpatients receiving medical assistance at a referral hospital in Kericho County, Kenya [5]. Over 50% of the adults were taking nutritional supplements that were prescribed by a doctor for an existing illness. However, multivitamins were the least type of supplement used in their study, in contrast to this study where multivitamins were the most commonly consumed. However, calcium (single mineral) and vitamin D (single vitamin) were the most commonly consumed supplements in their study. A similar concern was noted that most of the supplement users are unaware of the function of the supplements used in the body and therefore the urgency of educating them.The study review showed that the study participants’ use of omega- 3 fatty acids was intended to improve brain and heart health. Other researchers confirm the same views; that the regular intake of omega-3 acids (alpha-linolenic acid) relatively reduces the incidence of cardiovascular diseases and the associated mortality [13]. However, the results are associated with high- income countries. This implies that the effect may not be the same in the African context, especially in Kenya if there is a difference in the initial uptake. Interventions should aim to ensure that all communities have access to affordable local foods that are good sources of omega 3 fatty acids (fish, nuts and seeds).Anaemia is associated with high maternal mortality rates in women of child bearing age [4]. The implementation of the programme to distribute iron/folic acid tablets to pregnant women in various parts of the country is therefore successful. However, there is still a need for interventions that increases the effectiveness of this programme by targeting behavioral changes and influencing the consumption of a varied diet, including local fruits and vegetables, in the urban population. Especially foods that are rich in iron and vitamin B12. Further studies have shown that hidden hunger (micronutrient deficiency) is one of the pressures that paralyzes the health system in Kenya due to the poor dietary diversity of the population in urban areas.According to a South African study, the prevalence of dietary supplement use among university students was 42% and the reasons for using dietary supplements were to improve physical health, body conditioning, dietary reasons, and increase energy [30]. The main reason for adult use of dietary supplements in Italy is also related to increase awareness of the importance of healthy living in learned communities and due to the evidence that dietary supplement use is generally viewed as an act of awareness regarding health issues [29]. The study results were a direct contrast because although the majority of the dietary supplements users in this study were graduates/diplomas, literacy rates did not affect dietary supplement use in this study as more participants were using dietary supplements because of an underlying health problem.Dietary intake practices of adults between 18-64 years in Westlands constituency, KenyaOne of the notable effects of globalization on the diet was the change in diet of the population in Africa. As more and more people eat a diet high in sugar and fat, food systems are evolving towards western cuisine, as the results of this study show. Because of this, concerns about food security are shifting from food availability to good quality nutrition. This is an issue because Kenya Health Policy (2012-2030), does not include the management of overeating (either through food intake or supplementation) as one of the most effective nutritional interventions. This indicates the need for interventions that respond to the current diet changes in Kenya. Most of the study participants did not have breakfast and those who did mostly drank mixed tea/ coffee. The supplement users got most of their daily nutrients from lunch, while the non-supplement users got most of their daily nutrient intakes from dinner. Dietary supplement users had slightly higher nutrient intakes than those who did not use dietary supplements. However, both groups consumed diets that consisted mostly of cereals and a few selections from the other food groups. As a result, both groups failed to meet their recommended daily nutritional intake. The variability between the two groups was likely due to the addition of nutritional supplements to the diet.The results of this study are in direct contrast to Bennett’s Law which implies that improvements in economic stability and urbanization lead to a decrease in grain consumption (starch) in the population [11]. As stated, all study participants in this study consumed grains, roots, tubers and plantains. In contrast, the consumption of eggs, fruits and vegetables rich in vitamin A, meat products and dairy products decreased. This is a compelling case which reflecting that Kenya is undergoing a diet change marked by the increase in the consumption of empty calories from highly refined foods high in fats and sugars, but less of proteinaceous foods (especially those of animal origin). This transition manifests an increase in the incidence of obesity and cardiovascular diseases among the urban work force [6]. Over 70% of total patient intake in Kenya health systems is somewhat related to cardiovascular diseases [20]. Future research should focus on determining whether work patterns and comfort affect the nutritional practices of the population in Kenya [14]. As non-formal grocery stores (vendors), they sold nutritious foods compared to formal outlets. However, more people were still buying low-quality, high-energy food that was being sold in official outlets due to safety concerns with the food being sold by the vendors. This indicates a need for immediate nutrition-sensitive interventions aimed at informing street vendors about advanced food preparation demonstrations with an emphasis on food safety, easier access to healthy food in the work. In accordance with the National Guidelines for Healthy Eating and Physical Activity, promoting healthy eating at work and at home must be a priority. This can be implemented through the introduction of sales taxes on empty calorie foods (junk food) by the government. In this study, diet and lifestyle changes in the population were heavily influenced by the proliferation of fast food franchises which encourages changes in eating patterns. However, a majority of the study participants consumed low dietary variety diets purchased in hotels versus home-cooked meals due to the convenience and accessibility. In India, the diet changes have led to an increase in the consumption of non-grain foods. An increase in the income of the population was associated with the consumption of a varied diet. Even if much of the influences of the kitchen are still westernized [26]. Only 34% of the population in urban areas consume indigenous foods (especially leafy vegetables such as cowpea leaves, spider plant, jute, pumpkin leaves, Bacella alba, amaranthus, crotolaria and black night shade) [18]. The biggest challenges which resulted in low consumption were the cost, limited amount of time available and knowing how to cook these vegetables. Wild foods are good sources of micronutrients and an opportunity to improve the functioning of the health system, but they are under utilized in Kenya [28]. Therefore, relevant stakeholders should work towards creating an environment for easy transport and handling of African leafy vegetables in urban areas as they are good sources of antioxidants, vitamins and minerals. The problem could be that seasonality and weather shocks endanger the reliance on local fruits and vegetables to diversify diets in developing countries [33]. As a result micronutrient deficiencies of iron, folic acid, vitamin A and calcium still remain of great concern in developing countries. Therefore, improved African seed varieties that can withstand weather shocks should be grown in urban and peri urban areas to improve market access in those areas.The study demonstrated that the dietary diversity scores varied between dietary supplement users and those who did not use dietary supplements. The food groups most consumed by adults between the ages of 18 and 64 years in the Westlands constituency included cereals, roots, plantains and tubers; other fruits and vegetables; Dairy products; meat dishes; Legumes and nuts; Fruits and vegetables rich in vitamin A and finally eggs (from the most consumed to the least consumed). The food group of grains, roots, plantains and tubers food group was consumed by all adults. However, the diet consisted mainly of highly refined starches. Rice was consumed by most adults in this study compared to the Kenyan staple food (maize). In this study, only the males had eggs. The consumption of flesh foods, eggs and dairy products was very low in this study, which made the adults susceptible to vitamin B12 deficiency. This increases the incidence of pernicious anaemia (an auto immune disease characterized by the degeneration of the spinal cord). Hence, nutritional campaigns aimed at disseminating information about nutritional supplements and improved diets. The focus on improved nutrition should be on campaigns promoting the intake of eggs, vitamin A-rich local fruits and vegetables as the consumption rates of these food groups in this study were below 14 percent. A large proportion of the urban population consumes high- energy dense foods because they are readily available, affordable, easy to prepare and, for most, a delicacy. Most people in Nairobi purchase their food from hotels and vendors [25]. For the most part, these foods are affordable less nutritious and accessible, but poorly hygienic. In this study, the dietary supplement users had servings only from the following food groups; cereals, legumes, vegetables and dairy products (ranked from the most consumed to the least consumed) whereas most of the non-dietary supplements consumers ate at least more than 15g servings of cereals, roots, plantains and tubers; other fruits and vegetables; Dairy products; flesh foods; legumes and nuts; vitamin A rich fruits and vegetables and lastly eggs (ranked from the most consumed to the least consumed). Total overconsumption of high-energy dense foods from fats (flat bread) and added sugars (tea) were universal. This information brings with it an element of public health that needs to be addressed by advocating behavior change and promoting healthy eating.Selected nutrient intakes among the adults between the ages 18-64 years in Westlands constituency, KenyaThe National Nutrition Action Plan focuses on reducing the incidence of micronutrient diseases’ in the Kenyan population [21]. As there have been steady improvements over the past few years, there is still an important milestone ahead of us; while studies like this still show that most people in urban areas eat high-energy, low-nutrient diets on a daily basis. For example, not all male participants in this study met the daily recommendations for all nutrients and the female participants did not meet the daily nutritional needs for most nutrients except for vitamin E intake. This is worrying as statistics show a high risk of micronutrient deficiency in this population group. The vitamin C intake in the study was relatively very low. However, the adults who consumed native local vegetables like sukuma wiki, pumpkin leaves and amaranth leaves had better vitamin C intake than those who did not. Therefore, it is a crucial to strategically prioritize local indigenous vegetables in the agricultural sector so that their potential can be fully exploited for income generation and food and nutrition can be fully realized. For example, Kenyans can rely on native indigenous leafy vegetables as an inexpensive nutritional intervention for adequate micronutrient intake (particularly calcium, magnesium, iron, folic acid, vitamin C and vitamin E).In addition, calcium intake had a very low threshold intake in both men and women as the consumption of dairy products was mainly through milk addition of milk to tea. In Australia, too, the adult population consumes fewer vegetables, fruits and dairy products; as a result about 44% of men and 71% of women do not meet the recommended daily calcium intakes [3]. This could put the study population at high risk and lead to a high risk of adverse effects on bone health and micronutrient deficiency in the study population with age. A comparison between the supplement users showed that supplement users tended to consume larger amounts of vitamin E. This raises concern about the urgently needed caution with vitamin E supplementation in adults as hypertoxicity increases the likelihood of mortality by increasing the duration of bleeding [2]. However, there was no statistical difference between dietary supplement intake and daily intakes of calcium, folic acid, magnesium, iron, vitamin C and vitamin E from food sources (Table 3). The total nutrient intake of the dietary supplement users was higher for each vitamin than for the nonusers. However, taking supplements did not do much to maintain the recommended daily allowance. This indicates the urgency of increasing nutrition education in Kenya, especially among the urban populations.
5. Conclusions
- Worldwide, the nutraceutical industry has grown enormously due to the Covid-19 pandemic. However, the prevalence of dietary supplement use in this study was very low and not significant in the Westlands constituency. The use of dietary supplement was mostly common among middle aged Kenyan women of child bearing age due to an underlying health issue. Poor nutrition practices were more likely due to limited time and access to healthy meals in the work place than to a lack of nutritional knowledge. The reason the majority of adults did not eat a varied diet was not due to literacy. This is so unfortunate because it increases the likehood of nutritional deficiencies and related illnesses within a workforce that has greater potential to contribute to growth of the country’s economy in the years to come. Local fruits and vegetables (amaranth, sukumawiki, pumpkin, mangoes and papayas) are good sources of vitamins and minerals. However, the recommended daily intake of folate (320mg/day) cannot be achieved by consuming local indigenous foods alone, as natural folates are poorly stable.Therefore, food fortification and supplementation initiatives remain a priority for most populations in developing countries as synthetic forms of essential nutrients are more stable in terms of bioavailability [33].
ACKNOWLEDGEMENTS
- We thank the Mwalimu Nyerere Scholarship Program of the African Union (AU) for financial support of this study. Also the staff of the Department of Food Science, Nutrition and Technology at the University of Nairobi is responsible for conception, study design, data collection, analysis, interpretation, critical review of the article, consent to publication and consent to be responsible for all aspects of the work. Our thanks also go to the research assistants and participants who took part in this study. This review is part of a Masters in Applied Human Nutrition.
 Abstract
 Reference
 Full-Text PDF
 Full-text HTML