-
Paper Information
- Previous Paper
- Paper Submission
-
Journal Information
- About This Journal
- Editorial Board
- Current Issue
- Archive
- Author Guidelines
- Contact Us
International Journal of Food Science and Nutrition Engineering
p-ISSN: 2166-5168 e-ISSN: 2166-5192
2021; 11(1): 20-26
doi:10.5923/j.food.20211101.02
Received: Mar. 1, 2021; Accepted: Mar. 16, 2021; Published: Mar. 20, 2021

Proximate Composition and Mineral Contents of Duku (Lansium domesticum) Fruit
 Abstract
 Reference
 Full-Text PDF
 Full-text HTML
Roslan Arshad1, 2, Kamarul ‘Ain Mustafa1, Che Abdullah Abu Bakar1, Abd Jamil Zakaria3, Noor Aida Aini Nawawi2, Suziani Muda2, Nurul Zaizuliana Rois Anwar1, Wan Anwar Fahmi Wan Mohamad1
1School of Food Industry, Faculty of Bioresources and Food Industry, Universiti Sultan Zainal Abidin, Besut Campus, Terengganu, Malaysia
2Centralised Lab Management Centre, Universiti Sultan Zainal Abidin, Besut Campus, Terengganu, Malaysia
3School of Agriculture & Biotechnology, Faculty of Bioresources and Food Industry, Universiti Sultan Zainal Abidin, Besut Campus, Terengganu, Malaysia
Correspondence to: Roslan Arshad, School of Food Industry, Faculty of Bioresources and Food Industry, Universiti Sultan Zainal Abidin, Besut Campus, Terengganu, Malaysia.
| Email: |  |
Copyright © 2021 The Author(s). Published by Scientific & Academic Publishing.
This work is licensed under the Creative Commons Attribution International License (CC BY).
http://creativecommons.org/licenses/by/4.0/

A native fruit of Southeast Asia, duku (Lansium domesticum) fruit is grown in Malaysia, notably in the state of Terengganu, renowned for its premium quality. Physically, the fruit is signified by thick fairly leathery golden brown skin, shaped oval or almost circular whose short diameter range between 40 – 50 mm. Organoleptic attributes of the fruit are derived from the sweet-sour aromatic profile elicited from the juicy flesh. Recognition of fruits constituting healthy diets is a cornerstone for ascending global consumption trends. In this respect, this study of various components of duku fruit harvested in Terengganu aimed to evaluate the nutritional constituents as source of potent health promoting chemicals, and identify correlations between experimental variables. Proximate composition and mineral content analysis were based on the standard procedures of AOAC (2011). Crude fat, crude protein and carbohydrate content enabled mathematical derivation of caloric value. Inductive couple plasma optical emission spectrometry (ICP-OES) facilitated mineral content analysis. Comparatively, duku peel had highest ash value, 1.2 g per 100 g, whereas duku flesh lowest, containing 0.4 g per 100 g, WB. Crude protein results proved seeds were highest, 3.0 g per 100g, in contrast to flesh at 0.9 g per 100 g. Crude fat were found in peel and seeds, 2.7 g and 0.1 g per 100 each, respectively but not detectable in flesh. Crude fibre tended to be significantly higher by 10 fold in seeds compared to flesh, evidently at 5.2 g in the former while 0.4 g in the latter based on 100 g sample weight each. Mineral elements analysis, specifically of potassium, calcium, and magnesium revealed superior valuations in peel recording 2692.9 mg, 361.5 mg and 144.1 mg respectively, on a 100 g sample weight basis. Relatively lowest were results obtained from flesh at 762.5 mg, 73.0 mg and 43.8 mg respectively, based on 100 g sample weight each. The spectrum of values attained from the variables researched points to future potential of duku fruit commercialization as a potent ingredient in food and beverage products. Nevertheless, related complementary research to augment this current work is required before the wholesome intrinsic qualities of this fruit can be realistically capitalized.
Keywords: Duku, Fruit composition, Peel, Seed, Flesh
Cite this paper: Roslan Arshad, Kamarul ‘Ain Mustafa, Che Abdullah Abu Bakar, Abd Jamil Zakaria, Noor Aida Aini Nawawi, Suziani Muda, Nurul Zaizuliana Rois Anwar, Wan Anwar Fahmi Wan Mohamad, Proximate Composition and Mineral Contents of Duku (Lansium domesticum) Fruit, International Journal of Food Science and Nutrition Engineering, Vol. 11 No. 1, 2021, pp. 20-26. doi: 10.5923/j.food.20211101.02.
Article Outline
1. Introduction
- Lansium domesticum belongs to the Meliaceae family and is among the most popular fruits in the countries of South East Asia. The fruit is known as “duku”. In Malaysia, this tree grows in several areas in Terengganu. Duku has a thick skin (up to 6 mm, 0.25 in), no latex, few seeds, sweet taste and a good aroma. This fruit is rounded about 40 to 50 mm in diameter (Paull, 2014). Fruits are mostly produced once a year. During the harvest season, the fruit is sold everywhere on the side roads. The short-lived freshness of the fruit may be the reason why the fruit is not sold so far from where it is grown (Okiror et al., 2017).Fruits are main components of a balanced diet. From a nutritional point of view, fruit is one of the major sources of dietary requirements. Tropical fruits contain many vitamins, dietary fibers and minerals that are beneficial to health. The value of consuming fruit has increased worldwide due to its flavour, disease prevention and nutrient-containing health benefits (Slavin and Lloyd, 2012). Additionally, an increase in the consumption of these fruits often means an increase in the amount of waste produced, in particularly peels and seeds. In addition, products (peel and seed) from various fruits may be essential sources of valuable chemicals (Morais et al., 2017).According to Morais et al., (2017), peels and seeds could also have a higher nutrient content than pulp fruits. But, the peels are extremely perishable, mostly because of the huge amount of water in their composition. Drying techniques such as air circulation oven can be applied in fruit peels to delay the perishable. Determination of the nutritional and mineral contents of this Malaysia’s seasonal fruit reveals its potential to be commercialised into different food and beverage products. The aim of this study was to evaluate the nutritional composition of fruit flesh, peel and seed of duku fruit. The following parameters were evaluated: chemical composition (moisture, ash, crude protein, crude fat and crude fiber) and mineral contents by inductively couple plasma optical emission spectrometry (ICP-OES).
2. Materials and Methods
2.1. Chemicals and Standards
- Analytical reagents-grade chemicals were used in the preparation of all solutions. Ultrapure water was obtained from ultrapure water purification system (Sartorius, Germany). The standard solution of elements was obtained from Inorganic Ventures, USA.
2.2. Collection and Preparation of Sample
- The fruit sample was collected from duku orchards in Kuala Terengganu. The duku fruit was cleaned by washing in tap water, dried with paper towel and manually separated into flesh, peel and seed. The samples were placed on aluminium pan and dried in oven for 24 h. Each part of the fruit (flesh, peel, seed) one by one, subsequently ground and stored in different polyethylene bags at -20°C until analysis. All analyses were done in triplicate.
2.3. Proximate Composition
- The homogenised samples were analysed for moisture, protein, fat, ash and fiber by the methods of AOAC (2011).
2.3.1. Determination of Moisture Content
- Moisture was determined by oven drying method. The clean and dried crucible was weighed (W1). 3.0 g of homogenised sample was accurately weighed in the crucible (W2). The crucible with sample was allowed in oven (Memmert UF110, Germany) at 105C for 6 – 12 h until a constant weight was obtained. Then the crucible was placed in a desiccator and weighed after attaining room temperature (W3). The percentage of moisture was calculated as follows: % Moisture =
 x 100Where: W1 = Weight of crucible (g)W2 = Weight of crucible + weight of wet sample (g)W3 = Weight of crucible + weight of dried sample (g)
2.3.2. Determination of Ash
- For the determination of ash, the crucible was dried with cover in an oven and was weighed (W1). 3.0 g of homogenised sample was weighed in the crucible (W2). The sample was charred gently over a Bunsen burner until ceased smoking. The sample was placed in muffle furnace (Carbolite CWF110, UK) at 550°C overnight. The appearances of grey white ash indicate complete oxidation of all organic matter in the sample. Then the crucible was placed in a desiccator and weighed after attaining room temperature (W3). The percentage of ash was calculated as follows:% Ash =
 x 100Where: W1 = Weight of crucible (g)W2 = Weight of sample (g)W3 = Weight of crucible + ash (g)
2.3.3. Determination of Crude Protein
- Principle: Protein consisted of hydrogen, carbon, nitrogen, oxygen and sulphur. Nitrogen was the distinguishing element present in proteins. Analysing for total crude protein is normally accomplished by using the Kjeldahl method. This method was applied to determine the total nitrogen present and this nitrogen content multiplied by a factor of 6.25 to yield the protein present in a meat sample. In the Kjeldahl method, the proteins and other organic substances digested with concentrated sulphuric acid in the presence of catalysts. The nitrogen present converted to ammonium sulphate which quantitated by a titration or a calorimetric method. Crude protein in the sample was determined using Kjeldaterm System, Gerhardt, Germany. 1.0 g to an accuracy of (0.1 mg or 0.0001g) in digestion tube. Add 2 tablets of catalyst into a digestion tube and carefully added 12 ml of concentrated H2SO4. The digestion tube was gently swirled to wet the sample with the acid. Then placed the rack on the digestion block with the temperature 400°C to start digestion. Digest until the sample become clear with a green/blue solution. It needs 60 - 90 min to complete. The digest was cooled for 10 – 15 min. Then followed the appropriate procedure to start up distillation system (Vapodest, Gerhardt, Germany). 25 ml of receiver solution (25 ml of 2% boric acid with a few drops of indicator solution) was filled in conical flask that was placed it into the distillation unit. The desired program was pressed and 70 ml distilled water dispensed into the tube automatically and followed by 50 ml of 32% NaOH. The distillation process takes approximately 4 minutes. The receiver solution in the distillate flask becomes green indicating the presence of an alkali – Ammonia. The distillate was then titrated with standardized hydrochloric acid 0.1 N until the colour of mixture turns to pink/red. The blank also ran for each analysis. The blank contains only 12 ml of concentrated H2SO4 and catalyst (without sample) and follow all steps as above procedure. The percentage of crude protein was calculated as follows:% N =
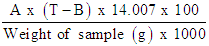 % crude protein = % N x FWhere: T = Volume acid for sampleB = Volume acid for blankA = Normality of HClF = Protein factor, 6.25
2.3.4. Determination of Crude Fat
- Crude fat in the sample was determined using Soxtherm, Gerhardt, Germany. The pre-dried extraction beaker was weighed (W2). Used the extraction cup handler to hold it to avoid erroneous result. 3.0 g of homogenised sample was weighed to an accuracy of (0.1 mg or 0.0001g) (W1) and wrapped with a piece of filter paper, placed in the extraction thimble. 150 ml of petroleum ether was measured and placed it into the extraction beaker. Insert the extraction thimble into the thimble holder and placed them into the extraction beaker. The extraction beaker was attached to the system. After complete extraction, the extraction beaker was transferred in oven at 105°C for 2 h. Then the extraction beaker was placed in a desiccator and weighed after attaining room temperature (W3). The percentage of crude fat was calculated as follows:% Fat =
 x 100Where: W1 = Weight of sample (g)W2 = Weight of extraction cup (g)W3 = Weight of extraction cup + fat (g)
2.3.5. Determination of Crude Fiber
- Principle: Crude fiber was determined by sequential extraction of the sample with H2SO4 and NaOH. The insoluble residue was collected by filtration and the residue was dried, weighed and ashed.Crude fiber in the sample was determined using Fibertherm, Gerhardt, Germany. The empty fiber bag was weighed (W1). 1.0 g of homogenised sample was weighed to an accuracy of (0.1 mg or 0.0001g) in the fiber bag (W2). Placed the glass spacer in the fiber bag and insert the bag in carousel. If the fat content of the sample > 10%, needs defatting by immersed the carousel three times in 100 ml petroleum ether. By turning it as well as moved up and down the sample defatted. The fiber bag was dried approximately 2 minutes. Then placed the carousel in the glass container and introduced on the hotplate. After complete, the fiber bag was transferred from carousel to crucible. The crucible containing fiber bag was dried for 4 h or overnight at 105°C. Then crucible containing fiber bag was placed in a desiccator and weighed after attaining room temperature (W3). Kept the sample crucible in muffle furnace at 550°C. The sample was ignited for 4 hours at 550°C. Cooled the sample in desiccator and weighed again (W4). For blank value (W5), subtract the crucible containing ash of the empty fiber bag (W7) with the empty crucible (W6) as follows. Blank value W5 = W7 – W6The percentage of crude fiber was calculated as follows:% Crude fiber =
 Where:W1 = Weight of fiber bag (g)W2 = Weight of sample (g)W3 = Weight of crucible and fiber bag after digestion (g)W4 = Weight of crucible and ash (g)W5 = Weight of blank value of the empty fiber bag (g)W6 = Weight of crucible (g)W7 = Weight of crucible and ash of the empty fiber bag (g)
2.3.6. Determination of Carbohydrate
- Carbohydrate was calculated by difference after analysis of all the other items method in the proximate analysis.% Carbohydrate = 100 – (% moisture + % ash + % crude protein + % crude fat + % crude fiber)
2.4. Determination of Mineral Content
- Mineral content of duku samples were analysed by inductively couple plasma optical emission spectrometry (ICP-OES), after microwave-assisted acid digestion. All glassware was cleaned with 10% (v/v) HNO3 for a day and rinsed with ultrapure water.
2.4.1. Sample Preparation
- The samples were digested using microwave digestion method (Anton Paar, Multiwave GO). The samples of approximately 0.5 – 1.0 g were digested with 9.0 ml of concentrated nitric acid (HNO3) in microwave digestion system. After digestion complete, the resulting solutions were cooled and diluted with deionized water up to 100 ml volumetric flask. This solution was finally used for elemental analysis carried out by ICP-OES. The concentration values of elements (Ca, Cu, Fe, K, Mg, Mn and Na) were determined in duku sample.
2.4.2. Inductively Coupled Plasma-Optical Emission Spectrometry (ICP-OES) Analysis of Samples
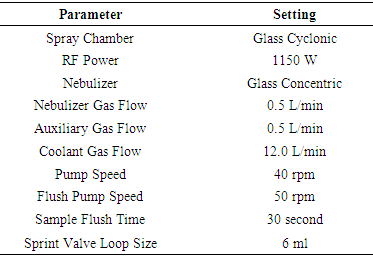
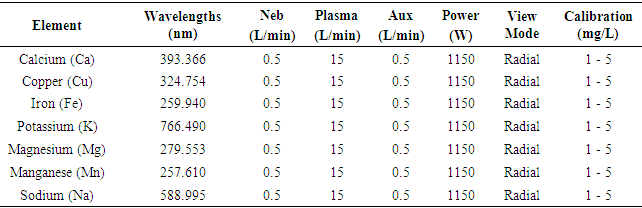
- All samples were analysed in triplicates by ICP-OES Thermo Scientific iCAP 7600 using Qtegra software for the analysis. The ICP-OES, Thermo ScientificTM iCAPTM instrument with QtegraTM Intelligent Scientific Data Solution (ISDS) software was used for data acquisition and provides easy options for post-analysis data manipulation. The operating parameters are listed in Table 1. The wavelengths, measurement parameters and standards for each element are given in Table 2.
|
|
2.4.3. Analysis of Certified Reference Material (CRM) of Mineral and Calibration
- Aliquots of ICP multi-element standard solution (1 to 5 mg/L) containing the elements such as (Ca, Cu, Fe, K, Mg, Mn, Na) were used in the preparation of calibration solutions. Working standard solutions were prepared by dilution of the stock standard solutions to desired concentration in deionised water. The ranges of the calibration curves (5 points) were selected to match the expected concentrations for all elements of the sample studied by ICP-OES. The correlation coefficient R2 obtained for all cases was 0.9999.
2.5. Statistical Analysis
- Results were reported as mean ± standard deviation (SD). Data were analysed using SPSS (Version 22.0) software (SPSS Inc., Chicago, USA). Data analysis used One-Way Analysis of Variance (ANOVA). The Duncan test, at p < 0.05, was used to assess significant differences between means of samples.
3. Results and Discussion
3.1. Proximate Composition
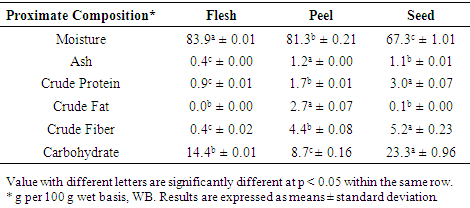
- Table 3 showed the proximate composition of Lansium domesticum fruit, which is locally called as “Duku Terengganu”. The analysis showed significant differences among the different fruit parts. Flesh and peel presented higher value of moisture content than the seed. Flesh contained 83.9 ± 0.01 and peel contained 81.3 ± 0.21 while seed contained 67.3 ± 1.01 g per 100 g in wet basis, WB) of duku fruit. The duku flesh moisture content (83.9 ± 0.01 g per 100 g) as reported in the present study is slightly lower compared to finding by Morton (1987) which reported 86.5 g per 100 g of langsat or lanzones fruit flesh, and higher than in longan (Dimocarpus longan) fruit flesh which corresponded to 72.4 g per 100 g (Wong and Saichol, 1991). Morais et al., (2017) reported that papaya flesh, peel and seed were contained 87.8, 86.8 and 5.8 g moisture per 100 g, respectively while avocado fruit flesh, peel and seed contained 86.7, 65.7 and 67.2 g per 100 g, respectively. It showed that the moisture content in duku flesh was lower than in papaya and avocado flesh. The content in duku peel was higher compared to that of avocado peel and lower than that of papaya peel. The duku seed had similar values with avocado seed. According to Thales and Mirian (2019), products with lower moisture content, commonly less prone to microorganism degradation and chemical changes.The ash content of duku fruit (Table 3) in the present study ranged from 0.4 ± 0.00 to 1.2 ± 0.00 g per 100 g WB. Peel presented the highest ash value 1.2 ± 0.00 with significant differences between flesh and seed (1.1 ± 0.01 and 0.4 ± 0.00 WB) respectively. Morais et al., (2017) reported that in papaya flesh, peel and seed were contained 4.2, 11.6 and 6.0 g per 100 g, respectively while in avocado fruit flesh, peel and seed were contained 2.1, 1.5 and 2.3 g per 100 g, respectively. It showed that the ash content in duku flesh, peel and seed were lower than papaya and avocado. It is vital to know that the quantity of mineral elements in food is the ash composition. Crude protein values (Table 3) varied from 0.9 ± 0.01 to 3.0 ± 0.07 WB (Table 1). Seed presented the highest value of crude protein with 3.0 ± 0.07 and lowest in flesh of 0.9 ± 0.01 g per 100 g WB. Morton (1987) reported that langsat fruit flesh contained 0.8 g per 100 g, which is lower than duku fruit flesh 0.9 g per 100 g. Meanwhile, Wong and Saichol (1991) reported that longan fruit flesh contained 1.0 g per 100 g of protein, which is slightly higher than duku and langsat fruit. Morais et al., (2017) reported that in papaya flesh, peel and seed were contained 6.5, 20.2 and 23.3 g per 100 g, respectively while in avocado fruit flesh, peel and seed were contained 12.5, 6.3 and 9.6 g per 100 g, respectively. It showed that the duku flesh, peel and seed were lowest crude protein compared to papaya and avocado. It is important to note here that proteins fruit values are low because in general, the fruit is not a potential protein source.Crude fat (Table 3) was not detected in flesh while the crude fat value in peel and seed were 2.7 ± 0.07 and 0.1 ± 0.00, respectively. The results showed peel contained the highest value of crude fat compared to seed and flesh. There are no significant differences between flesh and seed, while it showed significant differences between peel and seed. Wong and Saichol (1991) reported that longan fruit flesh contained 0.5 g per 100 g, which is higher value than langsat flesh was 0.3 g per 100 g finding by Morton (1987) and higher than duku fruit. According to Morais et al., (2017), the crude fat content in papaya flesh, peel and seed were 1.4, 2.2 and 20.5 g per 100 g, respectively while in avocado fruit flesh, peel and seed were 28.6, 3.5 and 3.9 g per 100 g, respectively. It showed that the crude fat content in duku flesh was lower than papaya and avocado flesh. The duku peel was higher compared to papaya peel and lower than avocado peel. The duku seed was the lowest values compared to papaya and avocado seed.Crude fiber contents (Table 3) in flesh, peel and seed were 0.4 ± 0.02, 4.4 ± 0.08 and 5.2 ± 0.23 respectively. Seed and peel presented the the highest values of crude fiber compared to flesh of duku fruit. Morton (1987) reported that langsat fruit flesh contained 0.8 g per 100 g, which is higher than duku fruit flesh 0.4 g per 100 g. Meanwhile, Wong and Saichol (1991) reported that longan fruit flesh contained 0.4 g per 100 g of crude fiber, which is the same value with duku fruit. Morais et al., (2017) reported that in papaya flesh, peel and seed were contained 1.8, 16.5 and 46.9 g per 100 g, respectively while in avocado fruit flesh, peel and seed were contained 41.1, 46.9 and 10.7 g per 100 g, respectively. It showed that the duku flesh, peel and seed were lowest crude fiber values compared to papaya and avocado.Different parts of duku fruit presented the carbohydrate contents (Table 3) in flesh, peel and seed were 14.4 ± 0.01, 8.7 ± 0.16 and 23.3 ± 0.96 respectively. Seed showed the highest value of carbohydrate. Wong and Saichol (1991) reported that longan fruit flesh contained 25.2 g per 100 g, which is higher value than langsat flesh was 14.2 g per 100 g finding by Morton (1987) and higher than duku fruit. The carbohydrate contents in duku and langsat fruit flesh slightly the same values.
|
3.2. Mineral Contents
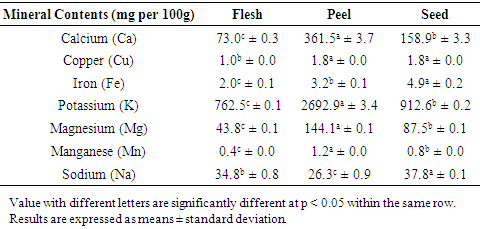
- Minerals are essential for human health. Table 4 showed the mineral content of duku fruit in mg per 100 g. The results of calcium (Ca), copper (Cu), iron (Fe), potassium (K), magnesium (Mg), manganese (Mn) and sodium (Na) were determined. The duku flesh contained 73.0 ± 0.3 Ca, 1.0 ± 0.0 Cu, 2.0 ± 0.1 Fe, 762.5 ± 0.1 K, 43.8 ± 0.1 Mg, 0.4 ± 0.0 Mn and 34.8 ± 0.8 Na. Peel contained 361.5 ± 3.7 Ca, 1.8 ± 0.0 Cu, 3.2 ± 0.1 Fe, 2692.9 ± 3.4 K, 144.1 ± 0.1 Mg, 1.2 ± 0.0 Mn and 26.3 ± 0.9 Na. Seed contained 158.9 ± 3.3 Ca, 1.8 ± 0.0 Cu, 4.9 ± 0.2 Fe, 912.6 ± 0.2 K, 87.5 ± 0.1 Mg, 0.8 ± 0.0 Mn and 37.8 ± 0.1 Na. The calcium content in duku fruit was highest in peel (361.5 ± 3.7 mg per 100 g) followed by seed (158.9 ± 3.3 mg per 100 g) and flesh (73.0 ± 0.3 mg per 100 g). Morais et al., (2017) reported that in papaya flesh, peel and seed were contained 184.7, 3563.3 and 8435.1 mg per 100 g, respectively while in avocado fruit flesh, peel and seed were contained 54.9, 679.3 and 434.9 mg per 100 g, respectively. It showed that the calcium content in duku flesh was lower than papaya but higher than avocado. The duku peel and seed were lowest values compared to papaya and avocado. It vital to note that calcium allows muscles and blood vessels to contract, expand and transmit signals through the nerves system (BNF, 2020).Copper content in duku fruit was similar values with peel and seed of fruit (1.8 ± 0.0 mg per 100 g). According to Morais et al., (2017), the copper content in papaya flesh, peel and seed were 0.5, 11.3 and 9.5 mg per 100 g, respectively while in avocado fruit flesh, peel and seed were 1.3, 14.5 and 16.7 mg per 100 g, respectively. It showed that the copper content in duku flesh was higher than in papaya but lower than in avocado. The duku peel and seed had lower values compared to papaya and avocado. It is important to note here copper helps in the development of various human tissues and red blood cells (BNF, 2020).Iron content in duku fruit was the highest in seed (4.9 mg per 100 g) compared to peel and flesh. Morais et al., (2017) reported that in papaya flesh, peel and seed were contained 5.1, 3.2 and 5.8 mg per 100 g, respectively while in avocado fruit flesh, peel and seed were contained 2.7, 2.3 and 3.7 mg per 100 g, respectively. It showed that the iron content in duku flesh was lower than papaya and avocado. The duku peel was similar values with papaya. The duku seed was lower than papaya but higher than avocado. It is vital to know that iron is part of haemoglobin, a protein that brings oxygen from the lungs to the tissues and provides the muscles with oxygen. Iron is essential for cell growth, development and normal body function. It also helps the body produce a few hormones and connective tissues (BNF, 2020).Potassium was the most abundant mineral in fruits. The potassium content in duku fruit ranging from 762.5 – 2692.9 mg per 100 g. It can be observed that potassium was the highest values in duku peel. According to Morais et al., (2017), the potassium content in papaya flesh, peel and seed were 1562.5, 4808.1 and 1635.5 mg per 100 g, respectively while in avocado fruit flesh, peel and seed were 1195.2, 899.0 and 1202.6 mg per 100 g, respectively. It showed that the potassium content in duku flesh was the lowest values compared to papaya and avocado. The duku peel was lower than papaya but higher than avocado. The duku seed was lowest values compared to papaya and avocado. It vital to note that potassium allows the body to control blood pressure, heart rhythm, water content in cells and it also helps with digestion (BNF, 2020). Magnesium content in duku fruit was highest in peel (144.1 ± 0.1 mg per 100 g) followed by seed (87.5 ± 0.1 mg per 100 g) and flesh (43.8 ± 0.1 mg per 100 g). Morais et al., (2017) reported that in papaya flesh, peel and seed were contained 148.2, 108.1 and 218.5 mg per 100 g, respectively while in avocado fruit flesh, peel and seed were contained 82.1, 46.9 and 55.8 mg per 100 g, respectively. It showed that the magnesium content in duku flesh was the lowest values compared to papaya and avocado and highest values of duku peel. The duku seed was lower than papaya but higher than avocado. It is important to note here magnesium allows the human body to control muscle and nerve function, blood glucose levels and blood pressure. It also allows the body to build protein, bone, and DNA (BNF, 2020).Manganese content in duku fruit was the highest in peel (1.2 mg per 100 g) compared to seed and flesh. According to Morais et al., (2017), the manganese content in papaya flesh, peel and seed were 0.05, 1.2 and 2.5 mg per 100 g, respectively while in avocado fruit flesh, peel and seed were 1.3, 1.4 and 1.5 mg per 100 g, respectively. It showed that the manganese content in duku flesh was higher than papaya but lower than avocado. The duku peel was similar values with papaya. The duku seed was lowest values compared to papaya and avocado. Manganese is part of many enzymes. It potentially acts in enzymatic and biochemical reactions in human body (BNF, 2020).The sodium content in duku fruit was highest in seed (37.8 ± 0.1 mg per 100 g) followed by flesh (34.8 ± 0.8 mg per 100 g) and peel (26.3 ± 0.9 mg per 100 g). Morais et al., (2017) reported that in papaya flesh, peel and seed were contained 54.7, 85.2 and 39.8 mg per 100 g, respectively while in avocado fruit flesh, peel and seed were contained 32.3, 21.1 and 39.4 mg per 100 g, respectively. It showed that the sodium content in duku flesh and peel were lower than papaya but higher than avocado. The duku seed was lowest values compared to papaya and avocado. It vital to note that sodium required for the proper fluid balance, nerve transmission and muscle contraction in human body (BNF, 2020).
|
4. Conclusions
- The proximate composition and mineral content of the analysed fruit parts (flesh, peel and seed) are distinct. This study showed that duku peel had the highest ash value with 1.2 g per 100 g and lowest in flesh of 0.4 g per mg, wet basis (WB). Seed presented the highest value of crude protein with 3.0 g per 100 g and lowest in flesh of 0.9 g per 100 g. Crude fat was not detected in flesh while the crude fat values in peel and seed were 2.7, 0.1 g per 100g, respectively. For crude fiber, the content was highest in seed with 5.2 g per 100 g and lowest in flesh with 0.4 g per 100 g. Potassium, calcium and magnesium content showed highest value in peel which were 2692.9 mg per 100 g, 361.5 mg per 100 g and 144.1 mg per 100 g respectively, while lowest in flesh which were 762.5 mg per 100 g, 73.0 mg per 100 mg and 43.8 mg per 100 g respectively. Information on nutritional and mineral contents of this Malaysia’s seasonal fruit reveals its potential to be commercialized into different food and beverage products.
ACKNOWLEDGEMENTS
- In carrying out the activities within this endeavour, I am gratefully honoured to have the opportunity to express my appreciation with thanks to Terengganu State Economic Planning Unit through grant UPEN/UniSZA/7 M0092 – M005 in support of the financial requirements of this project.