-
Paper Information
- Paper Submission
-
Journal Information
- About This Journal
- Editorial Board
- Current Issue
- Archive
- Author Guidelines
- Contact Us
International Journal of Food Science and Nutrition Engineering
p-ISSN: 2166-5168 e-ISSN: 2166-5192
2019; 9(2): 37-44
doi:10.5923/j.food.20190902.02

Physiochemical and Sensory Characteristics of Made-In-Transit Yogurt
 Abstract
 Reference
 Full-Text PDF
 Full-text HTML
Katherine A. Thompson-Witrick1, Kunal Das2, Ruplal Choudhary2, Derek J. Fisher3, Tan Chai4
1Department of Animal Science, Foods and Nutrition and the Fermentation Science Institute, Southern Illinois University, Carbondale, United States
2Department of Plant, Soil, and Agricultural Systems, Southern Illinois University, Carbondale, United States
3Department of Microbiology, Southern Illinois University, Carbondale, United States
4Department of Mechanical Engineering, Southern Illinois University, Carbondale, United States
Correspondence to: Ruplal Choudhary, Department of Plant, Soil, and Agricultural Systems, Southern Illinois University, Carbondale, United States.
| Email: |  |
Copyright © 2019 The Author(s). Published by Scientific & Academic Publishing.
This work is licensed under the Creative Commons Attribution International License (CC BY).
http://creativecommons.org/licenses/by/4.0/

Made-in-transit (MIT) is a supply chain concept for the complete or partial manufacturing or production of perishable foods while being transported to the market. A 33 factorial design was carried out looking at the fermentation temperature (25°C, 30°C, and 35°C), apple fiber concentration (0%, 0.5%, 1.0%, and 1.5% v/w), and experimental treatment (no vibration or vibration to mimic that associated with transportation). Yogurt was manufactured using one of the four apple fiber concentrations and then fermented under one of the three fermented temperatures for 48 hours before being shifted into a 4°C cold room to finalize the gelling process. Physical-chemical properties including titratable acidity, pH, whey syneresis, and texture analysis were analyzed for all conditions using two-way ANOVA. There were noticeable differences between the fermentation temperature and the experimental treatment on the physical-chemical and sensory attributes measured. The apple fiber had no impact. A total of 63 people participated in a hedonic testing study to look at the impact the fermentation temperature, apple concentration, and the experimental treatment had on the appearance, aroma, taste, and mouthfeel of the yogurt. Consumers found the MIT yogurt to be unacceptable based upon all attributes tested (appearance, aroma, flavor, and mouthfeel).
Keywords: Made-in-transit yogurt, Yogurt, Prebiotic yogurt
Cite this paper: Katherine A. Thompson-Witrick, Kunal Das, Ruplal Choudhary, Derek J. Fisher, Tan Chai, Physiochemical and Sensory Characteristics of Made-In-Transit Yogurt, International Journal of Food Science and Nutrition Engineering, Vol. 9 No. 2, 2019, pp. 37-44. doi: 10.5923/j.food.20190902.02.
Article Outline
1. Introduction
- Milk fermentation is one of the oldest fermented foods [1,2]. Yogurt is commonly made by fermenting cow’s milk using a 1:1 ratio of lactic acid producing bacteria, Lactobacillus bulgaricus or acidophilus and Streptococcus thermophilus, under controlled temperature and environmental conditions [1]. Yogurt is consumed throughout the world as excellent source of protein, calcium, phosphorus, riboflavin, thiamin, vitamin B12, folate, niacin, magnesium, and zinc [2,3]. Those who are lactose intolerant are able to consume yogurt and yogurt-like products because during the fermentation process the lactose present in the milk is converted into lactic acid [4]. Similar to other fermented products, today’s yogurt is fermented under controlled conditions within a manufacturing facility and then transported using temperature controlled trucks [5]. A relatively new manufacturing concept, developed by Jaworska, is Made-in-transit (MIT). MIT is a supply chain concept for the complete or partial manufacturing or production of perishable foods while being transported to the market [6]. This technique has been utilized for the production of mushrooms, however it is still being developed for the production of yogurt. The primary issue with the MIT concept is that the body and texture of the yogurt produced are poor [7]. Consumers expect set yogurt to have a firm body to be spooned and a smooth fine texture [8]. Prior work indicates that vibration and shock occurring during shipping contributed to the poor quality of the MIT yogurt product. Transit-induced vibration and shock are both involved in damaging perishable goods during transportation and occur due to a variety of different causes. The primary cause of vibration is due to unevenness in the pavement caused by everyday wear and tear on the asphalt (REF). Other sources of vibration can be caused by the vehicle’s suspension [9-11], road surface conditions (standing water, snow, ice, etc.) [12-14], payload [11,12], platform location [10,15] travel speed, braking speed and/or sharpness [16], and tires [17]. Shock, in addition to vibration, can cause damage to pre-packaged and perishable foods shortening their shelf life. Shock can be caused by unevenness in the road, manholes, and metal joints [18]. As significant reductions in vibration and shock during transportation are difficult to manage, improved methods of MIT yogurt production have focused on altering yogurt composition and fermentation conditions. Previous MIT studies have looked at the impact of increasing skim milk powder added to Ultra High-Temperature Pasteurized (UHT) milk used for the manufacturing of yogurt as well as, to investigate fermentation times at lower temperatures in relation to yogurt’s body and texture. The study conducted by Nor-Khaizura et al. (2014) showed that skim milk powder added does in fact produce a yogurt with acceptable pH, total acidity, and texture for a set yogurt, however that project did not focus on the impact transportation vibration and movement would have on the body of the yogurt. We hypothesized that the addition of apple fiber during MIT yogurt production would improve the body of the product without negatively impacting the physicochemical and sensory characteristics of the yogurt. This was assessed by varying concentrations of apple fiber (0, 0.5, 1.0, 1.5% w/v) and measuring the impact of fiber content on the body and texture of yogurt fermented at different temperatures while being subjected to vibration.
2. Materials and Methods
2.1. Factorial Experiment Design
- A 33 factorial experimental design was generated using DESIGN EXPERT 11 (Stat-Ease Inc, Minneapolis, MN) to study the factors affecting the pH, total acidity, whey syneresis, and texture of set yogurts made using made-in-transit manufacturing technique. Nine experiments were carried out in random order and were defined according to: 1) fermentation temperature (25°C, 30°C, 35°C), 2) apple fiber concentration (0%, 0.5%, 1.0%, and 1.5% w/v), and 3) vibration or no vibration to simulate what occurs during long-haul transportation. Since the major objective of this study was to investigate the potential of producing yogurt using MIT, several concessions in the experimental design were required. Made-in-transit manufacturing technique greatly increase the timeframe and reduces the temperature control available for product formation, therefore the production of yogurt was designed to occur at lower than optimum temperature, and for a longer fermentation time. This project was designed as a proof of concept from which optimization can be performed.
2.2. Yogurt Manufacture
- Reduced-fat (2%) milk was purchased from a local dairy and stored at 4°C prior to use. Three-hundred mL of milk was transferred into a 500 mL beaker and heated on a hot plate with continuous stirring while heating to prevent scalding. The milk was heated to an initial temperature of 90°C and then cooled back down to 65°C using a 4°C water bath. The milk was continuously stirred until it reached a temperature of 65°C. After reaching a temperature of 65°C, apple fiber, donated by J Rettenmaier USA LP, Schoolcraft, MI, was added to the milk at varying concentrations (0.5, 1.0%, 1.5% w/v). Following the addition of apple fiber, the milk was cooled to 45°C. Once the milk reached an internal temperature of 45°C it was inoculated with 0.1 gm per 300 mL of milk of starter cultures (L. bulgaricus and S. thermophilus, Vivolac Cultures Corporation (Greenfield, IN)). The inoculated milk mixture was poured into three individual 100 mL cups.
2.3. Fermentation Process
- The yogurt was fermented in a walk-in fermentation chamber at the Fermentation Science Institute in the McLafferty Annex at Southern Illinois University. The fermentation chamber was set to one of three different temperatures (25°C, 30°C, or 35°C) for forty-eight hours. Following the completion of the fermentation process the yogurt was moved from the fermentation chamber into a 4°C cold storage room for 24 hours to allow the yogurt to set. Non-MIT (control) samples (no vibration) with the same apple fiber concentrations (0, 0.5, 1.0, and 1.5%) were also made and underwent the same fermentation conditions without being placed on the vibration simulator. The manufacturing of yogurt occurred on three separate days over a two-week period.
2.4. Made-In-Transit
- To mimic the shaking and vibration associated with transportation a vibration simulator was used. A Modal Shop 2060 E vibration simulator (The Modal Shop, Inc. Cincinnati, OH) composed of a shaking table with a digital signal generator with amplifier was used for this experiment. The simulator was set to have an acceleration amplitude of more than 0.1 g for 48 h during fermentation.
2.5. Titratable Acidity (TA)
- Titratable acidity as % lactic acid was determined by diluting 10 g of yogurt sample with 20 mL of distilled water in a 50 mL beaker. After thoroughly mixing, 10 mL of diluted yogurt sample was placed into a second 50 mL beaker with phenolphthalein indicator. 0.1 N standardized sodium hydroxide (NaOH) buffer was titrated into the sample until the sample turned pink. The quantity of sodium hydroxide buffer was noted to calculate the titratable acidity using the formula (Eq 1).
2.6. pH
- pH was measured using an Oaklon pH tester 30. The pH meter was calibrated prior to use with commercial pH 4.0 and 7.0 buffers (VWR analytical, Radnor, PA, USA).
2.7. Whey Syneresis
- The level of spontaneous whey separation in undistributed set yogurt samples was determined using a siphon method. The method was adapted from [19]. In our experiment, undistributed set yogurt samples were taken from a 4°C cold room and placed at a 45° angle for 3 hours to allow for the whey to separate from the sample. A syringe was used to siphon the whey from the side of the sample cup and the cup was reweighed. Syneresis was expressed as a percentage of final weight of the whey over the initial weight of the yogurt sample (Eq 2):
2.8. Texture Analysis
- The gel firmness of the yogurt was determined using a CT3 Texture Analyzer (Brookfield Engineering Labs, Inc., Middleboro, MA) with a 4.5 kg load cell, which was operated by using the preloaded software package TexturePro CT V1.2 Build 9. A single two bite texture profile analysis test was performed using a TA6 probe at an initial speed of 2.0 mm/s pre-test speed followed by 1.0 mm/s (test and post-test speed). The trigger load was set to 0.067 N with a target depth set to 30 mm. The number of cycles was also being set to 2 with a fixture of TA-RT-KI.
2.9. Sensory Analysis
- Sensory testing was conducted to determine consumer acceptability of yogurt produced under MIT conditions. Sensory sessions were conducted over three different days following the manufacturing of yogurt at their respective temperatures. The set yogurt was made three days prior to testing. A consumer panel consisting of 63 participants was recruited. A 9-point hedonic scale (1 = dislike extremely, 5 = neither like or dislike, 9 = like extremely) was used to evaluate the yogurt samples (color, taste, appearance, and aroma) [20]. Approximately 10 g of each sample were placed in plastic cups (60 mL) (Classic Sysco, Sysco Corporation, Houston, TX USA), lidded, and kept cold at 4 ±1°C. All samples were given a random three-digit and followed by a randomized presentation order. Water was provided to each participant so they could rinse their palate in between samples. Participants were also provided un-salted saltine crackers as well as an empty cup so they could expectorate any sample(s). Once a participant finished the first sample, the ballot was collected and the participant was then allowed to proceed onto the next one. This was repeated until they completed all three samples for that session. At the end of each session participants were allowed to grab a thank you snack for participating. The sensory panel analysis was approved by the SIUC Human Subjects Committee, Office of Sponsored Projects Administration (Protocol # 18124).
2.10. Statistical Analysis
- All yogurt samples were prepared and fermented in triplicate. Two-way analysis of variance was performed using R (R project for Statistical Programing, Vienna, Austria) to determine the impact fermentation temperature, experimental treatment (vibration), and apple concentration had on the pH, texture analysis, total acidity, and whey syneresis.
3. Results and Discussion
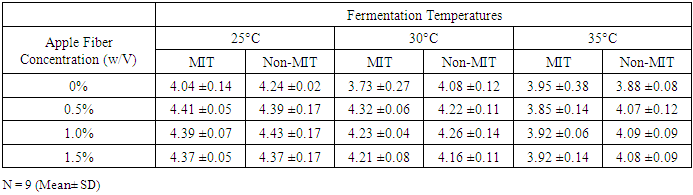
3.1. pH
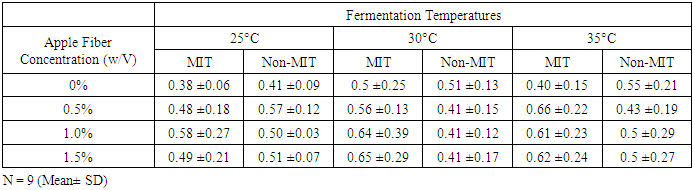
- pH is a critical quality control step for the production of dairy products including yogurt and can indicate if a sample has been contaminated with bacteria or chemicals, while also providing a convenient method for estimating acid development. The mean pH data is shown in Table 1. The mean pH values ranged from 3.73 – 4.41 for all of the yogurt samples. The fermentation temperature had a significant impact (p < 0.05) on final pH of the yogurt samples, while the apple fiber and the MIT conditions had no statistically significant impact on pH.
|
3.2. Syneresis
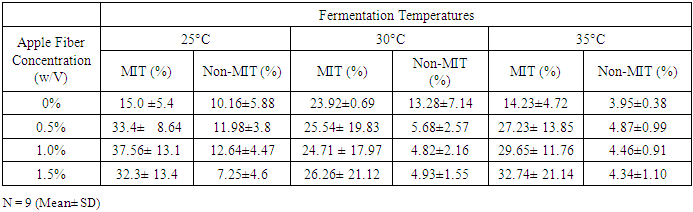
- The percentage of whey separation using the siphon method in yogurts made with varying levels of apple fiber (0, 0.5, 1.0, and 1.5%) at different temperatures under controlled and experimental conditions is shown in Table 2. The mean percentage for whey syneresis ranged widely from 3.95% – 37.56%. It was determined that the interaction between the fermentation temperature and MIT had a significant impact (p < 0.05) on the whey syneresis. The utilization of the MIT processing technique was shown to cause an increase in the whey syneresis. As previously stated in regards to pH, apple fiber appeared to have no effect on the whey syneresis.
3.3. Titratable Acidity (TA)
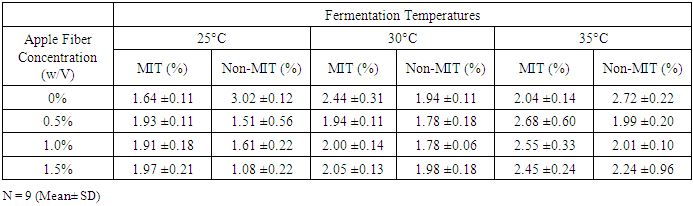
- The percentage of titratable acidity as % lactic acid (TA) in yogurts made with varying levels of apple fiber (0, 0.5, 1.0, and 1.5%) at different fermentation temperatures under non-MIT and MIT conditions is shown in Table 3. The TA ranged from 1.08 – 3.02%. It was determined that there was significant interaction between the fermentation temperature and the experimental (vibration) treatment at (p<0.05) effecting TA. The apple fiber concentration appeared to have no impact on the TA.
|
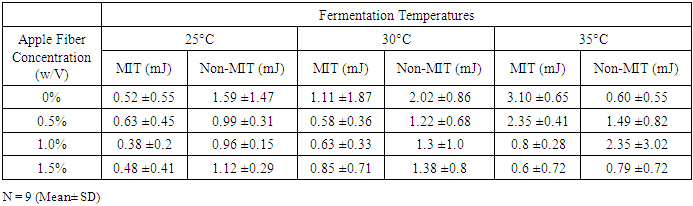
3.4. Adhesiveness
- Texture properties including adhesiveness and cohesiveness play an important role in the overall quality of yogurt. The adhesiveness of the yogurt shows adhesion to the texture analyzer probe and the greater the adhesiveness, the thicker the yogurt [39]. The adhesiveness values of yogurts made with varying levels of apple fiber (0, 0.5, 1.0, and 1.5%) at different fermentation temperatures under MIT and non-MIT conditions are shown in Table 4. The mean adhesiveness values in this project ranged from 0.38 – 3.10 mJ. It was determined that the MIT treatment and the fermentation temperature interaction had a significant impact (p<0.05) on the adhesiveness of the yogurt samples. The apple fiber appeared to have no impact on the adhesiveness. The non-MIT samples fermented at 25°C and 30°C had higher adhesiveness values then the MIT samples. However, the 0% and 0.5% apple fiber samples were higher than the non-MIT, but the 1.0% and 1.5% apple fiber concentration samples were lower than the non-MIT.
|
3.5. Cohesiveness
- The mean values for cohesiveness in yogurts made with varying levels of apple fiber (0, 0.5, 1.0, and 1.5%) at different fermentation temperatures under MIT and non-MIT conditions are shown in Table 5. Cohesiveness is related to a consumer’s acceptability of yogurt, hence why it is an important parameter for analyzing yogurt texture. Cohesiveness mainly displays the resistance of the yogurt to the pressure of the probe and the smaller the cohesiveness values the smoother the yogurt [39]. The mean cohesiveness values ranged from 0.38 – 0.66. The MIT treatment had a significant impact (p<0.05) on the cohesiveness of the yogurt samples. The other variables such as apple fiber concentration and fermentation temperature appeared to have no significant impact on the cohesiveness of the yogurt samples.
|
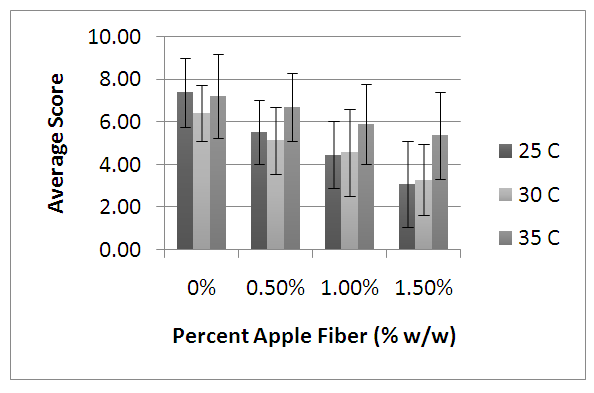
3.6. Sensory
- The mean data values for the 63 participants are shown in Figures 1 - 4. The consumer acceptability for flavor, appearance, color, and body and texture were all the attributes ranked for this particular consumer hedonic panel. The consumer ratings for likeness results indicate that fermentation temperature and apple fiber concentrations had a significant impact (p < 0.05) on the flavor and color of the yogurt made under MIT conditions. The apple fiber concentration had a significant impact (p < 0.05) on the appearance and the body of the yogurt made under MIT conditions.
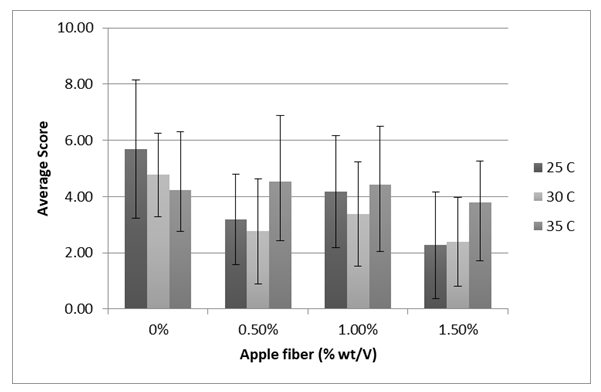 | Figure 1. The mean sensory attributes of flavor |
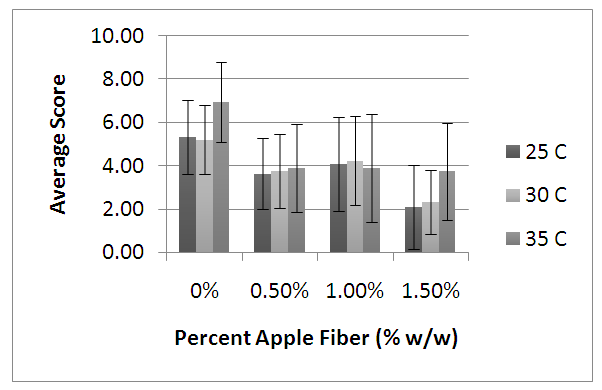 | Figure 2. The mean sensory attributes of appearance |
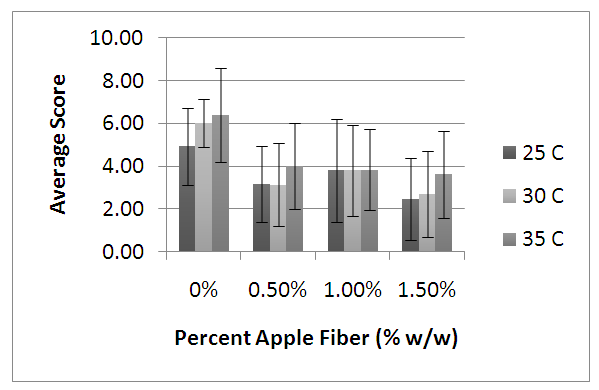 | Figure 3. The mean sensory attributes of body and texture |
 | Figure 4. The mean sensory attribute of color |
3.7. Equations
 | (1) |
 | (2) |
4. Conclusions
- It was determined that the fermentation temperature and the MIT treatment had an impact on the physicochemical properties of made-in-transit (MIT) yogurt. The apple fiber appeared to have had little to no impact on the physicochemical attributes of MIT yogurt, however it did seem to have a greater impact on the sensory attributes of the yogurt than the fermentation temperature. The use of MIT as a manufacturing technique is still in its infancy and there are a number of hurdles that must be overcome before it can be implemented by the dairy industry. However, further research is still required on finding ways to decrease whey syneresis in the MIT samples. In addition, the balance between fermentation temperature and time needs to be investigated within the context of the made-in-transit yogurt production to understand the effect of fermentation conditions on the final yogurt. While the apple fiber appeared to have not impacted the physiochemical properties of the yogurt it did however provided prebiotics to the consumer.
ACKNOWLEDGEMENTS
- The research team would like to thank Vivolac and J Tettenmaier for their generous contributions to this research project.
References
| [1] | Hutkins, R.W., Microbiology and Technology of Fermented Foods. 2006, Hoboken, NJ: Wiley Blackwell. |
| [2] | Tamin, A.Y. and R.K. Robinson, Yogurt Science and Technology. 2 ed. 1999, Baco Raton, FL: CRC Press. |
| [3] | Marshall, V.M., Flavour compounds in fermented milks. J. Soc. Dairy Technol., 1993. 46: p. 49 - 56. |
| [4] | Gahruie, H.H., et al., Scientific and technical aspects of yogurt fortification: A review. Food Science and Human Wellness, 2015. 4(1): p. 1-8. |
| [5] | O’Neil, J.M., D.H. Kleyn, and L.B. Hare, Consistency and compositional characteristics of commercial yogurts. J. Dairy Sci, 1979. 62: p. 1032 - 1036. |
| [6] | Jaworska, A., Made in Transit: a Supply Chain Concept for on the Way Growth. 2007, the Netherlands: Design Academy Eindhoven. |
| [7] | Nor‐Khaizura, M., et al., Designing Processing and Fermentation Conditions for Long‐Life Set Yoghurt for Made‐in‐Transit (MIT) Product. Journal of Food Process Engineering, 2014. 37(1): p. 19-26. |
| [8] | O’Neil, J.M., D.H. Kleyn, and L.B. Hare, Consistency and composition characteristics of commerical yogurts. J. Dairy Sci, 1979. 62: p. 1032 - 1036. |
| [9] | Singh, J., S.P. Singh, and E. Joneson, Measurement and analysis of US truck vibration for leaf spring and air ride suspensions, and development of tests to simulate these conditions. Packaging Technology and Science, 2006. 19(6): p. 309-323. |
| [10] | Usuda, H., et al., Basic study on the vibration analysis for development of three dimensional transport simulation model for produce. Nogyo Shisetsu (Journal of the Society of Agricultural Structures, Japan), 2006. 36(4): p. 215-222. |
| [11] | Garcia‐Romeu‐Martinez, M.A., S.P. Singh, and V.A. Cloquell‐Ballester, Measurement and analysis of vibration levels for truck transport in Spain as a function of payload, suspension and speed. Packaging Technology and Science, 2008. 21(8): p. 439-451. |
| [12] | Jarimopas, B., S.P. Singh, and W. Saengnil, Measurement and analysis of truck transport vibration levels and damage to packaged tangerines during transit. Packaging Technology and Science, 2005. 18(4): p. 179-188. |
| [13] | Rissi, G.O., et al., Measurement and analysis of truck transport environment in Brazil. Packaging Technology and Science, 2008. 21(4): p. 231-246. |
| [14] | Singh, S.P., et al., Measurement and analysis of truck and rail shipping environment in India. Packaging Technology and Science, 2007. 20(6): p. 381-392. |
| [15] | Hinsch, R.T., et al., Vibration of fresh fruits and vegetables during refrigerated truck transport. Transactions of the ASAE, 1993. 36(4): p. 1039-1042. |
| [16] | Li, H. and R. Jansen, Mechanical distribution hazards and cushion design. Packaging Technology and Science, 1991. 4(2): p. 109-115. |
| [17] | Jones, C., J. Holt, and D. Schoorl, A model to predict damage to horticultural produce duringtransport. Journal of agricultural engineering research, 1991. 50: p. 259-272. |
| [18] | Lu, F., et al., Analysis of shock and vibration in truck transport in Japan. Packaging Technology and Science, 2008. 21(8): p. 479-489. |
| [19] | Amatayakul, T., F. Sherkat, and N.P. Shah, Syneresis in set yogurt affected by EPS starter cultures and levels of solids. Internation Journal of Dairy Technology, 2006. 59(3): p. 216 - 221. |
| [20] | Lawless, H.T. and H. Heymann, in Sensory Evaluation of Food: Principles and Practices, Springer, Editor. 1998, Chapman & Hall: New York, NY. p. 430 - 479. |
| [21] | Fernández-García, E. and J.U. McGregor, Fortification of sweetened plain yogurt with insoluble dietary fiber. Zeitschrift für Lebensmitteluntersuchung und -Forschung A, 1997. 204(6): p. 433-437. |
| [22] | Hashim, I.B., A.H. Khalil, and H.S. Afifi, Quality characteristics and consumer acceptance of yogurt fortified with date fiber. Journal of Dairy Science, 2009. 92(11): p. 5403-5407. |
| [23] | Issar, K., P.C. Sharma, and A. Gupta, Utilization of Apple Pomace in the Preparation of Fiber-Enriched Acidophilus Yoghurt. Journal of Food Processing and Preservation, 2017. 41(4): p. 6. |
| [24] | Lucey, J.A., Cultured dairy products: an overview of their geltation and texture properties. Internation Journal of Dairy Technology, 2004. 57: p. 77 - 84. |
| [25] | Harwalkar, V.R. and M. Kalab, Susceptibility of yoghurt ot syneresis. Comparison of centrifugationa nd drainage methods. Milchwissenschaft, 1983. 38: p. 517 - 522. |
| [26] | Hassan, L.K., et al., Physico-chemical properties of yoghurt containing cress seed mucilage or guar gum. Annals of Agricultural Sciences, 2015. 60(1): p. 21-28. |
| [27] | Milk and cream, in Code of Federal Regulations. 2006. p. 304-305. |
| [28] | Australia and New Zealand Food Standards Code. 2010; Available from: http://www.foodstandards.gov.au/code/Pages/default.aspx. |
| [29] | Basiri, S., et al., Flaxseed mucilage: A natural stabilizer in stirred yogurt. Carbohydrate polymers, 2018. 187: p. 59-65. |
| [30] | Dal Bello, B., et al., Healthy yogurt fortified with n-3 fatty acids from vegetable sources. Journal of dairy science, 2015. 98(12): p. 8375-8385. |
| [31] | Fernandez-Garcia, E. and J. McGregor, Fortification of sweetened plain yogurt with insoluble dietary fiber. Zeitschrift für Lebensmitteluntersuchung und-Forschung A, 1997. 204(6): p. 433-437. |
| [32] | Hashim, I., A. Khalil, and H. Afifi, Quality characteristics and consumer acceptance of yogurt fortified with date fiber. Journal of dairy science, 2009. 92(11): p. 5403-5407. |
| [33] | Issar, K., P. Sharma, and A. Gupta, Utilization of Apple Pomace in the Preparation of Fiber‐Enriched Acidophilus Yoghurt. Journal of Food Processing and Preservation, 2017. 41(4): p. e13098. |
| [34] | Mohamed, A., A.F. Zayan, and N. Shahein, Physiochemical and sensory evaluation of yoghurt fortified with dietary fiber and phenolic compounds. Life Sci J, 2014. 11: p. 816-822. |
| [35] | Muniandy, P., A.B. Shori, and A.S. Baba, Comparison of the effect of green, white and black tea on Streptococcus thermophilus and Lactobacillus spp. in yogurt during refrigerated storage. Journal of the Association of Arab Universities for Basic and Applied Sciences, 2017. 22(1): p. 26-30. |
| [36] | Ramirez-Santiago, C., et al., Enrichment of stirred yogurt with soluble dietary fiber from Pachyrhizus erosus L. Urban: Effect on syneresis, microstructure and rheological properties. Journal of Food Engineering, 2010. 101(3): p. 229-235. |
| [37] | Tan, P.Y., et al., Effects of storage and yogurt matrix on the stability of tocotrienols encapsulated in chitosan-alginate microcapsules. Food Chemistry, 2018. 241: p. 79-85. |
| [38] | Vianna, F.S., et al., Development of new probiotic yoghurt with a mixture of cow and sheep milk: effects on physicochemical, textural and sensory analysis. Small ruminant research, 2017. 149: p. 154-162. |
| [39] | Feng, C.J., et al., Quality characteristics and antioxidant activities of goat milk yogurt with added jujube pulp. Food Chemistry, 2019. 277: p. 238-245. |
| [40] | Staffolo, M.D., et al., Influence of dietary fiber addition on sensory and rheological properties of yogurt. International Dairy Journal, 2004. 14(3): p. 263-268. |