-
Paper Information
- Paper Submission
-
Journal Information
- About This Journal
- Editorial Board
- Current Issue
- Archive
- Author Guidelines
- Contact Us
International Journal of Food Science and Nutrition Engineering
p-ISSN: 2166-5168 e-ISSN: 2166-5192
2018; 8(2): 45-51
doi:10.5923/j.food.20180802.04

Production and Quality Evaluation of Gouda Cheese Produced at Small Scale Level
 Abstract
 Reference
 Full-Text PDF
 Full-text HTML
Abdel Moneim E. Sulieman1, 2, Ohag M. Ohag2, Hassan M. Hassan3, Elnour Abdelmageed1, Vajid N. Veetil1
1Department of Biology, Faulty of Science, University of Hail, Kingdom of Saudi Arabia
2Food Science and Technology, Faculty of Engineering and Technology, University of Gezira, Wad-Medani, Sudan
3Kenana Freizlands Company, Kenana, Sudan
Correspondence to: Abdel Moneim E. Sulieman, Department of Biology, Faulty of Science, University of Hail, Kingdom of Saudi Arabia.
| Email: |  |
This work is licensed under the Creative Commons Attribution International License (CC BY).
http://creativecommons.org/licenses/by/4.0/

The present study aimed to produce Gouda cheese at laboratory level and evaluation of the resultant cheese, in addition to its acceptance by panelists. Cow milk samples were collected and analyzed for chemical componentsduring three consecutive seasons. Slight differences were found in most of the chemical components during the three seasons, however all milk samples suited the production of Gouda cheese at laboratory level. The manufactured Gouda cheese was chemically evaluated and subjected to sensory analyses, and compared with standard Dutch Gouda cheese. The results show that the chemical components were 55% moisture, 41% fat, 24.5% protein. The contents of Na, potassium K and Ca of Laboratory-made Gouda cheese were non-significantly different from those of the standard Dutch Gouda cheese. Non-significant differences were noticed between the manufactured and Dutch Gouda cheese in chemical composition. The sensory evaluation revealed that Gouda cheese was generally acceptable by the panelists providing that the high contents of fat made its taste unacceptable to some of them. The study recommends encouraging the local dairy industry to introduce Gouda cheese so as to meet the local needs.
Keywords: Milk, Fat, Protein, Lactose, Sensory evaluation
Cite this paper: Abdel Moneim E. Sulieman, Ohag M. Ohag, Hassan M. Hassan, Elnour Abdelmageed, Vajid N. Veetil, Production and Quality Evaluation of Gouda Cheese Produced at Small Scale Level, International Journal of Food Science and Nutrition Engineering, Vol. 8 No. 2, 2018, pp. 45-51. doi: 10.5923/j.food.20180802.04.
Article Outline
1. Introduction
- Cheese is the generic name for a group of fermented milk-based food products produced throughout the world in an awesome assortment of flavors, textures, and forms [1]. As cheese became known throughout the continent, production methods varied to develop new types of cheese. While the middle eastern cheeses were commonly a delicate and smooth, Ricotta or crumbly Feta, Europeans commonly squeezed what's more and aged their cheese in caves, eventually developing the Gouda, Brie, and cheddar we know today. Sandine and Elliker [2] suggested that there were more than 1,000 varieties of cheese. Walter and Hargrove [3] characterized about 400 varieties and listed the names of a further 400, while Burkhalter [4] classified 510 varieties. Cheese making remained a craft until relatively recently. With the steady procuring of learning about the chemistry and microbiology of milk and cheese, it ended up noticeably conceivable to acquire control over the cheese making process. Few new varieties have evolved as a result of the increased knowledge, but existing varieties have become better defined and their quality has become more consistent [5].Gouda, or "How-da" as local people say, is a Dutch cheese named after the city of Gouda in the Netherlands. If truth be told, standout amongst the most prominent cheeses on the planet, representing 50 to 60 percent of the world's cheese utilization. It is a semi-hard cheese celebrated for its rich, unique flavor and smooth texture. The original cheese markets in Gouda is one of the last standing commercial cheese markets in the Netherlands. Since the name isn't secured, it has turned into a non specific classification for all cheeses produced and sold under the name Gouda [6]. Gouda is typically made from pasteurized cow’s milk although some artisan varieties use sheep’s or goat’s milk to produce cheeses that are going to be aged for a long time. There are seven different types of Gouda cheese, categorized depending on age.In America, smoother and less flavorful commercial Gouda is mainstream than Dutch Gouda. Craftsman in Netherlands may produce Dutch Gouda using raw milk as well as pasteurized. To improve the flavor of the cheese, herbs, seasonings, and nuts might be mixed. In Netherlands, aged Gouda is generally used to richen soups, sauces.Kenana Friesland Company, Sudan introduced gouda cheese industry as a part of its activities, and since most of the Sudanese people were not accustomed to this type of cheeses and consume mainly white cheese, this study aimed to evaluate the chemical constitutes of milk used at Kenana Dairy Factory for cheese production in three seasons (winter, summer and autumn), production of Gouda cheese at laboratory level (LGC), assessment of LGC chemical components and comparing these components with those of Standard Dutch Gouda cheese.
2. Materials and Methods
2.1. Preparation of Milk Samples
- Cow's milk samples were collected at different seasons (winter, summer and autumn) from Kenana dairy farm during the period (2006-2007). The samples were placed in steel sterilized containers (1000 liters), and then transported under aseptic conditions to the quality control laboratory of Kenana Friezland Diary (KFD).
2.2. Determination of Physico-Chemical Properties of Milk
- Physico-chemical properties of milk samples The protein content was determined by Kjeldahl procedure according to AOAC [7]. Three major steps were conducted including digestion of the samples (milk or cheese) by concentrated sulfuric acid, followed by distillation of the liberated ammonia, and then theexcess alkali was titrated using (0.1N) hydrochloric acid, until color changed to light purple. The protein content was determined by multiplying the percentage of nitrogen by the empirical factor 6.36, as follow:
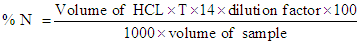 Then, % protein = % N ×6.36Where: 14 = The molecular weight of nitrogen.T = Normality of acid, HCLN = Nitrogen contentFor the determination of fat content, Gerber tube was used to determine fat content of different samples according to the method described by DE Vleeschauwer et. al. [8]. The sample was homogenized by placing it in water bath at 40°C and cooled to 20°C. The butyrometer was filled with 10 ml H2SO4. 11 ml sample was pipetted in to the butyrometer. Then 2 ml amyl alcohols were added and the butyrometer was closed with a stopper. The contents were shaken vigorously until all protein particles were dissolved. The butyrometer was then placed in a water bath at 65°C for 5 minutes (fat column under the water surface). Moving the stopper regulated the fat column. The butyrometer was then placed in a centrifuge for 5 minutes, and then placed in a water bath at 65°C for 5 minutes. The fat content was read directly on the butyrometer scale in g/100 g sample.The procedure of AOAC [9] was used for the determination of lactose. Firstly: the invert sugar was determined by pipetting 5ml from each Fehling solutions A + B in a conical flask and then 10ml of distilled water were added. Then 3-5 drops of methylene blue were added as an indicator. Then the lactose standard was titrated until the final red precipitate occurred. Then Fehling factor was calculated from the following equation.Fehling factor: The titration × the concentration after the lactose was determined by preparing 10ml of milk (steamed or without treatment) in 100ml volumetric flask. Then the volume was completed to 100ml by adding distilled water. Then the mixture was filtered. Finally the sample was titrated against Fehling solution (A + B) as before. Then the concentration of lactose was calculated from the following equation:
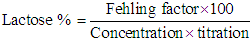 The solids non-fat (SNF) contents in milk were calculated by using the following formula:
 The total solids in milk samples was determined according to AOAC (2000) modified method. In that method 3 grams of samples were weighed into a dry clean crucible dish, then heated on water bath for 10-15min. the dish was then placed in an oven at 80°C overnight (16 hours) cooled down in a desiccators and weighed.The total solids (TS) content was calculated from the following equation:
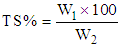 Where:W1 = weight of the sample after drying.W2 = weight of the sample before drying.The density was determined according to Foley and Murphy [10]. In this method, 250 ml sample was mixed by rotating and inverting its container, vigorous shaking was avoided. Sufficient sample was added to a hydrometer to ensure some overflow when the hydrometer was inserted. The hydrometer was held by its stem, lowered into the sample until approximately reaching its equilibrium position. When the hydrometer came to rest, the reading on top of the meniscus was recorded and the temperature of the milk was recorded.
2.3. Preparations of Gouda Cheese at Laboratory Level
- Gouda cheese was prepared at the laboratory level according to the procedure followed at Kenana Dairy Friesland Company. Firstly, 300 liters of milk were pasteurized in a pasteurizer for 30 minutes at 72°C, and then cooled to 30°C. Then 75 ml of calcium chloride and 150 ml of sodium nitrate were added to the cooled milk. After that 3 liter of starter culture were added (1% of milk), and the mixture was blended. After 15 minutes, 4 grams rennet and 3.8 ml of annatto coloring matter were added to mixture. The mixture was blended for 15 minutes and was let for 3 hours until the curds separated from the whey. The curds were then washed by water and pressed into circular moulds for 2 hours. Next, the cheese was soaked in a 20% brine solution. After immersion in the brine for 3 hours, the cheese was then dried for 2 days before being coated. Then cheese was placed in a cheese curing room for 6 weeks at a temperature of 10°C.
2.4. Determination of Physico-Chemical Properties of Cheese
- The ash content of cheese samples was determined according to AOAC [11], two grams sample were weighted into a suitable crucible and evaporated to dryness on a water bath, then placed in a muffle furnace at 550°C until ash was carbon-free (2-4hours), cooled in desiccators and weighed. Then ash % was calculated as follows:
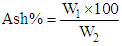 Where:W1 = weight of ash.W2 = weight of the sample.Dry matter content of cheese samples was determined according to AOAC [9] modified method. In that method 3 grams of samples were weighed into a dry clean crucible dish, then heated on water bath for 10-15min. the dish was then placed in an oven at 80°C overnight (16 hours) cooled down in a desiccator and weighed. The dry matter (DM) content was calculated from the following formula:
 Where:W1 = weight of the sample after drying.W2 = weight of the sample.The pH of Gouda cheese samples were measured using digital pH meter (PN 9410. GL. Britain). The pH meter was calibrated with buffers of pH 4 and 7. The cheese samples were stirred using magnetic stirrer and the pH values was recorded according to AOAC [12].The titermetric determination of acidity of cheese samples was accomplished according to the AOAC (1980) method. The sample taken for determination of cheese acidity was 5m, which was pipetted into a 100ml conical flask. The pipette was washed with 5ml distilled water, and then six drops of phenolphthalein indicator were then added. The sample was then titrated with 0.1NNaOH until a stable pink color was formed. The titrable acidity was expressed as % lactic acid from the following formula.
 Where 90 is the amount of lactic acid reacted with 1.0ml of 0.1N NaOH.
2.5. Determination of Minerals Ca, Na and K
- The minerals Ca, Na and K were determined using Flame Photometer following the method illustrated by Kirk and Sawyer [13]. Three grams from the cheese samples were ignited at 600°C overnight then wetted using distilled water and transferred through a filter paper into a 100 ml conical flask. 10 ml of conc. HCl were added to the conical flask, and lastly the volume was completed using distilled water.For stock solution preparation, on gram of metal (either NaCl, KCl or KCl) was weighed and dissolved in one liter of distilled water.Standard solution were prepared by adding 2, 4, 6, 8 or 10 ml (of the stock solutions) to a 100 ml conical flask and completed to volume using distilled water. Then readings were taken using flame photometry and the standard curve was formed.Calculation:
2.6. Cheese Yield
- The resulting cheese was weighted immediately after ripened using a weighting balance (Meuler H33AR type), the weights of cheese sample was recorded. The yield of the cheese was calculated as follows:
2.7. Sensory Evaluation
- The gouda cheese was subjected to sensory evaluation using 15 panelists. The panelists were asked to rate or to judge samples to be tasted under 9 scales, about the texture, visual colour, flavour and acceptability. Each panelist was provided with water for rinsing. The samples were given codes before being tested.
2.8. Statistical Analysis
- Statistical analyses were performed by ANOVA procedures using SAS PROCGLM/STAT for all chemical components of cheese. Significant differences (p<0.05) among means were identified using Duncan multiple range test (SAS/STAT Software [14].
3. Results and Discussion
3.1. Chemical Analyses for Milk Samples
- Figures (1-3) show the physicochemical properties of raw cow’s milk samples. The fat content ranged between 3.88-4.03%, 4.00-4.13% and 4.13-4.37% in the three seasons: summer, winter and autumn, respectively. The highest fat content was noticed in autumn season. This level was higher than those reported by McSweeney and Fox [15]; Bille et. al. [16], Suleiman [17] and Abou-Dobara et. al. [18] which were 3.70%, 3.65%, 3.3 and 3.6%, respectively, while Hamad and Baiomy [19] determined an average value of 4.28% in their cow milk samples. The protein content of milk (3.55%) was similar in the three seasons; this level was close to that determined by Abou-Dobara et. al., [18] who reported 3.6%. However, McSweeney [15] and Suleiman [17] reported relatively lower values for protein content in cow milk samples. Also the lactose content of milk was similar in the three seasons (5.6%), while McSweeney [15] and Suleiman [17]) reported a lower value (4.8% and 4.6%), respectively. Bille et. al [16] reported 5.3%. Other components of milk such as solids non-fat (SNF) was 10%, while Suleiman [17] reported a value of 8.46%. Comparison of the overall composition (fat, protein, lactose, total solids contents and non-solids contents) of cow milk revealed that slight differences were existed between in the three seasons, however, the only difference was found in the fat content which was 4.07%, 3.9% and 4.24% in winter, summer and autumn (Figure 4).
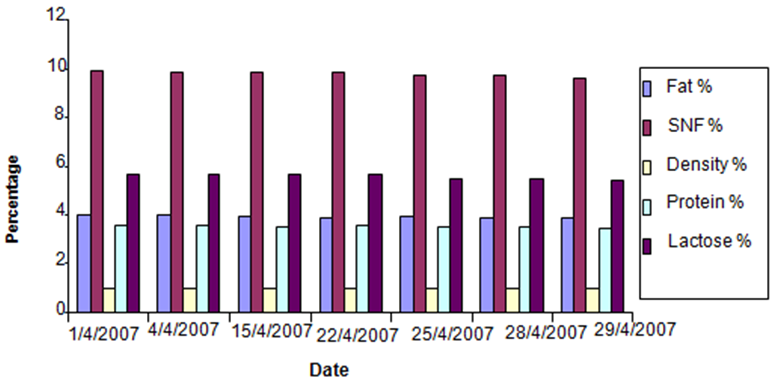 | Figure 1. Milk Analyses in Sept |
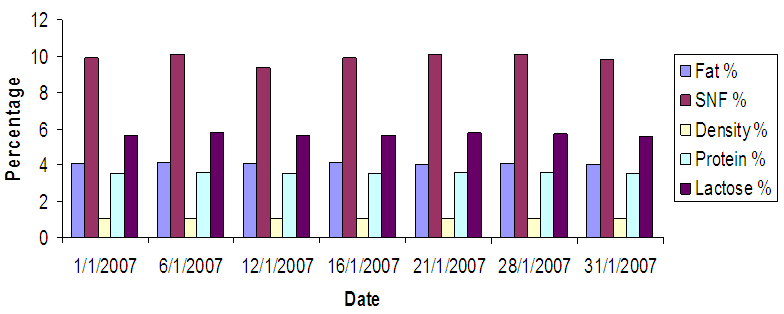 | Figure 2. Milk Analyses in Jan |
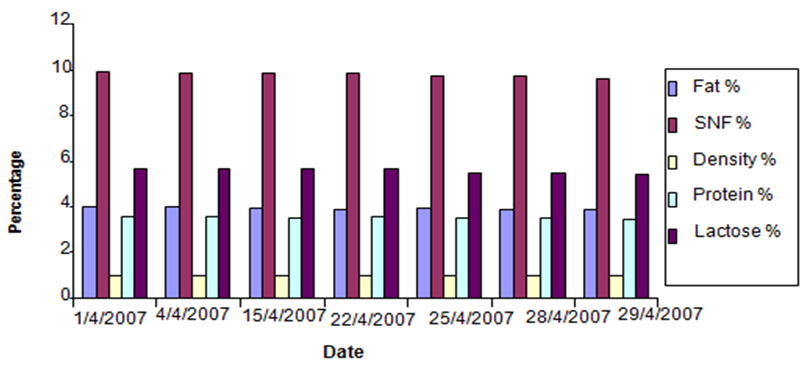 | Figure 3. Milk Analyses in April |
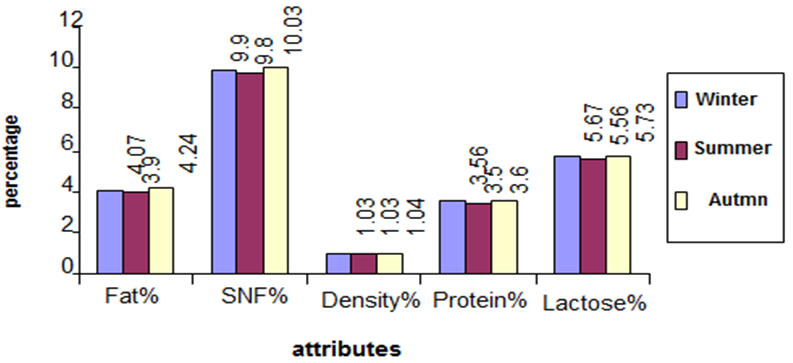 | Figure 4. Comparisons between three seasons |
3.2. Chemical Analysis of Gouda Cheese
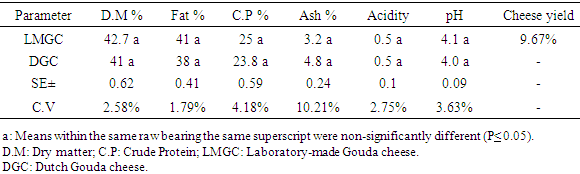
- Data in Table (1) shows the chemical analysis of Gouda cheese, laboratory-made Gouda cheese (LMG) and Dutch Gouda cheese (DGC). The dry matter averaged 42.7 ± 0.6% and 41 ± 0.6% in LMGC and DGC, respectively. These ranges were lower than the range reported by CODEX (2013) which was 48-62%. Moreover, value in LMGC was lower than that in Sudanese white cheese determined by Osman and Omer [22], which was 52.77%.
|
|
3.3. Sensory Evaluations
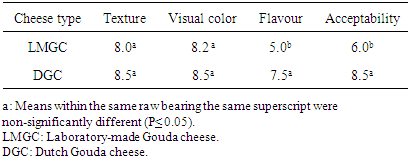
- Table (3) shows the sensory evaluation of the laboratory made cheese (LMGC) and Dutch Gouda cheese (DGC). The panelists gave high scores for most of the sensory attributes for both types of Gouda cheese. There were non-significant differences (p < 0.05) of LMGC cheese texture and visual color, while the flavor and acceptability of LMGC were significantly lower than those of DGC. However, some of panelists did not accept the product due to its high content of fat. Generally, most of the Sudanese peoples hardly accept new types of foods; therefore they prefer the old type of cheese (Sudanese white cheese) than Gouda cheese.
|
4. Conclusions
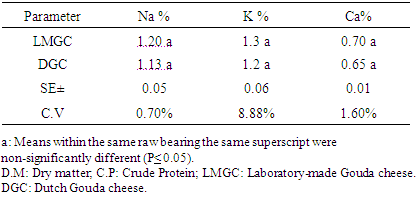
- Slight differences were found in most of the chemical components of milk used to prepare Gouda cheese during the three seasons, however all milk samples suited the production of gouda cheese at laboratory level. The manufactured Gouda cheese was chemically evaluated and subjected to sensory analyses, and compared with standard Dutch Gouda cheese. The contents of Na, potassium K and Ca of Laboratory-made Gouda cheese were non-significantly different from those of the standard Dutch Gouda cheese. The high contents of fat made its taste unacceptable to the some but generally it is accepted. No significant differences were noticed between the manufactured and Dutch Gouda cheese in chemical components. It is highly recommended to encourage the local industry to produce Gouda cheese and other processed cheeses to meet the domestic needs, further research is required to explore better coating materials for the cheese.
ACKNOWLEDGEMENTS
- Special thanks and gratitude are to Kenana Freizlands Company which support execution of this project by providing the space beside the technical assistance.