-
Paper Information
- Paper Submission
-
Journal Information
- About This Journal
- Editorial Board
- Current Issue
- Archive
- Author Guidelines
- Contact Us
International Journal of Food Science and Nutrition Engineering
p-ISSN: 2166-5168 e-ISSN: 2166-5192
2018; 8(2): 37-44
doi:10.5923/j.food.20180802.03

Analyzes of Minerals, Nutritional Values, Anti-Nutritional and Microorganisms in Cooked Seed Meal of Treculia perrieri after 2, 6 and 12 Months of Storage
 Abstract
 Reference
 Full-Text PDF
 Full-text HTML
Armand Zafilaza
Faculte of Sciences, Biochimie, Biotechnology and Microbiology, University Antsiranana, Madagascar
Correspondence to: Armand Zafilaza, Faculte of Sciences, Biochimie, Biotechnology and Microbiology, University Antsiranana, Madagascar.
| Email: |  |
Copyright © 2018 Scientific & Academic Publishing. All Rights Reserved.
This work is licensed under the Creative Commons Attribution International License (CC BY).
http://creativecommons.org/licenses/by/4.0/

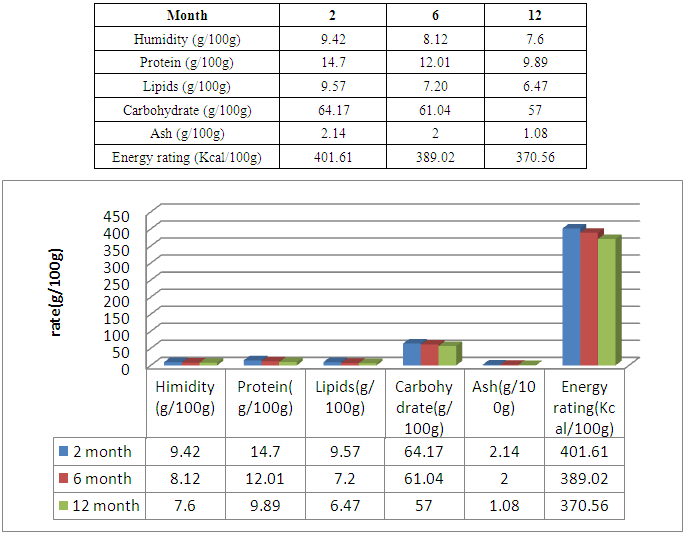
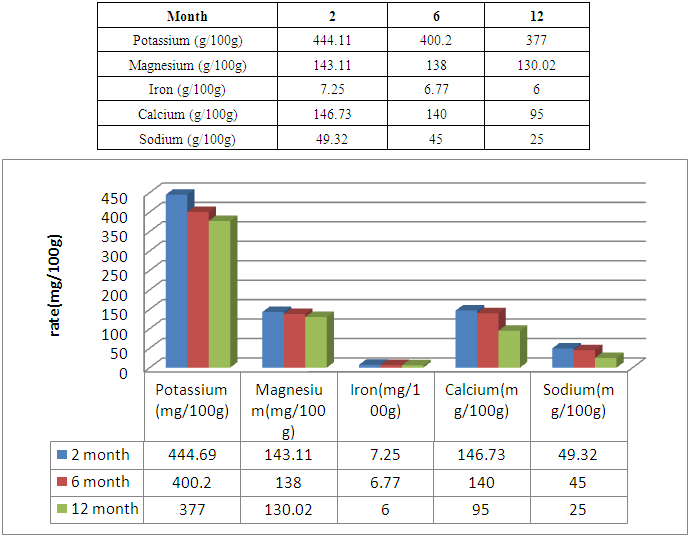
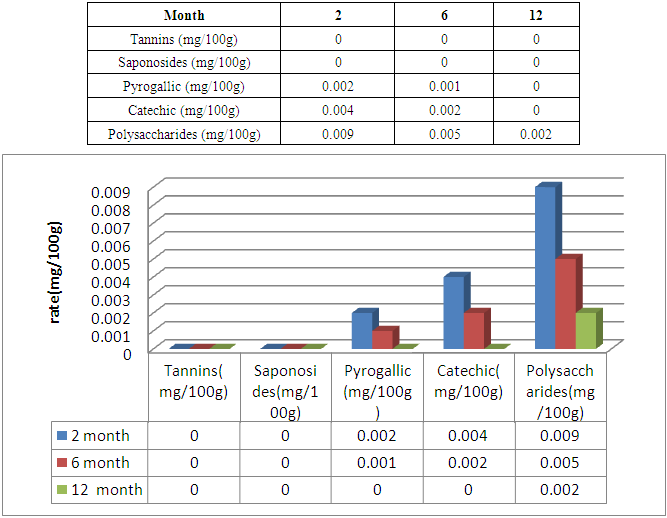
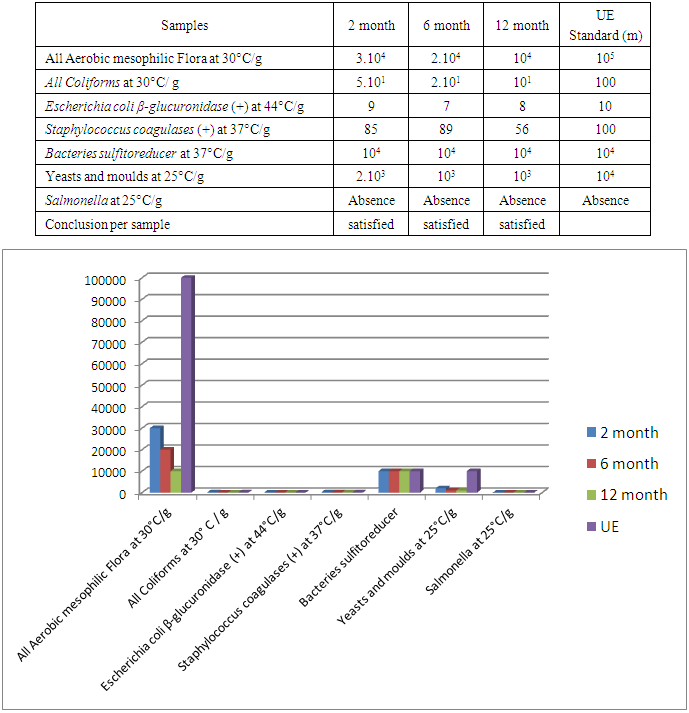
The flour of Treculia perrieri comes from cooked seed is rich in nutrients. It is necessary to study nutritive values, minerals, anti-nutrients and microorganisms after 2, 6 and 12 months of storage. The protein decreases with time 14.7g / 100g for 2 months and 12.01g / 100g in 6 months of preservation against 9.89g / 100g in 12 months. Similarly for lipids in 12 months 6.89g / 100g the remaining rate against 9.57g / 100g in 2 months and 7.20g / 100g in 6 months of storage. Carbohydrate is rich in cooked Treculia perrieri flour; the rate decreases if the preservation time is long. For 2 months of preservation the rate is 64.17g / 100g and 61.04g / 100g in 6 months against 57g / 100g for 12 months. Regarding ash, the rate decreases from 2 months, 6 months and 12 months of storage, so 2.14g / 100g, 2g / 100g and 1.08g / 100g. The presence of water in the flour Treculia perrieri disappear as and conservation, 9.42g / 100g in 2 months and 8.12g / 100g for 6 months against 7.6g / 100g in 12 months. The calorie in Tsitindry decreases 370.56Kcal / 100g in 12 months against 389.02Kcal / 100g for 6 months and 401.61Kcal / 100g for 2 months. The Ca, Mg, K, Fe, Na mineral contents are determined by atomic absorption spectrophotometry. Ca is very sensitive during storage. It decreases with time 146.73mg / 100g in 2 months and 140mg / 100g for 6 months against 95mg / 100g for 12 months. The rate of Mg is average in the Tsitindry. After 12 months of storage, it remains 130.02mg / 100g against 138mg / 100g in 6 months and 143.11mg / 100g for 2 months of storage. The rate of Fe decreases, in 2 months of storage, it remains 7.25mg / 100g and 6.77mg / 100g in 6 months against 6mg / 100g for 12 months of storage. Tsitindry is rich in K, the rate falls during conservation. 444.11mg / 100g in 2 months of storage and 400.02mg / 100g for 6 months against 377mg / 100g in 12 months. After Fe, Na is in small quantities in Tsitindry; in 2 months of conservation the rate of Na is 49.32mg / 100g and 45 mg / 100g for 6 months against 25mg / 100g for 12 months of storage. For antinutritional analysis in Treculia perrieri using specific chemical reagents by method of Fong et al. Antinutrients are present in the cooked meal of Treculia perrieri but in small quantities. The rate of tannins and saponosides are 0mg / 100g for 2, 6 months and 12 months storage. Regarding the pyrogallic the rate remains 0 mg / 100g in 12 months of storage against 0.002mg / 100g in 2months and 0.001mg / 100 for 6 months of storage. During storage, it is necessary to analyze the different types of microorganisms in the cooked meal of Treculia perrieri. In 2 months of storage the level of microorganism as aerobic total mesophilic flora at 30°C / g at 3.104; 2.104 for 6 months and 104 in 12 months. For total coliforms at 30°C/ g, the rate remains below the EU standard. 5,101 for 2 months of storage and 2,101 for 6 months of storage against 101 in 12 months of storage. The number of Escherichia coli-glucuronidase (+) at 44°C / g is below the EU standard; 9 in 2 months, 7 in 6 months and 8 in 12 months of storage. The number of Staphylococcus coagulases (+) at 37°C/ g in 2 months remains 85, 89 in 6 months and 56 in 12 months. The EU gives 104 the maximum rate of sulfored bacteria at 37°C / g in one gram of flour, but in our results the rate remains 104 over 2, 6 months until 12 months of storage. As for Yeasts and molds at 25°C / g, the number is 2,103 in 2 months, 103 in 6 months and 103 in 12 months against 104 the EU standard. During storage for 2, 6 and 12 months, the number of Salmonella at 25°C/ g remains absent.
Keywords: Treculia perrieri, Antinutrients, Nutritional value, Microbiological analyzes, Mineral study
Cite this paper: Armand Zafilaza, Analyzes of Minerals, Nutritional Values, Anti-Nutritional and Microorganisms in Cooked Seed Meal of Treculia perrieri after 2, 6 and 12 Months of Storage, International Journal of Food Science and Nutrition Engineering, Vol. 8 No. 2, 2018, pp. 37-44. doi: 10.5923/j.food.20180802.03.
Article Outline
1. Introduction
- Treculia perrieri are wet woods below 300m, alluvium; it blooms in the months of July and October. The ripe fruits are between January and February. The "Tsitindry" is very widespread in the DIANA region, more precisely the Ambanja district (Sambirano). It is also located in western Madagascar, Menabe, Morondava, Befandriagna. Treculia perrieri (Tsitindry) is a plant endemic to Madagascar. It is classified in:Class: EquisetopsidaSubclass: MagnoliidaeSuperorder: RosanaeOrdrer: RosalesFamily: MoraceaeGenus: TreculiaSpecies: Treculia perrieriVariety: Treculia perrieri var. perrieri Vernacular names: Katoka, Tobory, Tsipa, Titindry [14]Treculia perrieri is a tree up to 30m deep trunk furrowed winged buttresses, bark smooth and greyish. Young pubescent twigs. Leaves persistent petiole puberulous at first, 8-12 mm. Leafy blade, angular or obtuse and unequilateral at the base rounded or acute at the apex, wider in the lower half than the upper half, 11-18 cm long and 4-7 cm long; About 15 lateral veins on each side; thin nerves regularly crosslinked. Dioecious flowers rarely monoecious, the receptacles males ordinarily on young twigs, females on aged twigs [14].Male receptacles, obovate with narrowed base, up to 4cm by 3. Flowers intertwined with peltate bracts in crest, welded on 2/3 of their length, exceeded by the flowers at anthesis. Perianth hyaline short-bellied with 3-4 small ciliate teeth and 4 exserted stamens. Female receptacles of similar shape, but larger (6 out of 5). Female flowers in several rows, interspersed with peltate bracts, the stigmata protrude alone. Two stigmatic branches of 5 to 7mm slightly papilleuses, obtuse, surmounting a hairy style of about 3mm. Syncarp sessile irregular shape exceeding 30 cm and 5 kilos, fleshy, presenting towards the surface 6-7 rows of ovoid achenes about 1 cm. Woody pericarp slender, brown on dry seed without albumen; thin integument. Unequal cotyledons completely folded the notched, bilobed tops receding at the level of the radicle, the widest enveloping the other in a tongue [14].The mastery of the different parameters is really interesting. The minerals, nutrient levels are important contained Treculia perrieri powder. It is really important exploited as a staple of malnourished children in Madagascar. The presence of Potassium, Calcium and Magnesium with high levels are considered second category food after rice during the lean period. Treculia perrieri is very abundant in Northern Madagascar. To go out in the food problem; the Malagasy state must exploit the natural wealth. The analysis of the elements after storage is important because it assures the consumer and gives an accurate indication of the element rates after 2.6 and 12 months of storage. The four analyzes are necessary- mineral analysis- nutritional value analysis- antinutrients analysis- and analysis of micro-organisms
2. Methods and Materials
2.1. Flour Preparation of Treculia perrieri
- The seeds are extracted from ripe fruit. And after, the seeds are separated from the pods and boiled for a few moments so that the pod around them bursts. Drain and dry the pods before shelling them for ease. After the cotyledons are sun-dried then the cotyledons are ground to obtain the Treculia perrieri flour.
2.2. Analyzes of Minerals after 2, 6 and 12 Months of Conservation
- The flour is put into a muffle oven at 550°C to obtain a white ash containing the minerals.The Ca, Mg, K, Na mineral contents are determined by atomic absorption spectrophotometry. After wetting, 5 to 25 ml of concentrated hydrochloric acid are added. The suspension is then boiled and filtered. The phosphorus level is determined by colorimetry or spectrophotometry at 560 nm [6, 8, 12, 25].
2.3. Nutritional Value Analysis after 2, 6 and 12 Months of Conservation
- Lipids: the sample is treated with hexane. Five grams of sample are introduced into extraction cartridges for six hours. The extracted extract is placed in a drying oven at 75°C. for one hour until a constant mass is obtained [25, 31, 34, 42].- Crude ash: the 5 g sample taken is placed in a muffle furnace set at 550°C. White ash is weighed after cooling.- The proteins:Two protein extraction techniques are used.a) The flour obtained is suspended in a sodium phosphate buffer (0.05 mol.l-1 at pH 8.0) at a rate of 4 g in 9 ml. The debris is removed by centrifugation at 20,000 g. Proteins from the supernatant and the centrifugation pellet are precipitated in the presence of TCA at 50 μl-1. They are dissolved in decinormal soda and measured according to the LOWRY method [6, 10, 25].b) The flour is suspended in a sodium phosphate buffer (1 mol.l-1 at pH 0.8) at a rate of 1 g in 9 ml and milled under constant pressure (420 kg / cm2). Cell debris is removed and the suspension centrifuged at high speed under the conditions described in the art. The soluble proteins obtained, according to the two techniques, are separated into two groups by chromatography and the supernatants extracted after high speed centrifugation are dialyzed for 16 hours against a sodium phosphate tap (0.01 mol.l-1 at pH 8, 0) containing urea at a final concentration of 8 mole.l-1. The dialysates are then chromatographed in a column of diethylaminoethylcellulose equilibrated with the same buffer. In this method, the cationic protein retained by the resin and in other cases the anionic proteins remain adsorbed. The cationic and anionic proteins separated by chromatography are hydrolysed at 140°C. for 24 h in the presence of 6N HCl. Their respective amino acid composition is determined after analysis of hydrolysates [6, 9, 10, 13, 50].- Carbohydrates are determined spectrophotometrically at 490 nm. The Fischer and Stein method is applied and uses DNS at 540 nm to evaluate soluble sugars [13, 17].
2.4. Determination of Antinutritional Factors of Treculia perrieri "Tsitindry" Meal after 2, 6 and 12 Months of Storage
- The determination of the total phenol content was based on the reaction with the Folin Ciocalteu reagent. The blue color obtained has a maximum absorption at 725 nm [31, 37, 40]. The tannins were determined according to the spectrophotometric method using acidified vanillin and tannic acid as standard (λmax = 500 nm). Determination of saponin content was made using the aerosimetric method based on the formation of stable foams by Koziol saponins [8, 14, 15, 21, 26].
2.5. Microbiological Analysis after 2, 6 and 12 Months of Storage of the Starches of "Tsitindry"
- The microbiological quality of the starch of "Tsitindry" is the subject of an interesting survey after the manufacture and the storage, because the starch is very sensitive to mildew because of the humidity during the drying. The micro-organisms in the starch of "Tsitindry" preexist in the raw matter before his transformation, but can be brought also accidentally in the starch. The present micro-organisms are harmful micro-organisms constituted by pathogenic germs, of the micro-organisms of change and contamination [1, 2, 3, 4].a) Studied samplesMeal after cooking storage b) Types of the studied microorganismes- flora aerobe total mésophile to 30°C - Total Coliformeses to 30°C - Escherchia coli - glucuronidase (+) to 37°C - Staphylococci coagulases (+) to 37°C - Bacteria sulfitoreducteurs to 37°C - Yeasts and mildews to 25C - Salmonella (3) c) Solution motherOne takes 10g of "Tsitindry" and addition 90g of water peptone stamped. The whole is ground during 60s in the STOMACHER. After the solution mother is sudden a set of decimal dilutions: d) Fashion of calculation- sowing in depth [1, 2, 3, 4]
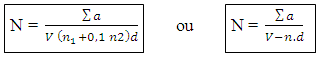 N: Numbers of colonies ∑a: The sum of the Ufcs in two dilutions V: Volume of inoculum ensemencé+ n1: number of limp of 1st dilution d: factor of dilution corresponds to the 1st dilution n2: numbers of limp of second dilution n: number of limps - sowing in surfaces for the Staphylococci coagulase (+) [1, 2, 3, 4]
 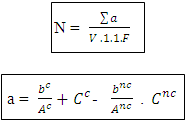 Ac: number of characteristic colonies planted out Anc: number of colonies non feature planted out bc: number of colonies of feature of presumed positive Staphylococci bnc: number colonies non feature of presumed positive Staphylococci Cc: number of characteristic colonies of positive Staphylococci presumed for it limps Cnc: does Sum of the columns of Staphylococci to positive coagulase identified in two limp. F: rate of dilution to the 1st dilution V: volume spread on every limps
 3. Results and Discussion
3.1. Nutritional Value of the Tuber of "Treculia perrieri" after 2, 6 and the Conservation
|
3.2. Dosage of the Minerals of "Treculia perrieri" after 2, 6 and 12 the Conservation
|
3.3. Atinutritional Value in Treculia perrieri after 2, 6 and 12 Month the Conservation
|
3.4. Microbiological Quality of the Flour of Treculi perrieri after 2, 6 and 12 Months of Conservation
|
4. Conclusions
- To be at the norm it is advisable to respect the modes of preparation, from manipulation to storage. To limit microbial growth during production, reduce the content of unbound water or free water and use H.A.C.C.P method during product preparation and manufacturing. As a result, the mineral levels decrease as a function of the shelf life of "Tsitindry" flour. As the potassium levels 444.11mg / 100g in 2 months of storage, 400.2mg / 100g in 6 months and 377mg / 100g in 12 months. Similarly for Calcium 146.73mg / 100g for 2 months of storage; after the rate decreases decreasing 140mg / 100g in 6 months and 95mg / 100g in 12 months. Magnesium decreases gradually 143.11mg / 100g in 2 months, 138 mg / 100g in 6months and 130.2 in 12 months. For nutrients, they decrease gradually during 2, 6 and 12 months of conversations; like Carbohydrates after 12 months of storage, the rate becomes 57g / 100g. The rate of antinutrients also decreases with conservation time. So Traculia perrieri flour is very rich in human needs.