-
Paper Information
- Paper Submission
-
Journal Information
- About This Journal
- Editorial Board
- Current Issue
- Archive
- Author Guidelines
- Contact Us
International Journal of Food Science and Nutrition Engineering
p-ISSN: 2166-5168 e-ISSN: 2166-5192
2017; 7(1): 1-10
doi:10.5923/j.food.20170701.01

Consumption of Vitamin A Rich Foods and Associated Factors among Children Aged 6-23 Months in Kachabira District, Southern Ethiopia
 Abstract
 Reference
 Full-Text PDF
 Full-text HTML
Yibeltal Jemberu1, Menen Zegeye2, Pragya Singh2, Hiwot Abebe2
1Action Contre La Faim (ACF), Addis Ababa, Ethiopia
2School of Nutrition, Food Science and Technology, Hawassa University, Hawassa, Ethiopia
Correspondence to: Yibeltal Jemberu, Action Contre La Faim (ACF), Addis Ababa, Ethiopia.
| Email: |  |
Copyright © 2017 Scientific & Academic Publishing. All Rights Reserved.
This work is licensed under the Creative Commons Attribution International License (CC BY).
http://creativecommons.org/licenses/by/4.0/

Micronutrient deficiency, especially vitamin A deficiency (VAD) is a major nutritional concern in poor societies, especially in lower income countries and among infants. The aim of this study was to investigate the consumption of vitamin A rich foods and associated socio-demographic and economic factors among children aged 6-23 months. For this study a community- based cross-sectional survey was used. A two-stage cluster sampling was employed to select 636 children aged 6-23 months from six kebeles of Kachabira District, South Ethiopia. Survey results revealed that the consumption of vitamin A rich food among children aged 6-23 months in the study area is low. Only 28.8% of the children were reported to have consumed foods rich in vitamin A in the 24-hours preceding the survey. Socio-demographic and economic factors, except maternal and child’s age, were not significantly (p>0.05) associated with the low consumption of vitamin A rich foods by the children. Vitamin A rich fruits and vegetables were cultivated by only 56.1% and 59.9% of the households, respectively. In conclusion consumption of foods rich in vitamin A by this group of children was found to be low. The likelihood of not consuming vitamin A rich foods by children increased as maternal/caretaker’s age increased. On contrary to this, an increase in child’s age was significantly associated with a reduction in the likelihood of not consuming foods rich in vitamin A.
Keywords: Micronutrient deficiency, Vitamin A, Kebeles, Consumption of vitamin A
Cite this paper: Yibeltal Jemberu, Menen Zegeye, Pragya Singh, Hiwot Abebe, Consumption of Vitamin A Rich Foods and Associated Factors among Children Aged 6-23 Months in Kachabira District, Southern Ethiopia, International Journal of Food Science and Nutrition Engineering, Vol. 7 No. 1, 2017, pp. 1-10. doi: 10.5923/j.food.20170701.01.
Article Outline
1. Introduction
- Micronutrient status can affect health outcomes such as child survival, growth and development either directly or indirectly through interactions with each other increasing food intake owing to improved appetite, and reducing morbidity [1]. Among the deficiencies of vitamins and minerals examined globally, the largest disease burdens were attributed to vitamin A and zinc deficiencies.Many developing countries have VAD as a public health problem due to inadequate intake of vitamin A from food [11]. In Ethiopia, vitamin A deficiency (VAD) is continues to be a major public health problem despite the various intervention measures since 1989 [2, 3]. The World Health Organization (WHO) estimates that globally, night blindness affects 5.2 million preschool age children which correspond to 0.9% of the population at risk of vitamin A deficiency [12]. In Ethiopia, an estimated 33.9% national prevalence of subclinical VAD was observed in children age 0-24 months [4]. There are two types of vitamin A available in foods namely preformed vitamin A and Provitamin A carotenoids [5]. Preformed vitamin A is found almost exclusively in animal products, such as human milk, glandular meats, liver and fish liver oils (especially), egg yolk, whole milk, and other dairy products. Provitamin A carotenoids are found in green leafy vegetables (e.g. spinach, amaranth, and young leaves from various sources), yellow vegetables (e.g. pumpkins, squash, and carrots), and yellow and orange non-citrus fruits (e.g. Mangoes, Apricots and Papayas). Studies conducted in developing countries, such as Bangladesh and India, documented low dietary vitamin A intakes by preschool-age children (one to three years old) and found that most of the non-breast milk vitamin A intake was derived from plant sources [6, 7]. Children who are born with limited vitamin A reserves, and when a mother is deficient in vitamin A the newborn reserves are even smaller therefore, complementary foods should be able to provide adequate amounts of vitamin A, especially after the age of 4-6 months [8]. The consumption of vitamin A rich foods remains to be low in Ethiopia, only 14 percent of children less than three years of age have been reported to consume vitamin A-rich fruits and vegetables and the introduction of foods like meat, fish, poultry and eggs in the diet of infants and young children is late and only few consume them. At the age 6-23 months, only one in ten children consume meat, fish, shellfish, poultry or eggs. In addition the proportion of last-born children aged 6-35 months in Ethiopia who were reported to consume vitamin A-rich foods was 26% [9]. In the Southern Nations, Nationalities and People's Region (SNNPR), consumption of vitamin A rich fruits and vegetables by children aged 6-23 months was reported to be 31% [10]. This shows there is still an enormous need for promoting the consumption foods that are rich in vitamin A. The present study was, therefore, aimed to assess the consumption of foods that are rich in vitamin A and associated factors among children aged 6-23 months.
2. Materials and Methods
2.1. Description of the Study Area and Period
- The study was conducted at Kachabira District which is one of the 77 Districts of Kembata Tembero Zone. Kembata Tembero Zone is bordered on the South by Semien Omo, on the North West by Hadiya, on the North by Gurage, on the East by the Oromia Region, and on the South East by Badawacho, an exclave of the Hadiya Zone. With an estimated area of 2,433.93 square kilometers, Kembata Tembaro has an estimated population density of 429.40 people per square kilometer [9]. The annual average temperature of the Zone ranges from 26-27.5°C and the annual average rain fall ranges between 1001-1400 mm. The major produced crops in the Zone include maize, sweet potato, taro, haricot bean, enset, sorghum, teff, ginger and coffee [13]. Kachabira District has an estimated area of 277.5 square kilometers and estimated population density of 618.7 people per square kilometer, which is greater than the Zone average of 429.40. Nearly above 85% of its population is rural [14]. Community based cross-sectional survey was conducted from February 8- March 2, 2011.
2.2. Sampling of the Study Population
- A two-stage cluster sampling was used to select children 6-23 months old based on the estimated sample size. The primary sampling units (PSU) for the survey comprised of kebeles which are located in Kachabira District. List of all kebeles along with their population size was obtained from Kachabira District Council. Following this, six kebeles were selected using probability Proportional to Population Size (PPS) sampling technique of 676 was calculated by dividing total cumulative population (4,056) by the number of kebeles (6 in this case). Microsoft Excel random number generating system was used to select a random number between 1 and 676. The secondary sampling units were households within the selected kebeles. Equal number of households was selected from each of the six kebeles. The number of households per a kebele was obtained by dividing the total sample size of the study (636) by the number of kebeles selected (6) and it was calculated to be 106. Two enumerators were assigned per a kebele to do a house to house visit and make a list of all households with children 6-23 months. Besides, each household on this list was assigned an identification number. The list of all eligible households was, thus, used as a sampling frame. House-holds were, finally, selected by randomly picking up household identification number out of a plastic bag till the required number of households was obtained.
2.3. Data Collection
- Information was gathered for the baseline survey through interview administered pre-tested questionnaire. Eligible respondents for interview were mothers/caretakers of children 6-23 months old. In cases where mother/caretaker was not available any adult (18 years or above) household member who lives with the child was interviewed; priority was given to the person who was reported to be closest to the child care. At least two call backs were made before declaring the household unavailable for the study.In this survey, food consumption pattern dietary assessment of children aged 6-23 months was done qualitatively through a 7-day Food Frequency Questionnaire (FFQ). Before administering the FFQ, food items that are rich in vitamin A content and available in the locality were identified through qualitative market survey and group discussions. A 24 hour dietary diversity questionnaire was also used. In situations where more than one child aged 6-23 months were found the younger child was selected. Twelve enumerators were recruited with educational qualification of grade 12 and above and an ability to speak the local language (“Kembatigna”) were taken as criteria for the selection of enumerators. In addition, two days training was given on the procedures and tools of the research.
2.4. Data Analysis
- Data was analyzed based on the objectives of the study. SPSS software program, version 16.0.0 for windows was used. For the purpose of identifying the diversity of foods consumed by children in the past 24-hrs before the survey, food types were categorized in to seven groups based on WHO recommendation [15]. The 24-hr recall data was used to determine the vitamin A rich foods intake of children. A child was considered to have consumed vitamin A rich food if he/she was reported to have consumed either plant or animal source vitamin A rich foods 24-hr preceding the survey. Accordingly, the children were categorized as those who consumed vitamin A rich foods and those who did not consume vitamin A rich foods. Frequencies on the consumption of vitamin A rich foods by the children were used to generate proportion and the consumption of vitamin A rich foods by the children was used as a dependent variable. Date on socio-demographic and economic factors were also entered to the SPSS software program and were used as independent variables. Bi-variate analysis was used to analyze the strength of association between the independent variables with the vitamin A intake of children. The strength of association between a particular explanatory variable and the outcome variable was made by eliminating the effects of all other explanatory variables. The threshold for statistical significance was set at p< 0.05.
2.5. Quality Control
- Appropriate data quality assurance mechanisms were established to ensure data quality from collection to analysis and reporting. Site supervision was made to assure that standard procedures were followed and quality data was gathered. The field supervisor also checked whether sampling was done according to the standard procedure in each enumeration area and data were appropriately and completely collected using the study tools. Manual data editing was made and data cleaning was done before it is transferred to SPSS software for analysis.
2.6. Ethical Consideration
- Ethical clearance was obtained from Institutional Review Board of the Hawassa University. The purpose of the study was explained in detail to each study participant and individual verbal consent was taken from the mother /caretaker who took part in this study.
3. Results
3.1. Socio-Demographic and Economic Characteristics of Mothers /Primary Caretakers in the Study Area, 2011
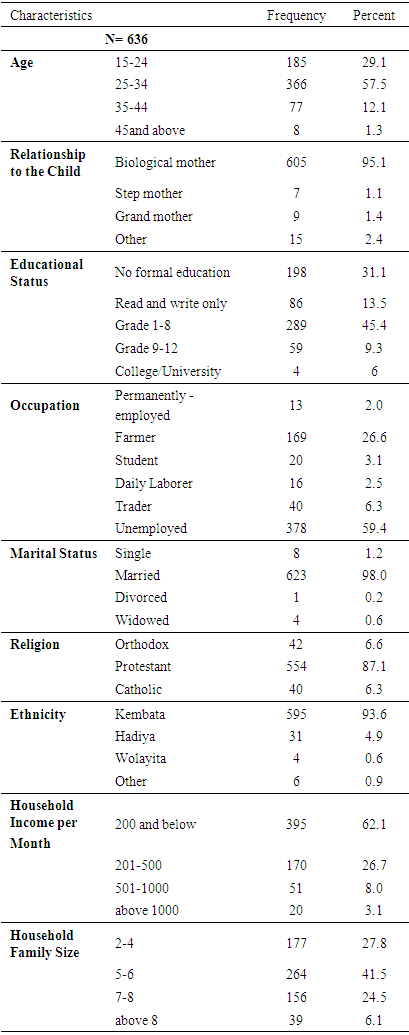
- A total of 636 children aged 6-23 months were involved in the community based cross sectional survey section of the present study. Overall response rate for the survey was 100%. Table 1 describes the socio-demographic and economic characteristics of mothers/caretakers of children aged 6-23 months. The majority (95.1%) of the mothers/caretakers were biological mothers to their children. The ages of 57.5% of the mothers/or caretakers were in the range of 25-34 years. In respect of the marital status of mothers/ caretakers, nearly all (98%) were married. The proportion of mothers/caretakers who attended grade 1-8 education level was recorded to be 45.4%, while only four mothers/ caretakers had a college/university level education. Majority (59.4%) of the mothers/caretakers were found to be unemployed, while 26.6% of them mentioned farming to be their primary occupation. Participants were predominantly Protestants (87.1%) and Kembata (93.6%) by religion and ethnicity respectively. The monthly income of 62.1% of the households was Birr 200 or below. The family size of 41.5% of the households was in the range of 5-6 family members.
|
3.2. Infant and Young child Characteristics in the Study Area, 2011
- Figure 1 shows that the total number of infants and young children included in the survey was 636 (52.2% males, 47.8 females) with mean age of 13.94 ±5.69 months. The majority (37. 26%) of the children were in the age group of 6-11 months.
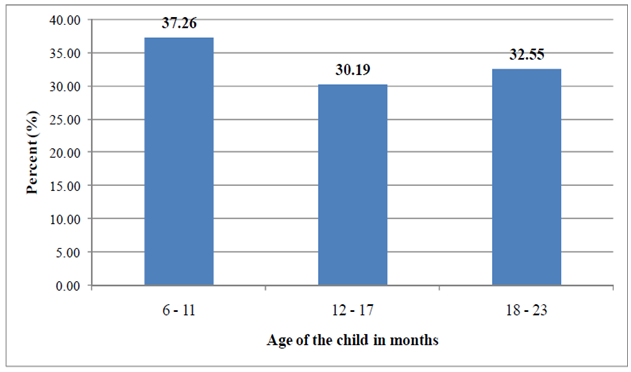 | Figure 1. Age of children 6-23 months in the study area, 2011 |
3.3. Breastfeeding and Complementary Feeding Charac Teristics in the Study Area, 2011
3.3.1. Breastfeeding Status and Introduction of Comple Mentary Foods
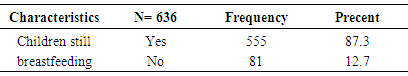
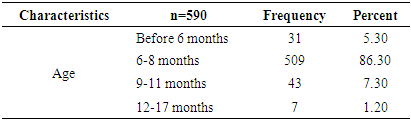
- Majority (87.30%) of the children were being breastfed at the time of the survey (Table 2). Figure 2 shows the status of children with regard to complementary feeding. Complementary food had already been introduced to 590 (92.7%) children. Out of the total 590 children who started complementary foods, 509 (86.30%) of them started complementary foods by the ages of 6-8 months (Table 3).
|
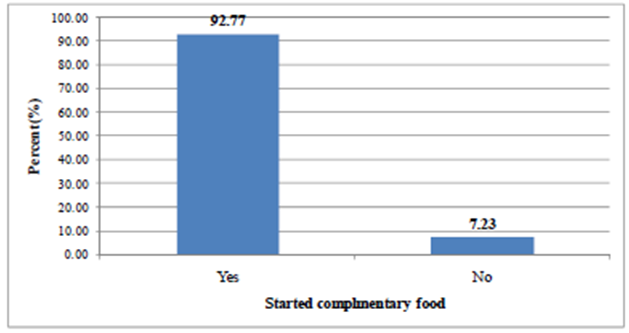 | Figure 2. Proportion of children aged 6-23 months who started comple mentary food in the study area, 2011 |
|
3.3.2. Dietary Diversity of Complementary Foods
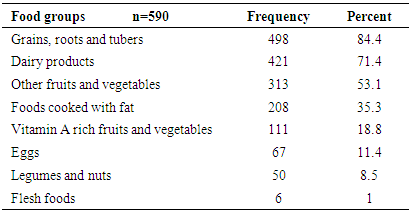
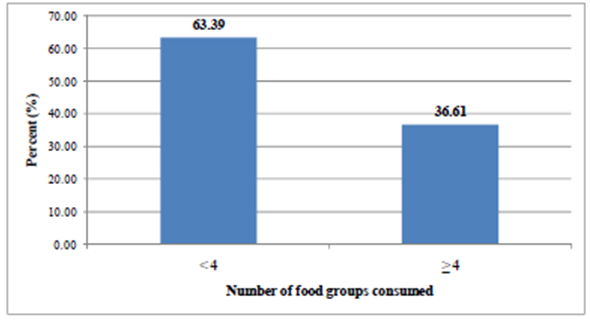
- The information on the types of food groups given to the children aged 6-23 months in the 24 hours preceding the survey is shown in Table 4. The proportion of children who consumed foods from grains, roots was found to be the highest (84.4%) followed by foods from dairy sources. Flesh food was consumed only by 1% of the children. The proportion of children who were given foods from at least 4 food groups was 36.61% (Figure 3). The mean (SD) dietary diversity of the children was found to be 2.84 ±1.24.
|
 | Figure 3. Proportion of children 6-23 months old who consumed foods at least from four food groups (Minimum Dietary Diversity) in the last 24-hrs Preceding the survey in the study area, 2011 |
3.3.3. Consumption of Foods rich in Vitamin A
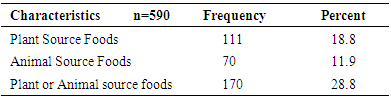
- Consumption of foods that are rich in vitamin A by children aged 6-23 months in the study area was assessed using a 24-hour dietary recall by their mothers/ caretakers. The result (Table 5) showed that consumption of vitamin A rich foods, either from plant or animal sources, was only 28.8%. Plant source vitamin A rich foods were consumed by 18.8% of the children. This was higher than the proportion of children who consumed vitamin A rich foods from animal origin (11.9%).
|
 | Figure 4. Frequency of consuming vitamin A rich foods by children 6-23 months in the last week preceding the survey in the study area, 2011 |
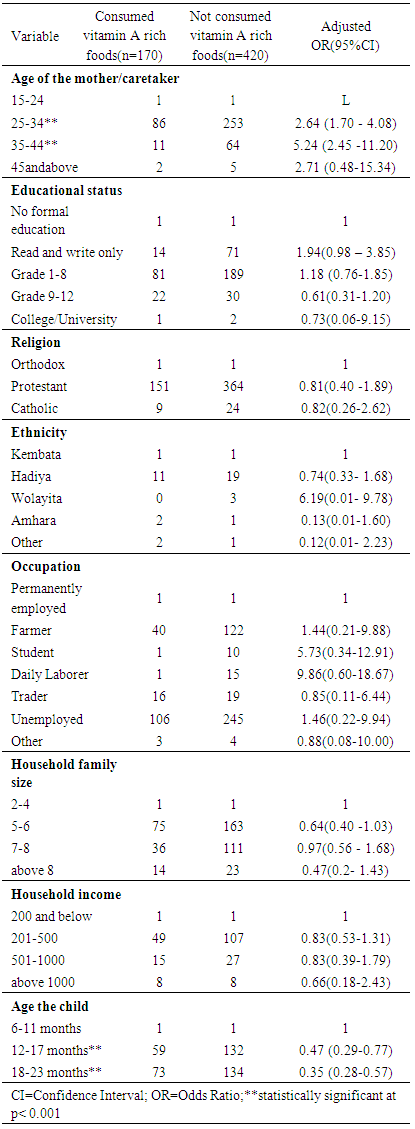
3.3.4. Socio-Demographic and Economic Factors Associated with Consumption of Foods Rich in Vitamin A by Children 6-23 Months Old
- In the present study, the association between consumption of food groups rich in vitamin A by children 6-23 months old and socio-demographic and economic characteristics was analyzed using a binary logistic regression. Maternal/ primary caretaker’s age, educational status, mate religion, ethnicity, occupation, household family size and household income were the main maternal and/or household attributes, while the age of a child was the single child attribute that was included in the analysis. The strength of association between a particular explanatory variable and the outcome variable was made by eliminating the effects of all other explanatory variables. Explanatory variables that were found to be significantly (p<0.05) and/ or closely (close to the level of significance) associated with the consumption of vitamin A rich foods by children are shown in Table 6 along with their corresponding adjusted odds ratios. According to the findings of the present study, maternal/primary caretaker’s educational status, religion, ethnicity, occupation, household family size and household income were found to be not significantly (p>0.05) associated with not consuming vitamin A rich food groups by children. However, maternal/primary caretaker’s age and the age of a child showed a strong and highly significant (p<0.001) association with not consuming food groups rich in vitamin A by children. The odds of not consuming vitamin A rich food groups for children the ages of whose mother/caretaker ranged 25-34 years and 35-44 years were found to 2.64 and 5.24 higher compared to children with mothers/caretakers in the youngest age category (15-24 years) respectively. This finding, therefore, indicated that likelihood of consuming vitamin A rich food groups by children having younger mothers is higher as compared to those children with mothers of middle age groups. The result also showed that as the age of child increases, the likelihood of not consuming food groups in vitamin A by the child decreases. The odds of not consuming food groups rich in vitamin A is reduced by 53% and 65% for a child whose age is 12-17 months and 18-24 months compared to a child whose age is 6-11 months in the respective order.
|
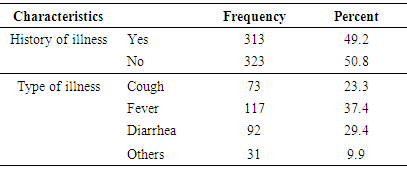
3.3.5. History of Illness
- Mothers/caretakers of 49.2% of the studied children reported their child had history of illnesses in the past fourteen days preceding the survey. Prevalence of febrile illnesses of some form among the children in the specified time period was found to the highest (37.4%). Slightly below 30% of children had diarrhea in the two weeks before the study (Table 7).
|
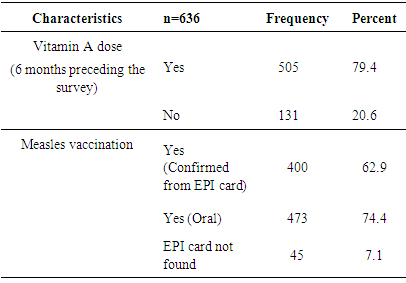
3.3.6. Measles Immunization and Vitamin A Supplementation
- Nearly 80% of the children have received vitamin A doses in the past 6 months before the survey. Nearly three quarter of the studied children have been immunized based on the data obtained from mothers’/ caretakers’ oral report (Table 8).
|
3.3.7. Cultivation of Vegetables and Fruits Rich in Vitamin A
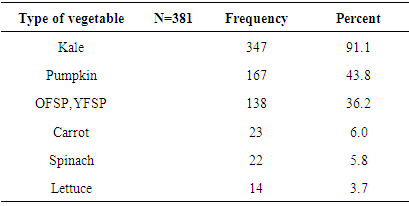
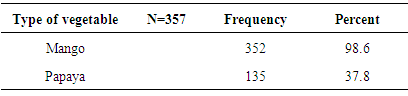
- Results on cultivation of vitamin A rich fruits and vegetables over a year preceding the survey in the study area are shown in Figure 5. Vegetables and fruits that are rich in vitamin A were cultivated only by 381 (59.99%) and 357 (56.10%) households in the year preceding the survey, respectively.Tables 9 and 10 show the types of vitamin A rich vegetables and fruits cultivated in the study over a period of one year preceding the survey, respectively. Among the households that cultivated vitamin A rich vegetables, cultivation of kale was practiced by the majority of households (91.1%) followed by cultivation of pumpkin (43.38%). Lettuce was found to be the least (3.7%) cultivated vegetable in the specified period. Among the 357households who reported to have cultivated vitamin A rich fruits in the year preceding the survey, mango was mentioned to be cultivated by the majority (98.6%) them. Cultivation of papaya was practiced 135 (37.8%) of the households.
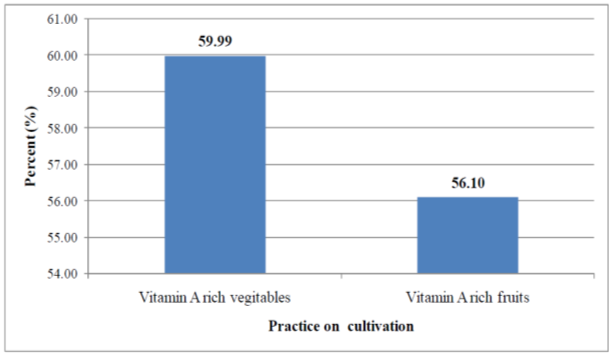 | Figure 5. Own cultivation of vitamin A rich vegetables and fruits over a year preceding the survey in the study area, 2011 |
|
|
3.3.8. Mothers’/Caretakers’ Awareness about Food Sources Rich in Vitamin A
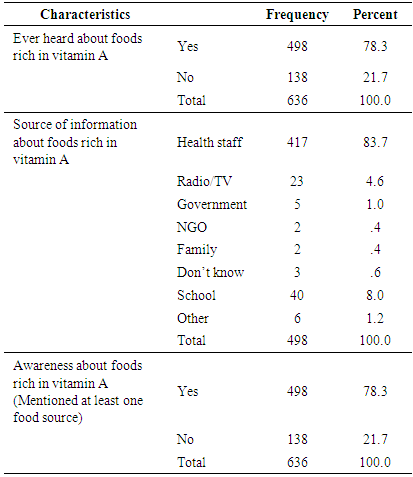
- Slightly below 80% of mothers/caretakers of children said that they have heard about food sources of vitamin A at least once before the survey. Health professionals were mentioned to be the main source of information by the majority (83.7%) of these mothers. All the mothers who mentioned that they heard about food sources of vitamin A were also able to mention correctly at least one food that is rich in vitamin A (Table 11).
|
4. Discussion
4.1. Community-Based Cross-Sectional Survey
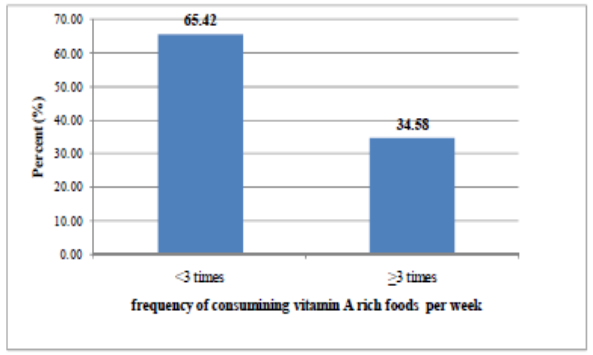
- In the present study only 36.61% of the children 6-23 months old in the study were reported to have eaten foods from at least 4 food groups on the day preceding the survey (Figure 3). Similar findings were documented by earlier studies [18, 9, 17]. According to WHO, a child who consumed foods from at least 4 food groups on the previous day has a high possibility of consuming at least one animal-source food and at least one fruit or vegetable, in addition to a staple food [19]. This, as a consequence, could make the micronutrient-density of the foods consumed by the children inadequate [19, 17]. Foods that are rich in vitamin A were consumed by only 28.8% of the children aged 6-23 months in the study area on the day preceding the survey (Table 5). This finding was in agreement with the 2005 Ethiopian Demographic and Health Survey (EDHS) [9] in which the consumption of foods rich in vitamin A by children 6-35 months was found to be 26%. In addition, a higher proportion of children were reported to consume plant source vitamin A rich foods compared to those who consumed animal origin vitamin A rich foods in the current study (Table 5). This finding is in agreement with earlier studies conducted in South India [7] and rural Bangladesh [6] in which most of the non-breast milk vitamin A intake of children 1-3 years was reported to be obtained from plant sources. It was also reported that in most developing countries, above 80% of the dietary vitamin A intake is obtained from Pro-vitamin A carotenoids [7, 20, 21]. Previous studies have shown that, in general, bioefficacy of carotenoids from a range of plant sources is very scarce [17, 21]. Such a greater dependency on plant foods as major sources vitamin A, observed in the present study, could have its own negative aspects due to low bioavailability of vitamin A from these foods.Both the composition of the complementary diet and the frequency of consuming vitamin A rich foods by infants and young children are of great importance. When food groups with high vitamin A content are consumed less than three times in a week is greater or equal to 75% of the vulnerable groups, there is a high risk of inadequate vitamin A status [22]. Likewise, infrequent consumption of dark green leaves or yellow fruits was associated with four- to six fold increase in the risk (odds ratio) of xerophthalmia in a study conducted in the past [20]. In the present study, 65.42% of the children aged 6-23 months consumed food groups rich in vitamin A less than three times in the week preceding the study (Figure 4). Though this is a value that is below the cutoff point (75%) set by the WHO, still a significant proportion of children in the study area consume vitamin A rich foods less frequently.Maternal knowledge about nutrition and specific nutrients are believed to be crucial for the nutritional status of children. The existence of a strong association between sub-clinical vitamin A deficiency and maternal knowledge on vitamin A was documented by a previous study [4]. A previous study conducted in the study area estimated the knowledge of mothers on vitamin A rich food to be 18.7% [23]. For the present study, however, the proportion of mothers/care takers who were aware of vitamin A rich foods was much higher than what was observed [23]. Such a big difference between the two findings could be attributed to the various health and nutrition interventions being undertaken in the study area.A number of secondary factors are presumed to contribute to inadequate consumption of vitamin A rich foods in developing countries. Some of these include inadequate production of vitamin A-rich foods, lack of income to purchase, unavailability of vitamin A-rich foods in markets, a large family size, high maternal parity levels, low level of maternal education, low levels of awareness of the importance of vitamin A and illness [4]. Another study also observed a positive association between maternal education and socioeconomic status with total vitamin A and retinol intakes of children aged 1-3years in South India [7]. In the present study, however, socio demographic and economic factors (except maternal/caretaker’s age and the age of the child) were found to be not significantly associated (p>0.05) with not consuming foods rich in vitamin A by their respective children (Table 6). This finding was in agreement with a study conducted in Micronesia [24] in which no clear significant association was found between vitamin A intake of children and gender, caretaker education, caretaker occupation, and socio-economic status. The finding of the current study also suggested that the likelihood of not consuming vitamin A rich food groups by children increased for mothers in the middle to older age categories compared to those aged 15-24 years (Table 6). This might be explained by the better access to information of younger age group mothers. A general trend in the reduction of the likelihood of not consuming food groups rich in vitamin A by the child was observed with increasing child age (Table 6). This could be attributed to a better awareness of mothers/caretakers to increase and diversify children’s foods as age increased. This might also be the result of the existing health and nutrition programs.According to the WHO, unavailability of dark green leafy vegetables for more than six months in an area is indicative of increased risk [22]. Different studies have also highlighted the importance of home gardening program in alleviating VAD especially when such programs are integrated with nutrition education. In a study conducted in a rural village in South Africa, a home-gardening program that was integrated with a primary health care activity, linked to nutrition education and focused on the production of yellow and dark-green leafy vegetables showed a significant improvement in the vitamin A status of 2–5-y-old children before and after the intervention compared to a rural control village [25]. During the period 1969–1973 in Ethiopia, a combination of dietary/nutrition education and the introduction of a garden project in a town called Debarek, focusing on the production of green vegetables, was associated with a decrease of VAD from 22% to 0.6% [26]. For the present study, own cultivation of vitamin A rich vegetables and fruits, the practice observed in the study area was found to be low (Figure 5). Comparable finding showed that 41.5% and 75.5% of households across nine regions in Ethiopia did not produce/cultivate any of the common vegetables and fruits over the year preceding the study, respectively [27].
5. Conclusions
- The study showed that the complementary food consumed by children aged 6-23 months in the study area was below the minimum dietary diversity (less than four different food groups) for the majority of the children. Similarly, consumption of foods rich in vitamin A by this group of children was found to be low. The study also revealed that, in general, socio-demographic and economic factors (with the exception of maternal/care taker’s age and the age of the child) were not significantly associated with low consumption of vitamin A rich foods by children. The likelihood of not consuming vitamin A rich foods by children increased as maternal/caretaker’s age increased. On contrary to this, an increase in child’s age was significantly associated with a reduction in the likelihood of not consuming foods rich in vitamin A. Not only the consumption of vitamin A rich fruits and vegetables by the children, but also the practice with regard to own cultivation of these vegetables and fruits was very low in the study area. Majority of the mothers / caretakers were able to mention at least a single food source of vitamin A showing that the awareness in this regard is encouraging.
ACKNOWLEDGEMENTS
- The authors’ appreciation goes to the International Potato Center (CIP) which totally supported our research financially and the community members who took part in this study. We would also like to express our profound gratitude to Dr. Kebede Abegaz for his technical and managerial guidance in our project. We also sincerely appreciate the suggestions and assistance of Dr. Dejene Hailu, Mr. Alehegn Worku and all the technical and administrative staff of School of Nutrition, Food Science and Technology-Hawassa University. We are indebted to extend our acknowledgement to Mr. Birhanu Gebermichael, head of Kachabira District Agriculture office for all his supports and facilitations that helped us a lot during our stay in the District. To all too numerous to mention, we say thank you all.