-
Paper Information
- Paper Submission
-
Journal Information
- About This Journal
- Editorial Board
- Current Issue
- Archive
- Author Guidelines
- Contact Us
International Journal of Food Science and Nutrition Engineering
p-ISSN: 2166-5168 e-ISSN: 2166-5192
2016; 6(2): 32-41
doi:10.5923/j.food.20160602.02

Amino Acids Pattern and Fatty Acids Composition of the Most Important Fish Species of Saudi Arabia
 Abstract
 Reference
 Full-Text PDF
 Full-text HTML
Shady M. ElShehawy1, 2, Ali A. Gab-Alla1, 3, Hamed M. A. Mutwally1
1Biology Department, Faculty of Applied Science, Umm Al-Qura University, Makkah, Saudi Arabia
2Food Industries Department, Faculty of Agriculture, Mansoura University, Mansoura, Egypt
3Marine Biology Department, Faculty of Science, Suez Canal University, Ismailia, Egypt
Correspondence to: Shady M. ElShehawy, Biology Department, Faculty of Applied Science, Umm Al-Qura University, Makkah, Saudi Arabia.
| Email: |  |
Copyright © 2016 Scientific & Academic Publishing. All Rights Reserved.
This work is licensed under the Creative Commons Attribution International License (CC BY).
http://creativecommons.org/licenses/by/4.0/

The aim of this research was to explore amino acids pattern and fatty acids composition of the most common consumed fish in Saudi Arabia. This study was just a trial to encourage Saudi residents to increase their consumption of fish and fish products. To achieve this goal, eleven fresh fish species were randomly collected from the Central Fish Market, El-Kaakia, Makkah, Saudi Arabia, beheaded, eviscerated, filleted and minced. Amino acids and fatty acids composition were determined. In case of essential amino acids (EAA), the major amino acids are lysine (4.47-6.28%), leucine (4.14-5.80%) and valine (3.23-4.37%). Predicted protein efficiency ratio (P-PER) ranged from 1.18 in Indian oil sardine to 1.84 in grey mullet. The percentage of total saturated fatty acids ranged from 34.19±1.70% in golden thread fin bream to 54.67±3.61% in grey mullet. Oleic acid (C18:1) was identified as the primary monoenoic fatty acid in all studied fish flesh samples. Total polyunsaturated fatty acids of studied fish flesh samples ranged from 20.48±1.53% to 43.19±0.17% in sabaki tilapia and golden thread fin bream, respectively. Among omega-3 (ω-3) series, C22:6 docosahexaenoic acid (DHA) was the most common fatty acid in all studied fish samples. Golden thread fin bream had the highest value of biological value (1.7), followed by job fish which recorded 1.41. Finally, these studied fish species were considered vital sources of essential amino acids and polyunsaturated fatty acids especially DHA, ω-3 fatty acid. The results suggested that the necessity to change the nutritive pattern of people in Saudi to encourage them to increase their fish consumption.
Keywords: Fish protein and oil, EAA, P-PER, PUFA and omega-3
Cite this paper: Shady M. ElShehawy, Ali A. Gab-Alla, Hamed M. A. Mutwally, Amino Acids Pattern and Fatty Acids Composition of the Most Important Fish Species of Saudi Arabia, International Journal of Food Science and Nutrition Engineering, Vol. 6 No. 2, 2016, pp. 32-41. doi: 10.5923/j.food.20160602.02.
Article Outline
1. Introduction
- Seafood is one of the most important food constituents in human nutrition and has an economic value. Besides, seafood has become a part of healthy and functional foods. It is well known that fish are important source of protein rich in essential amino acids, micro and macro elements (calcium, phosphorus, fluorine, iodine), oils that are valuable sources of energy, oil-soluble vitamins, and polyunsaturated fatty acids that have an anti-arteriosclerosis effect [Pigott & Tucker, 1990 & Usydus, et al., 2008].In addition, seafood is a rich source of high-quality proteins, vitamins, mineral elements. It is the only the significant source in the human diet of ω-3 polyunsaturated fatty acids (PUFA), that play beneficial and protective role towards cardiovascular, chronic and inflammatory diseases [Calder, 2013 & Khawaja et al., 2014]. Fish products are similar to meat and dairy products in nutritional quality, depending on the methods used in preservation or preparation. Where the protein content of fish ranged from 15 to 20%. Fish also contains high amounts of the essential amino acids, particularly lysine in which cereals are relatively poor. Therefore fish protein can be used to complement amino acid pattern and rise the overall protein quality of a mixed diet. Moreover, the sensory properties of an otherwise bland diet can be improved through fish products, thus facilitating and contributing to greater consumption [FAO, 2013].This is particularly true for the countries of the Arabian Gulf which are dominated by desert regions. Whereas these countries have poor agricultural potential and thus have to import large quantity of their food, they are to a large extent self-sufficient in seafood [Kadidi, et al., 1988]. Burger et al. (2014) examined fish consumption behavior and rates in Saudis and non-Saudis. They found that for Saudis, 3.7% of males and 4.3% of females do not eat fish; for non-Saudis, the percent not eating fish is 6.6% and 6.1% respectively. Saudis ate 2.2 fish meals/week, while expats ate 3.1 meals/week. Grouper (Epinephelus and Cephalopholis) were eaten by 72% and 60%, respectively. The pervious study confirmed that there was a real need to do effort for increasing the Saudis fish consumption, where 11.5kg of fish per year was the consumed amount per capita in Saudi Arabia. This ratio was very low in comparable with the world ratio (18.9kg) [FAO, 2015].Tao et al. (2012) stated that the biochemical composition of fish is affected by many parameters such as biological variations (species, sex, size, and age), diet, environmental conditions (temperature, pH, salinity, etc.), and seasonal changes.In Saudi Arabia, Three highly handled fish in Saudi market were evaluated for their fatty acids. The fish species were locally known as Kanad, Hammour and Hammam in Saudi market. The fatty acids composition in the muscle of fish species was evaluated. C16:0 and C18:0 were the main saturated fatty acids (SFA), C18:1 and C16:1 were the main monounsaturates (MUFA), while C22:6 (DHA) and C20:5 (EPA) were the main polyunsaturated fatty acids (PUFA) [Tawfik, 2009].Meanwhile, in Italy, fatty acid pattern was determined in red mullet (Mullus barbatus) caught from the Central Tyrrhenian and Central Adriatic seas. The obtained results showed that polyunsaturated fatty acids (PUFA) were significantly higher in spring (30-40% of total fatty acids), when fish was lean, than in autumn (20%), while monounsaturates were significantly higher in autumn (35-38%) than in spring (18-29%). Saturated fatty acids were almost stable throughout the year (34-39% of total fatty acids). Red mullet from the two sites had a good nutritional value; in particular they proved to be a good source of ω-3 PUFA, which recorded for 75-80% of total PUFA, without taking into account the fishing season [Di Lena et al., 2016].Another example, butter catfish (Ompok bimaculatus) has high amount of polyunsaturated fatty acids. The percentage of total polyunsaturated fatty acids was 40.92% followed by 26.54% of total monounsaturated fatty acids, indicating excellent nutritive value of this fish species. Amino acids analysis showed that fish flesh contains significant amount of some essential amino acids such as leucine, lysine, threonine, phenylalanine, valine and isoleucine. The ratio between essential and non-essential amino acid is 0.89 indicating its high protein quality [Sayad et al., 2016].An investigation into amino acids pattern in three species of Nigerian fish: Clarias anguillaris, Oreochromis niloticus and Cynoglossus senegalensis was carried out. The obtained results indicated that the most common amino acid was glutamic acid (10.8-11.8% of crude protein) and leucine was the most abundant essential amino acid (5.80-6.47% of crude protein). While total amino acid content was 61.8-63.7% of crude protein, the total essential amino acid content recorded 48.6-50.0% with histidine, but 45.8-47.0% without histidine [Adeyeye, 2009].Finfish have higher levels of polyunsaturated fatty acids and lower levels of saturated fatty acids than other sources of protein. The proportion of saturated, monounsaturated, and polyunsaturated fatty acids in beef are approximately 40-45%, 50% and 4-10% [Sabry, 1990]. The fatty acid composition of chicken (30-35% saturates, 35-40% monounsaturates, and 25-30% polyunsaturates) comes between that of fish and beef. Dairy products have higher saturated fat component (40-65%), similar monounsaturated percentage (30-45%), and much lower polyunsaturated levels (5%) than fish. Protein efficiency ratio (PER) is a measure of protein quality, usually calculated by putting young animals on diets with many test proteins and noticing their growth (PER = gain in body weight (in grams)/grams of protein consumed). The P-PER of fish (3.55) is higher than beef (2.30) and milk proteins (casein=2.50) and close to egg (3.92) [Sheeshka & Murkin, 2010].The aim of this work was to explore amino acids pattern and fatty acids profile of the most common consumed fish in Saudi Arabia. And to encourage Saudi residents to increase their consumption of fish and fish products.
2. Materials and Methods
2.1. Materials
- Three replicates of eleven fresh fish species were randomly collected from the Central Fish Market, El-Kaakia, Makkah, Saudi Arabia during spring 2015. They were classified and named as follows: grey mullet Liza ramada, sabaki tilapia Oreochromis spilurus, indian oil sardine Sardinella longiceps, golden thread fin bream Nemipterus japonicas, gilt head bream Sparus aurata, asian seabass Lates calcarifer, job fish Apharus rutilanus, spangled emperor Lethrinus nebuloses, dusky grouper Epinephelus marginatus, rusty parrot fish Scarus ferrugineus and half spotted grouper Cephalopholis hemistiktos. These species are commonly consumed by the local population in Saudi Arabia. Fish samples were mixed with soft ice, put in ice box and transported to Biology department Lab, Faculty of Applied Science, Umm Al-Qura University, Makkah.
2.2. Methods
- Samples preparation:All fish samples were manually beheaded, eviscerated and filleted. Muscle tissues, below the dorsal fin were taken as the samples. The fish flesh was minced. Moisture content was determined, then fish flesh was dried at 70°C, grinded and stored at -18°C until chemical analysis.
2.3. Chemical Analysis
- Amino acids pattern:Amino acids pattern of fish flesh samples was analyzed out in Food and Feed Quality Laboratory, Regional Center For Food and Feed (RCFF), Agricultural Research Center, Egypt using the method described by AOAC (2012). Fish flesh samples were digested using 6N HCl for 24 h. Amino acids were determined using the Beckman Amino Acid Analyzer (model 6300; Beckman Coulter Inc., Fullerton, Calif., USA) employing sodium citrate buffers as step gradients with the cation exchange post-column ninhydrin derivatization method. The data were calculated as grams of amino acid per 100g crude protein of fish sample.The predicted protein efficiency ratio (P-PER) was calculated using one of the equations of Alsmeyer et al. (1974) as adapted by Adeyeye (2009). P-PER = -0.468 + 0.454(Leu) - 0.105(Tyr)Fish oil extract: Fish oil was extracted from dried minced fish samples using the method described by Bligh and Dyer (1959). Extracted oil was kept into dark glass bottles at -18ºC until fatty acids analysis. Fatty acids composition: Fatty acids profile of fish oil samples was analyzed out in The Central Laboratory Unit, High Institute of Public Health, Alexandria University, Egypt.Preparation of fatty acid methyl ester (FAME) was carried out according to Siew et al. (1995) and Jumat et al. (2006).A standard mixture of fatty acid methyl esters were used to identify of the peaks by their retention time. The different fatty acid methyl esters (FAMEs) were determined and identified using a gas chromatography (Hewlett Packard 6890) equipped with a flame ionization detector (FID). A HP-5 column (30m, 0.32mm ID, 0.25µm film thickness) [5% diphenyl, 95% dimethyl polysiloxane] was used.The detector and injector temperatures were 280ºC and 220ºC, respectively. Sample size 3 µl, spilt ratio 50:1. Nitrogen was used as carrier gas at a flow rate of 1 ml/min. Oven temperature was programmed as:- Set point (initial temperature) 150ºC for 2 Min.- Rate 10ºC/min to 200ºC.- Rate 5ºC/min to 250ºC and hold for 9 Min.The concentrations of fatty acids were calculated as following equation:Fatty acid% = peak area ÷ overall area of peaks × 100.
2.4. Statistical Analysis
- Statistical analysis such as mean, standard error and analysis of variance (one way ANOVA) test were done using SPSS (2008) version 17 program for windows. While comparisons were made using Duncan's test at P<0.05 level of significance.
3. Results and Discussion
- Amino acids composition (g/100g crude protein) of the most important studied fish flesh samples were presented in Table (1). Results reflected that glutamic acid (14.47-15.89%) is the abundant amino acid as a percentage of total amino acids followed by aspartic acid (8.98-10.78%) compared to other amino acids. Data in Table (1) had been expressed in grams of amino acid per 100g of fish sample.
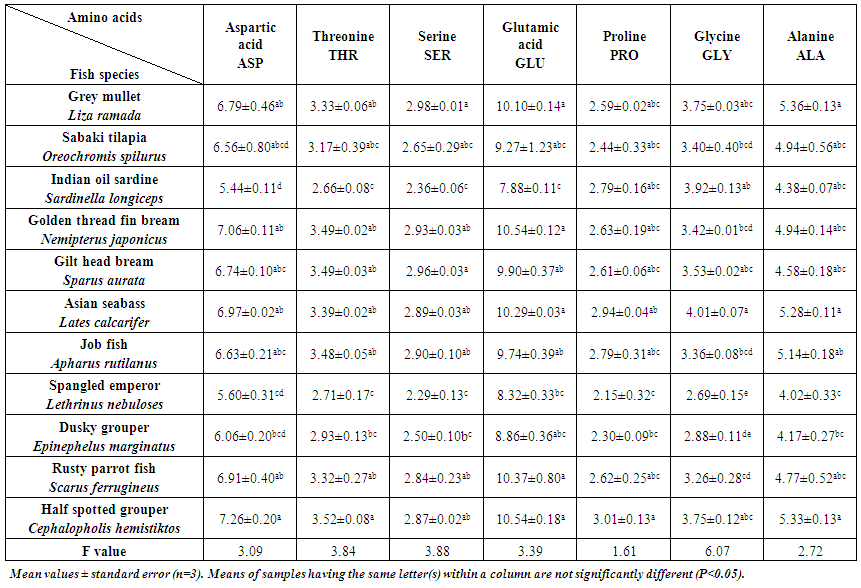 | Table (1). Amino acids content (g/100g crude protein) of studied fish flesh samples |
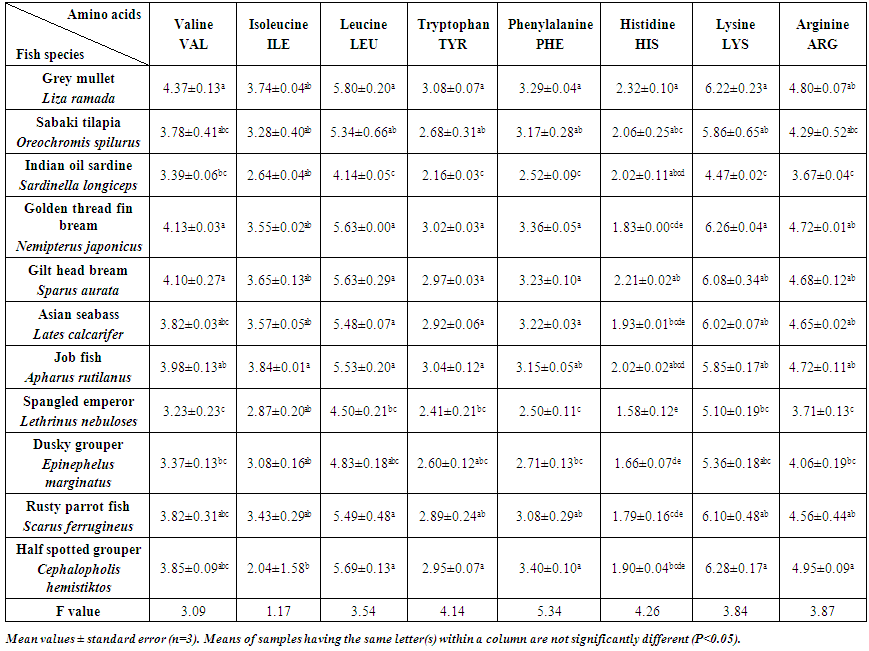 | Table (1). Continue |
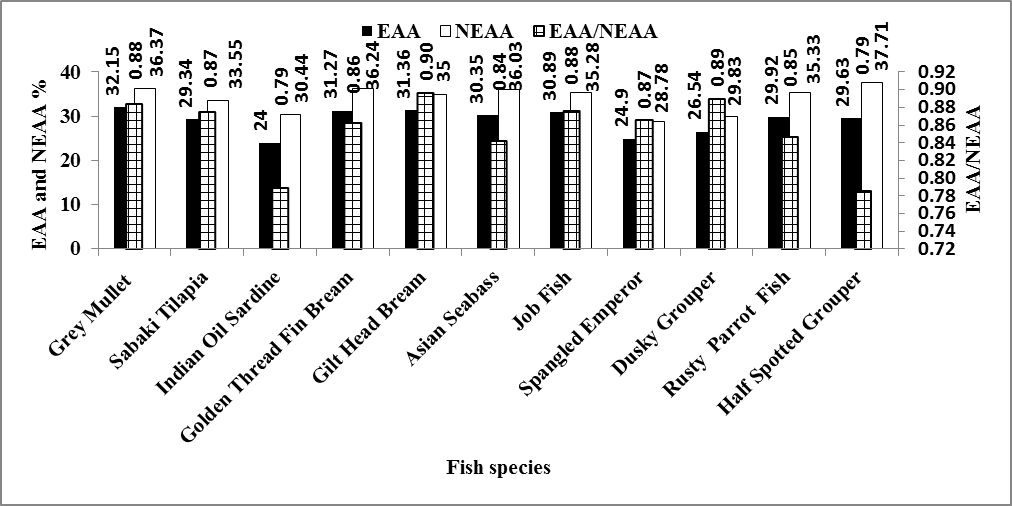 | Figure (1). Essential amino acids (EAA), non-essential amino acids (NEAA) and EAA/NEAA ratio of studied fish flesh samples |
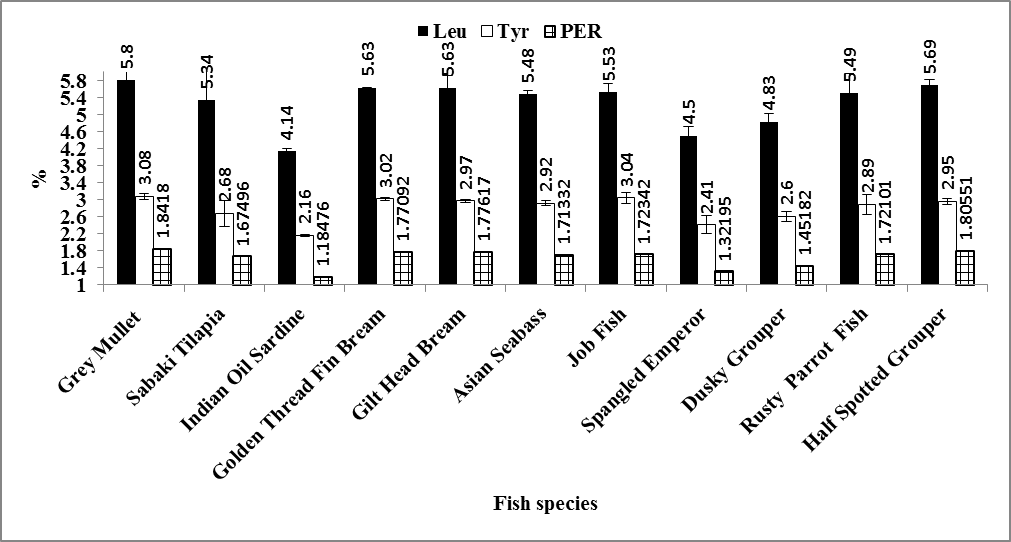 | Figure (2). Leucine and tyramine content (g/100g crude protein) and predicted protein efficiency ratio (P-PER) of studied fish flesh samples |
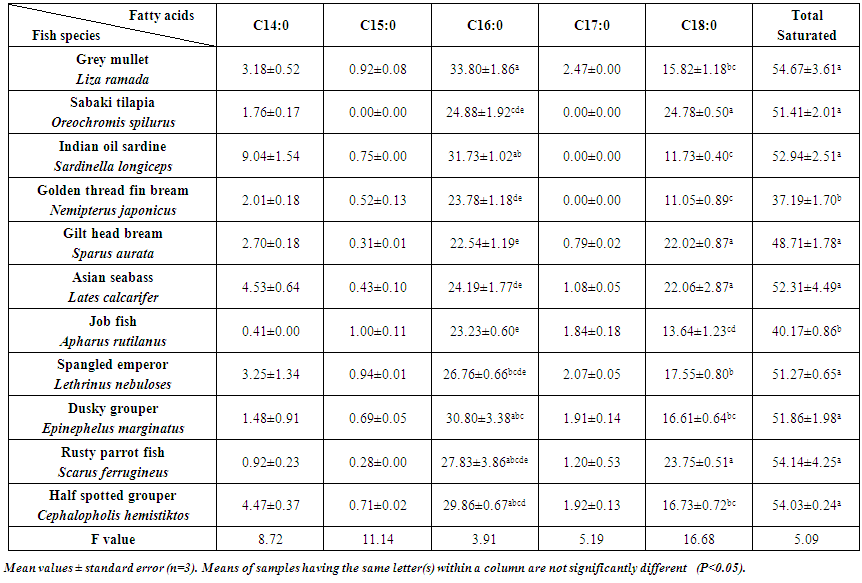 | Table (2). Saturated fatty acids profile (%) of studied fish flesh samples as percentage of total fatty acid methyl esters |
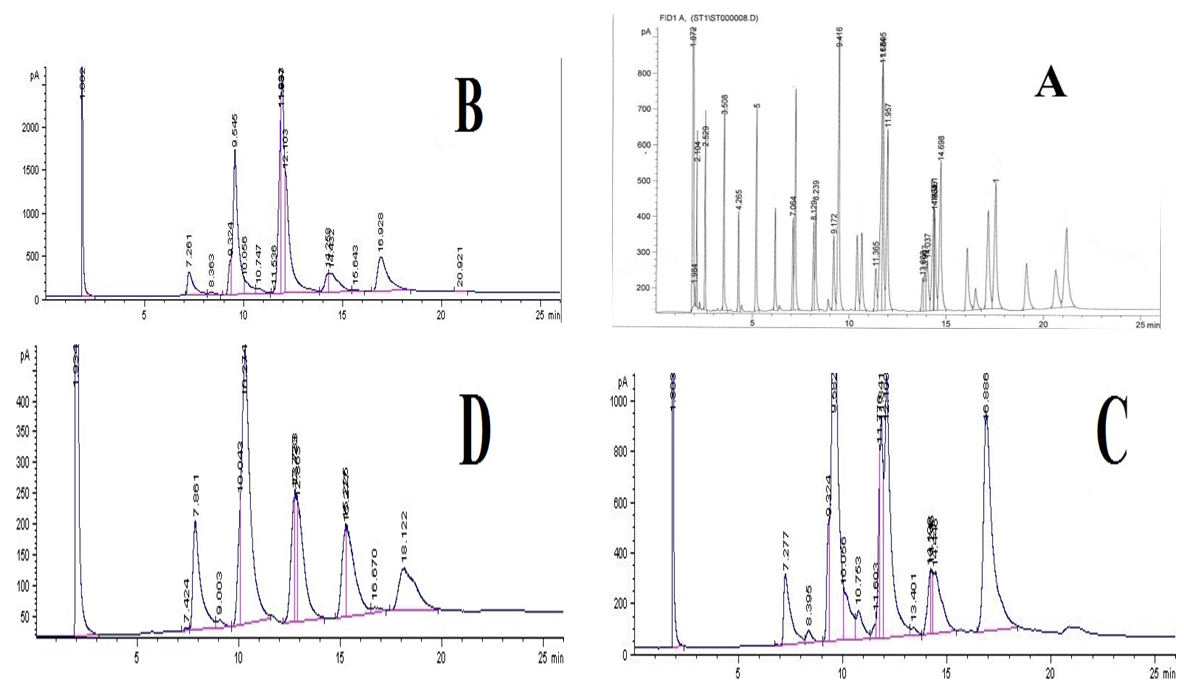 | Figure (3). Fatty acids GC chromatograms, A: Standard chromatogram, B: asian seabass, C: half spotted grouper and D: indian oil sardine |
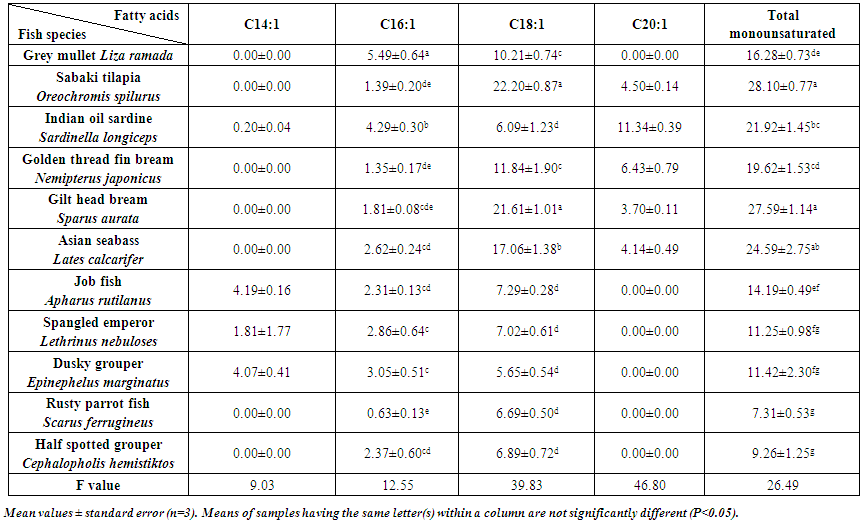 | Table (3). Monounsaturated fatty acids profile (%) of studied fish flesh samples as percentage of total fatty acid methyl esters |
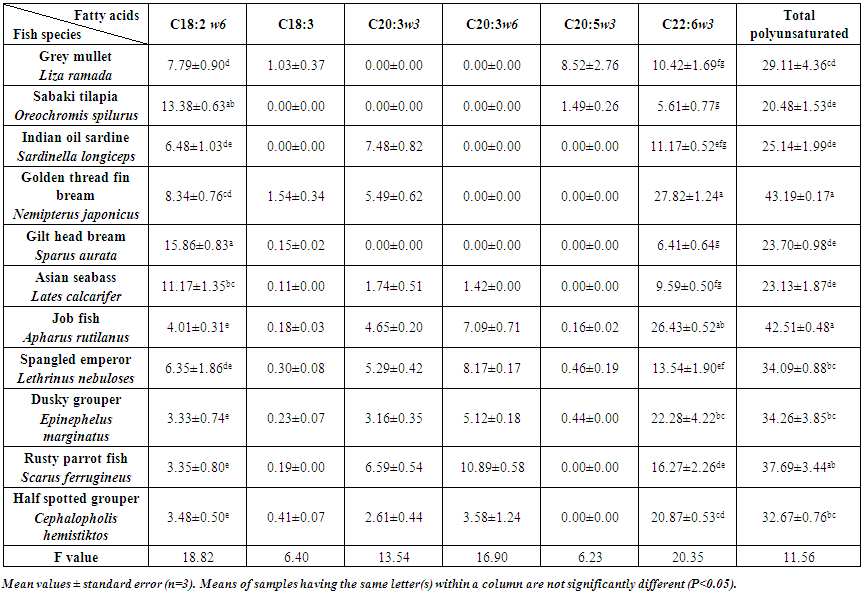 | Table (4). Polyunsaturated fatty acids profile (%) of studied fish flesh samples as percentage of total fatty acid methyl esters |
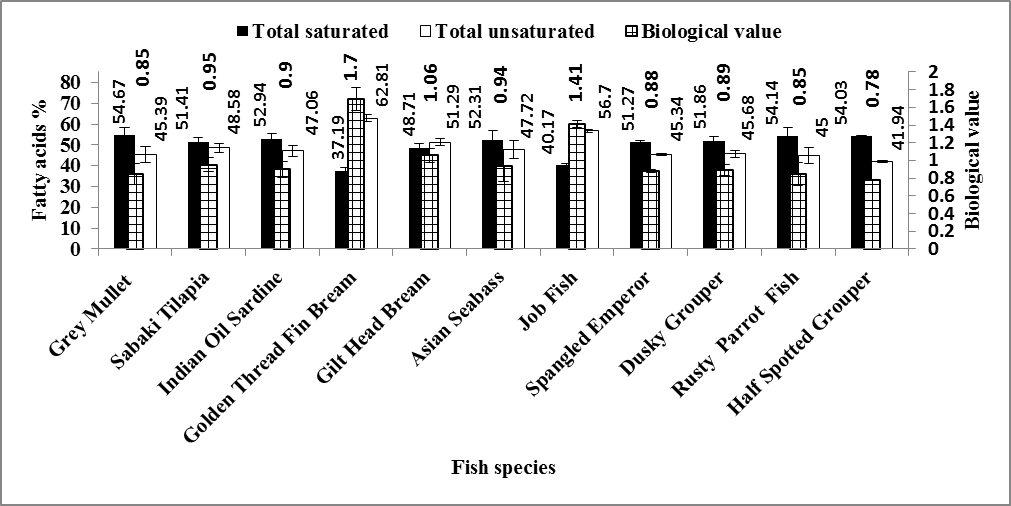 | Figure (4). Total saturated, total unsaturated fatty acids and biological value of studied fish flesh samples as percentage of total fatty acid methyl esters |
4. Conclusions
- Taking into account all previous findings, it could be concluded that all studied fish species highly found in Saudi Arabia and Arabian Gulf countries had higher nutritive value as compared with other pervious studied animals such as camels, cows, lambs and chickens. These fish species were considered vital sources of essential amino acids and polyunsaturated fatty acids especially DHA, ω-3 fatty acid. So it is necessary to change the nutritive pattern of Saudis and residents to encourage them to increase their fish consumption benefitting the high content of essential amino acids and polyunsaturated fatty acids, the acceptable prices of fish and the higher digestibility of fish.
ACKNOWLEDGMENTS
- The authors would like to thank Institute of Scientific Research and Revival of Islamic Heritage at Umm Al-Qura University (Project ID 43405028) for the financial support.