-
Paper Information
- Paper Submission
-
Journal Information
- About This Journal
- Editorial Board
- Current Issue
- Archive
- Author Guidelines
- Contact Us
International Journal of Food Science and Nutrition Engineering
p-ISSN: 2166-5168 e-ISSN: 2166-5192
2016; 6(2): 21-31
doi:10.5923/j.food.20160602.01

Quality Evaluation of Nine Instant Weaning Foods Formulated from Cereal, Legume, Tuber, Vegetable and Crayfish
 Abstract
 Reference
 Full-Text PDF
 Full-text HTML
Aduni U. Achidi 1, Bernard Tiencheu 1, Noel Tenyang 2, Hilaire M. Womeni 3, Marcel N. Moyeh 1, Lucy T. Ebini 1, Fossi Tatsinkou 1
1Department of Biochemistry, Faculty of Science, University of Buea, Buea, Cameroon
2Department of Biological Science, Faculty of Science, University of Maroua, Maroua, Cameroon
3Department of Biochemistry, Faculty of Science, University of Dschang, Dschang, Cameroon
Correspondence to: Bernard Tiencheu , Department of Biochemistry, Faculty of Science, University of Buea, Buea, Cameroon.
| Email: |  |
Copyright © 2016 Scientific & Academic Publishing. All Rights Reserved.
This work is licensed under the Creative Commons Attribution International License (CC BY).
http://creativecommons.org/licenses/by/4.0/

Poor weaning practice and malnutrition are still a public health problem in developing countries, Cameroon inclusive, since the commercial weaning foods may not be quite affordable. Nutritional, functional, microbial and sensory acceptability of Irish potatoes- and rice-base weaning foods were investigated. Three weaning Irish potato-base diets (A1, A2, A3) diets and six weaning rice-base diets (B1, B2, B3, B4, B5 and B6) each differing in the ratio of soybean, crayfish and carrots were formulated, fortified with sucrose and compared to reference weaning diet (phosphatine). The formulated diets were fed to weaning albino rats for four weeks and compared to a commercial diet as reference/control (Multi-cereal phosphatine). Results showed that the fat content of experimental diets ranged between 3.13±0.91 and 14.35±0.55. The carbohydrates range was 24.56% and 54.79% while the energetic value was comparable with that of phosphatine (396.91±24.08 and 371.74±21.14 kcal respectively for B4, and B5). Functional characteristics indicated good dispersibility, swelling index and density. Diet B4, was very much comparable to phosphatine than all the other foods in most of the properties. Mineral contents particularly, Ca, Mg, Na, and Mn in all formulations were significantly higher (p>0.05) than in the commercial reference diet. Better growth responses of the organs, rats weights, the highest protein efficiency ratio and food efficiency ratio were shown in the rats fed formulated weaning diets than the commercial diet.Trained sensory evaluation panellists generally scored the enriched flour porridge to be acceptable. These enriched flours have great potential as a weaning food in resource-poor and technologically under-developed countries. The results showed that the formulated Diets had the desired characteristics of a weaning food, hence could be used for alleviating protein energy malnutrition (PEM) in infant.
Keywords: Malnutrition, Weaning food, Formulation, Fortification
Cite this paper: Aduni U. Achidi , Bernard Tiencheu , Noel Tenyang , Hilaire M. Womeni , Marcel N. Moyeh , Lucy T. Ebini , Fossi Tatsinkou , Quality Evaluation of Nine Instant Weaning Foods Formulated from Cereal, Legume, Tuber, Vegetable and Crayfish, International Journal of Food Science and Nutrition Engineering, Vol. 6 No. 2, 2016, pp. 21-31. doi: 10.5923/j.food.20160602.01.
Article Outline
1. Introduction
- Scientifically, breast milk is the perfect food for the infant during the first six months of life [1]. Chronic malnutrition has been and still remains persistent problem for young children in sub-Saharan Africa [2]. The World Health Organisation (WHO) recommends exclusive breast feeding for the first six months of life with the addition of complementary feeds (which are known as complementary weaning foods) with continuous breast feeding until the age of about two years [3].Human milk is the best food for babies and provides all the nutrients for about the first six months (26 weeks) of life. Moreover it contains nutrients that serve unique needs for human infants such as essential polyunsaturated fatty acid, certain milk proteins, iron and zinc in a readily absorbable form, human milk also contain immunological and bioactive substance [4]. Complementary feeding is the provision of foods or fluids to infants in addition to breast milk. Complementary foods can be subdivided into: Transitional foods that are complementary foods which specifically designed to meet particular nutritional or physiological needs of infants and family foods; that are complementary foods given to young children and are broadly the same as those consumed by the rest of the family [5].Malnutrition remains a persistent problem for children in developing countries [6]. Initiation of complementary food too late or too early can lead to malnutrition. Complementary feeding time is the time when malnutrition starts in many infants contributing significantly to the high prevalence of malnutrition to children less than five years of age [7]. The nutritional value of complementary food should meet the nutrient requirement of rapidly growing children and the food should be diverse with appropriate texture and given in sufficient quantity [8]. Poor nutritional quality and inadequate quantity of complementary foods is reported to have negative impacts on the child. They affect growth [9, 10], hamper mental development [11]. and increase infant morbidity [12, 13] and mortality [14].In developing countries, 70% of weaning foods are supplied by cereals which are relatively poor source of protein [15]. Formulating and development of nutritious weaning foods from locally and readily available raw materials have received a lot of attention in many developing countries [16]. Apart of protein and energy infants diet need calcium, iron and trace elements which can be obtained by combining local staples presently available in the country. Traditional infant foods made of cereals or tubers are known for their high bulkiness and concentrations of fiber and inhibitors anti-nutrients which reduce their nutritional benefits [17, 18]. Bulkiness, often associated with gelatinization of the starch during boiling is a key problem in cereal-based complementary foods [19]. Raw materials of most commercial complementary food are not locally available. Most of the commercial foods need to be mixed and some even need to be cooked before eating and some need processes that reduce nutrients which wastes time than ready to eat foods.Since most commercially available weaning foods are expensive so not affordable by low income mothers, the problem of malnutrition in infants can be solved by introduction of nutritious complementary food. Ndop rice, crayfish, Irish potatoes, carrot, soya beans and table sugar used for diet formulation in this study, are locally produced in large quantities in Cameroon yet children still die of hunger.The aim of this study therefore is to formulate, produce and evaluate ready to eat food (instant food) based on local raw ingredients and intended for mothers/caregivers to feed their children and/or buy the product at lower price thus reducing infant malnutrition in Cameroon.
2. Materials and Methods
2.1. Sample Collection, Processing and Formulation
2.1.1. Sample Collection
- Irish potatoes, carrot, as well as soyabeans were all purchased from the local market in Muea, Buea, South West Region of Cameroon. Ndop rice was purchased at the local market in Ndop, North West Region of Cameroon. The wistar albino rats (21-25 days old) of both sexes weighing between 21 and 50 g were bought from the animal house of the Laboratory of biotechnology laboratory of the University of Buea, South West Region of Cameroon.
2.1.2. Sample Preparation and Processing
- Processing of Carrot: Carrot was screened for rot, insects, and other defects. The carrot was then peeled to expose the flesh, then sliced and boiled for 15minutes. The diced pieces were transferred to a hot air oven set at 80°C for 7 hours. Processing of Irish Potatoes: The Irish potatoes were washed to remove soil from the tubers. They were then peeled, boiled for 20 minutes and cut into small pieces. These were then dried in an oven at 80°C for two days. Processing of Soybeans: Soybeans were sorted for stones, rot, and other physical defects. The beans without defects were cleaned, soaked for 3h, dehulled and boiled for 15 minutes, oven-dried at 80°C for 24hours and roasted under an open flame until golden brown for 30minutes. Processing of Ndop Rice: 3kg of Ndop rice was checked for defects and was washed twice, then boiled for 30 minutes in about 5 liters of water that was added twice during the cooking process. The boiled rice was oven-dried for 2 days in a hot-air oven set at 100°C to avoid microbial contamination and fungal development. Processing of Crayfish: Dry crayfish was sorted for stones and other unwanted particles and hard bones. All the dried samples were dry-milled, sieved with a 75micron aperture sieve in order to remove large particles so as to obtain smooth four which were all stored in zip-lock bags pending diet formulation and laboratory analyses (Figure 1).
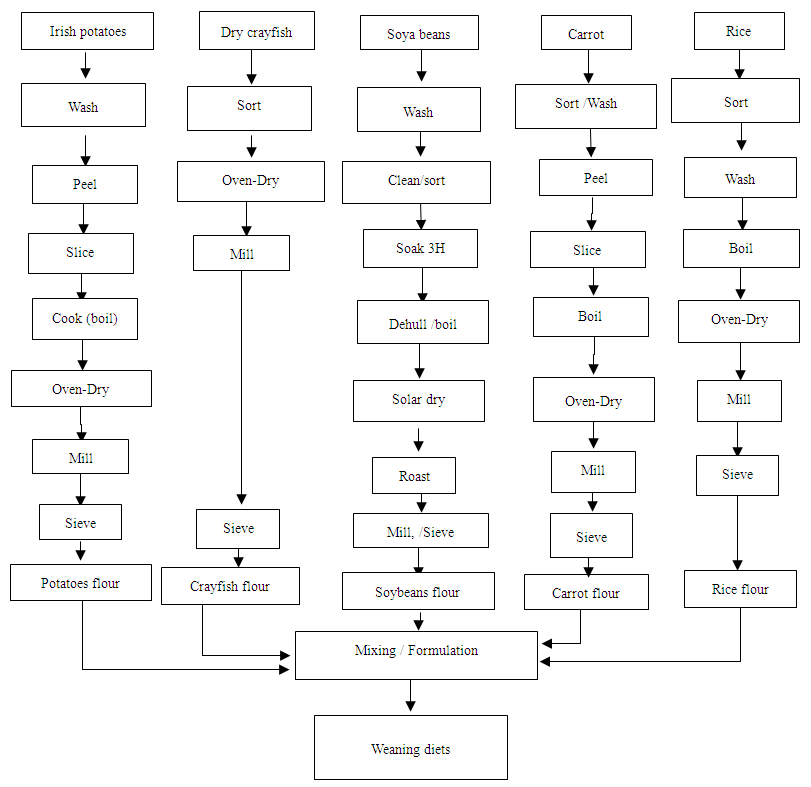 | Figure 1. Flow chart on preparation of various composite flours |
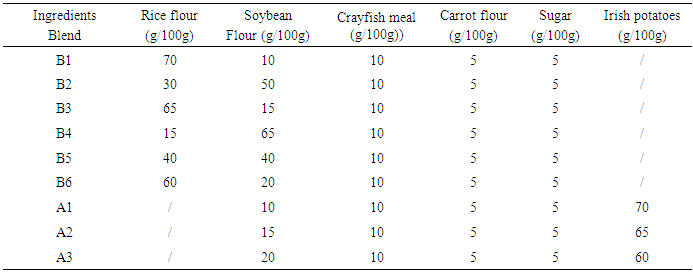
2.1.3. Blend Formulation.
- The blends were prepared or mixed from the individual flour ingredients in the percentages or proportions as shown in table 1.
|
2.2. Physicochemical Analysis
2.2.1. Proximate Analysis
- The moisture, ash, fat, crude protein (% N x 6.25) and crude fibre of the samples were determined by the AOAC method [20]. Moisture was determined based on AOAC Method 934.01: Air Oven Method [20]. Crude protein was determined based on AOAC Method 960.52: Micro-Kjeldahl Method [20]. Fat was conducted based on AOAC Method 963.15: Soxhlet Extraction Method utilizing Hexane as solvent [20]. Crude fibre was determined by neutralisation method (Method 962.09) [20]. Ash content was determined based on AOAC Method 923.03: Dry Ashing Method [20]. Carbohydrate content was estimated by difference and caloric value was measured by calculation using the Atwater's conversion factors [21, 22]. Minerals were determined by Atomic Absorption Spectrophotometer, Hitachi Model 180-80, and Ion Chromatographic Analyzer ICA model IC 100 [20].
2.2.2. Determination of Functional Properties
- Water absorption capacity (WAC) and Oil Absorption Capacity (OAC) were determined using the method described by Cegla et al. [23] and Beuchat [24] respectively.Bulk Density (BD) was determined using the modified method described by Wang and Kinsella [25].Foaming Capacity (FC) was done According to Kinsella [26] Cherry and McWatters [27].Swelling Index (SI) was done according to the method of Abbey & Ibeh [28].Dispersibility: The Dispersibility of the blends was determined as described by Kulkarni et al. [29].
2.3. Rat Bioassay
- Rats were divided into six (6) groups of 6, with five different composed diets and commercial formula (phosphatine), and five different blends were prepared and used for animal feeding experiments. Weanling six Wistar albino rats (21-23 days old) were randomly distributed into five groups, with 6 rats per group. The rats were housed individually in buckets with grill-covered tops and were kept under usual management conditions in conventional animal house of life sciences laboratory, University of Buea. The rats were acclimatized and then fed the formulated Blends and phosphatine reference diet for one month. Diet and water were supplied ad libitum. Weights of all rats were recorded at the beginning and at the end of the study.. At the end of the study, the rats were dissected and the weights of their kidneys, hearts and livers were taken. The protein quality of the diets was analysed using the Protein Efficiency Ratio (PER) and Food Efficiency Ratio (FER) calculated using the formula: PER = Weight gain by test group (g) / protein consumed (g) and FER = Gain in weight (g) / food consumed (g).
2.4. Microbial Analysis
- The freshly prepared formulations were subjected to microbial analysis immediately after preparation. They were tested for bacteria, mould and yeast. Serial dilutions were made from 1g of each sample dissolved in 9ml of distilled water. Using the pour plate method, each diluent was plated out on a plate count agar bacteria count and malt extract for yeast and mould. The plates were incubated at 37°C for 48h for bacterial growth and at 27°C for 3days for yeasts and mould. Colonies developed after incubation was counted.
2.5. Preparation of Porridges and Sensory Analysis
- Porridges were prepared from both the composite flours and phosphatine. 100 grams of each formulated diet were mixed with 400ml of boiled distilled water. 5 grams of granulated sugar for taste were added to the porridge. The samples were allowed to cool at room temperature (25 ±2°C). The porridges were kept separate in thermos flasks to maintain the serving temperature of 40°C. The formulated foods were evaluated alongside a commercial complementary food (Multi-cereal-Phosphatine).Sensory evaluation of the porridges was conducted at the Life Science teaching Lab. Fifty Students, mothers and lecturer were randomly selected and trained. Each of the panelists was seated in an individual compartment with fluorescent lighting and free from distraction. The judges evaluated the samples for flavour, taste, colour, texture and overall acceptability using a nine point hedonic scale, where 9 was the highest score and 1 the lowest [30]. The degree to which a product was liked was expressed as like extremely (9 points), like very much (8 points), like moderately (7 points), like slightly (6 points), neither like nor dislike (5 points), dislike slightly (4 points), dislike moderately (3 points), dislike very much (2 points), and dislike extremely (1 point). The panelists were presented with 20ml coded sample. Each panelist was given five white plastic cups and teaspoons for use in the sensory test. Clean water was provided to the judges to rinse their mouth in-between testing of the sample to avoid carry over effect. Room temperature of 25 ± 2°C was maintained throughout the testing sessions.
2.6. Statistical Analysis
- Data obtained from the study were analysed using means and standard variation for triplicate values. Analysis of variance was used to establish any significant difference between the blends and control and the differences were separated using Duncan’s Multiple Range Test (DMRT) at a level considered to be significant at 5% level of significance (p < 0.05). Results were calculated and expressed as Mean ± Standard Deviation using the software Graphpad Insat 2000 version.
3. Results and Discussion
3.1. Proximate Analyses
3.1.1. Nutrient Content of Formulated Diets
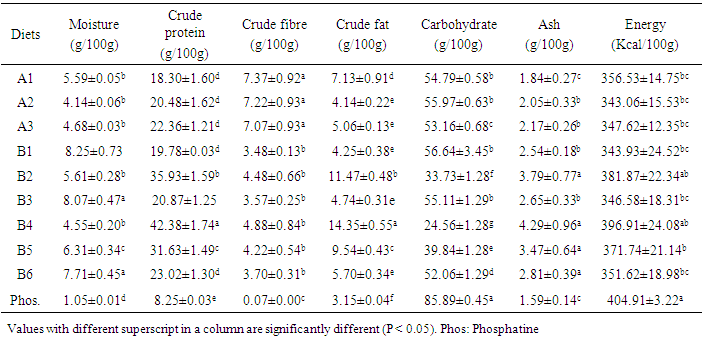
- Table 2 shows result of proximate composition of the formulated complementary foods. The crude protein, ash, crude fibre, fat, moisture (dry basis), carbohydrates and energy kcal/100g ranged from 18.30-42.38; 2.05-4.29; 3.48-7.37; 4.14-14.35; 4.14-8.25; 24.56-56.64 and 343.06-396.91 kcal/100g respectively. A1, A2, A3, B2 and B4, had lower (p < 0.05) moisture contents but which were significantly higher when compared to moisture content of phosphatine (1.05%). Moisture contents are within the recommended value [5-10%] except phosphatine (low moisture content 1.05%) probably due to the worry of prolonging or increasing the shelf life of that commercial product. Moisture content of food is an important index of their susceptibility to microbial spoilage. When the moisture content is on the high side, it encourages the growth of microorganisms [31]. Moisture content would therefore indicate low growth of bacteria and fungi [31]. This thus predisposes such food to degradation and enhances its perishability.
|
3.1.2. Minerals Content of the Formulated Diets
- The mineral composition of the dietary samples is shown in Table 3. Except for phosphorus, the values for calcium, potassium, iron, zinc, sodium, magnesium, and manganese of all the diets were significantly higher compared with the control. B6, B3 andB1 had the highest content of iron, while B6, B3, B1, B5 had the highest calcium content, compared with the others. It was discovered that some of the minerals were lower in values compared to the requirement for weaning diet, while some of the mineral values were within the recommended daily allowance for weaning diets such as in calcium and iron.
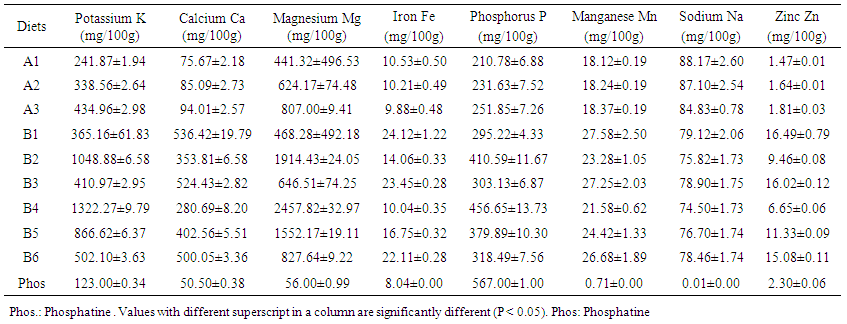 | Table 3. The Minerals Composition of the Formulated Diets |
3.2. Functional Properties
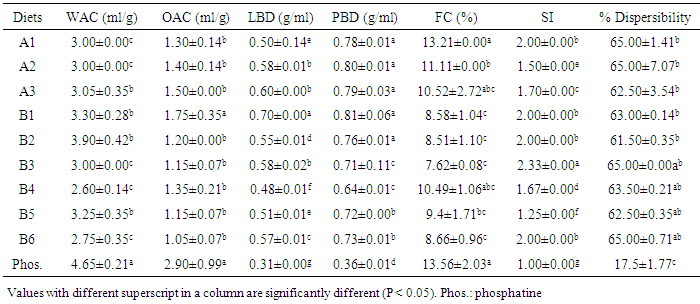
- The water absorption capacity (WAC) gives an indication of the amount of water available for gelatinization [42]. Table 4 shows that formulated samples were significantly lower in WAC compared to the control, the values ranging between 2.75–3.90 ml/g. This may be as a result of production of liquid gruel due to breakdown of starch by the enzymes, which leads to reduction in water absorption capacity and the release in the water trapped in the gel [43, 44]. The highest WAC, OAC and LH values were consistently for the reference samples (4.65±0.21, 2.90±0.99 and 0.62 respectively), while diet B2hadthe highest WAC (3.90±0.42) and diet B1 the highest OAC compared to other formulated diets; The high WAC of the reference sample could be attributed to the high temperature employed during drying process and cooking of the product that can provoque more protein-water interaction during Protein denaturation, starch gelatinization and swelling of the crude fibre, used for processing the rice and soya beans into flour [45].
|
3.3. Sensory Analysis
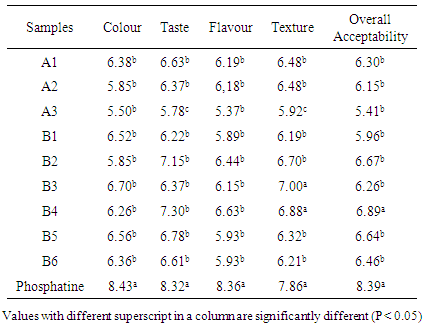
- Table 5 shows the result of the sensory evaluation of the samples. There was a significant (p < 0.05) difference in the colour ratings of the samples by the panellists compared to control. The Reference sample was significantly (p < 0.05) rated best, while samples B2 and A3 had the least colour rating. However, the rating scores were within acceptable range from 5.50–8.43. Factors that may have affected the colour of the composite blends include the chemical composition of the crayfish and soya bean, the drying temperature and duration, composition ratio of crayfish and soya bean flours. Low colour ratings of weaning foods can decrease the acceptability as colour is an important organoleptic attribute which enhances the product acceptability. The colour ratings of the evaluated samples were within acceptable limits and therefore would not be unappreciable to the infants, but could be further improved by adjusting processing conditions.
|
3.4. Rat Bioassay
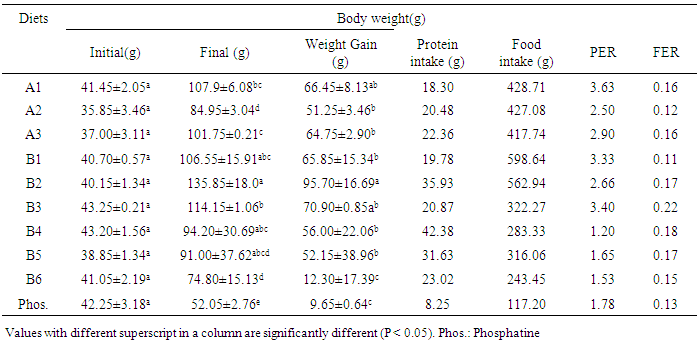
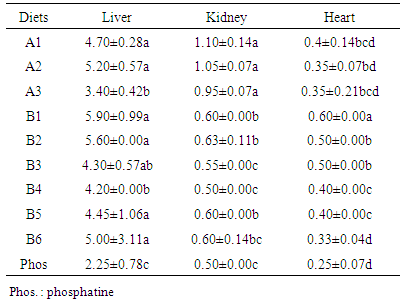
- Rat growth parameters, PER and FER assessment by rat bioassay are shown in Table 6. Results revealed that Rats fed with diet B2, B3 and A1 had the best growth while those fed with diet B6 and phosphatine produced the least (Table 6). Formulated weaning foods had PER values ranging from 1.53 to 3.63. Diet A1, A2, A3, B1, B2 and B3, had higher values than the commercial Phosphatine. The FER ranged between 0.12 and 0.22 for the formulated weaning diets, the commercial diet and diet A2 had lower values. Table 7 presents the body-weight ratio of rats fed on the formulated traditional diets. Rats fed with A2, B1, B2, B3, B5 and B6 have better growth in their liver while the better kidney growth was found in the rats fed with A1, A2, A3. B3, B4, B6 and Phosphatine had the same growth response. B1 produced the best growth in the heart of rats. Rat fed with Phosphatine had the smallest liver, kidney and heart compared to rats fed formulated diets. This may due to the high protein content of the formulated diets compared to the protein content of phosphatine.
|
|
3.5. Microbial Analysis
- Microbial analysis was conducted on freshly prepared diets to determine if blends are wholesome for consumption and data is presented in figure 2. Bacterial counts were low < 10cfu/ml), however high counts were obtained for mould and yeast (0.75 and 1.20 x 10²cfu/ml respectively). But a food product for consumption should have microbial count below1x105cfu/g. The international microbiological standard recommends a bacteria contaminants limit of less than 106cfu/ml for food [50]. Low bacteria counts were obtained as a result of high standard of personal hygiene, high temperature of drying process (80°C-100°C) and quality maintenance of good manufacturing practices observed during the food formulation process.
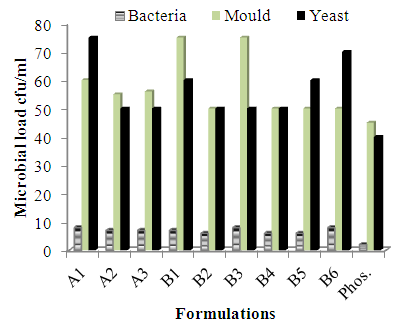 | Figure 2. Microbial load of the formulations |
4. Conclusions
- Children in the developing countries are the most vulnerable and affected by malnutrition. Inappropriate calorie intake and faulty or absence of complementary feeding after six month of age is considered as one of the major factor for the child malnutrition. This study revealed that ready-to-eat complementary food products formulated from locally available food commodities, can meet the macro nutritional needs of infants and children. However certain aspects like the digestibility and bio-availability of the macronutrients in these local diets as well are vitamins fortification and flavor and aroma incorporation. need further investigations The results from this study suggests therefore that proper reformulation and fortification of these local diets can provide nutritious foods that are suitable not only for weaning, but also as rehabilitation diet to malnourished children and can be more cost effective. This is believed to be a practical food-based approach aimed at combating the problem of malnutrition among infants and children in Cameroon and other developing countries.The results have shown that the formulated weaning food prepared from soya beans, crayfish, Irish potatoes, rice, carrot and sugar had protein content which conformed to the FAO/WHO recommended value of 10%. The results of the growth response further revealed that these formulated weaning food blends was nutritionally comparable with the reference diet Phosphatine, indicating that the underutilized crops used in this study which are locally available could be used in producing good weaning foods that can promote and combat malnutrition.
ACKNOWLEDGEMENTS
- We gratefully acknowledge fifty Students, mothers and lecturers who accepted to be selected and trained as panelists for the sensorial analysis part of this work.