-
Paper Information
- Paper Submission
-
Journal Information
- About This Journal
- Editorial Board
- Current Issue
- Archive
- Author Guidelines
- Contact Us
International Journal of Food Science and Nutrition Engineering
p-ISSN: 2166-5168 e-ISSN: 2166-5192
2015; 5(1): 40-52
doi:10.5923/j.food.20150501.06
Application of Response Surface Methodology (RSM) and Central Composite Design (CCD) to Optimize Minerals Composition of Rice-Cowpea Composite Blends during Extrusion Cooking
Nahemiah Danbaba 1, Iro Nkama 2, 3, Mamudu Halidu Badau 3
1Food Technology and Value Addition Research Program, National Cereals Research Institute (NCRI), Badeggi, Bida, Nigeria
2Department of Food Science and Technology, University of Nigeria, Nsukka
3Department of Food Science and Technology, University of Maiduguri, Maiduguri, Nigeria
Correspondence to: Nahemiah Danbaba , Food Technology and Value Addition Research Program, National Cereals Research Institute (NCRI), Badeggi, Bida, Nigeria.
| Email: |  |
Copyright © 2015 Scientific & Academic Publishing. All Rights Reserved.
Significant loss of nutrients has been reported during extrusion cooking, and processing food with this technology therefore requires careful optimization of the process parameters. In this experiment, the effect of process variables on the mineral content of rice-cowpea extrudates was investigated using response surface methodology and central composite design. Barrel temperature (X1), feed moisture composition (X2) and blend composition (X3) were the independent variables considered, while mineral composition was the response variables. Results showed that X1, X2 and X3 all had a significant effect on the mineral composition (p< 0.001). The interactions between the threefactors were also found to be significant at 0.001 level of probability. At X1 between 86 - 140oC, X2 between 15 - 25% and X3 between 8 - 24% the mineral contents in terms of Mn, Fe, Cu, Zn and Ca contents of rice-cowpea extrudates increased. The optimization of the analyzed responses demonstrated that the best peak conditions for extrusion under the different variables were 12.06mg/100g, 5.59mg/100g, 10.98mg/100g, 2.36mg/100g, 4.24mg/100g, and 25.99mg/100g for Mg, Mn, Fe, Cu, Zn and Ca respectively. At moisture content slightly above 22% and blend composition of 20%, Mg content start to decrease. Calcium and Cu contents decrease with increasing moisture and feed blend contents and gradually increases when moisture content raise above 20% and feed blend composition greater than 10%. The correlation coefficients of 0.992, 0.987, 0.969, 0.866, 0.974 and 0.980 observed between the predicted and actual values for the response variables are evidence that the regression model can represent the experimental data well. It can be concluded therefore that minerals present in the extrudates may be maximized when process conditions are carefully adjusted within the reported values.
Keywords: Rice, Cowpea, Mineral content, ANOVA, Response Surface Methodology
Cite this paper: Nahemiah Danbaba , Iro Nkama , Mamudu Halidu Badau , Application of Response Surface Methodology (RSM) and Central Composite Design (CCD) to Optimize Minerals Composition of Rice-Cowpea Composite Blends during Extrusion Cooking, International Journal of Food Science and Nutrition Engineering, Vol. 5 No. 1, 2015, pp. 40-52. doi: 10.5923/j.food.20150501.06.
Article Outline
1. Introduction
- In Nigeria and indeed most countries of sub-Saharan Africa, frequent conflicts, poverty, poor agricultural practices, productivity and climate changes has caused food shortage and most vulnerable populations survive majorly on sole starchy staples such as rice, maize, sorghum, millet, cassava, potatoes and cowpea with little or no animal products to supply protein required for normal growth and development. These problems are further aggravated by the menace of HIV/AIDS epidemic that increased the number of vulnerable populations. Cereals processed using technology that minimize nutrient loss and combination of cereals with local legumes has been reported as one of the vehicle for delivering protein and minerals to at-risk populations because of their wide spread in consumption, stability during storage and versatility in the production of arrays of food products [20]. The production of cereals-legume based products to supply additional protein and minerals to the daily diet of the vulnerable groups of the population has increased significantly over the years. Such products include nutritionally enhanced biscuits, breads, cakes, porridges and extruded snacks. Extrusion cooking technology has played a central role in modern cereal-based industries especially for the production of snacks from wheat, corn, oats and rice [34]. Nevertheless, fewer rice-based extruded products are available in the market compared to those from corn and wheat. But, rice flour has become an attractive ingredient in the production of extruded products due to its bland taste, attractive white colour, hypoallergenicity, ease of digestion and the ability to expand well and make excellent extrudate [21, 23, 34]. The bland flavour of rice therefore makes it favourable for preserving more expensive flavour attributes. Though, reliable statistics are not available for Nigeria and other developing countries, data from United State of America indicated that there is increasing interest in gluten-free food products as while as the number of people having celiac disease grows and society are becoming more informed about health implications of gluten-free products [26].Food minerals are solid, crystalline chemical elements that cannot be decomposed or synthesized by ordinary chemical reactions. They are classified as macro- and microminerals. The macro minerals include calcium, phosphorus, sodium, potassium and chloride, and of these, calcium and phosphorus are needed in large quantity. The microminerals include magnesium, manganese, zinc, iron, copper, molybdenum, selenium, iodine, cobalt and chromium which are required by the body in minute quantity for normal metabolic activities. Although minerals represent a small portion of food composition, they play major roles in food chemistry and nutrition [22]. Minerals such as iron and calcium are added to foods for improvement of its nutritional value [19]. Elements such as iron (Fe), copper (Cu), magnesium (Mg) and calcium (Ca) act as catalyst for enzymes during normal metabolic processes, while Fe is essential for the prevention of anaemia, Ca is required for bone health [19]. But despite the huge importance of minerals in human health, and wide application of extrusion cooking in food processing, relatively few studies has examine mineral stability during extrusion cooking, probably because they are stable in other food processing techniques [19] [22]. Minerals are heat stable and are unlikely to become lost in steam distillate at the die end [22]. But Alonso et al., [32] reported that iron content of flour increased after extrusion, while Singh et al., [22] reported that when wheat bran is incorporated into a broken rice flour in extrusion (300 rpm screw speed, 27kg/h feed rate, 5/32 inches die size, 93-97℃ outlet temperature) there was increase in the calcium, phosphorus, iron and copper contents, which they attributed to type of feed composition and the water used during the extrusion exercise. They recommend further research in this area, particularly if extrudate foods are produced as vehicle for mineral fortification.During extrusion, variation in feed composition such as moisture content, type of carbohydrate, and protein contents and extruder conditions directly influence qualities of finished products [24, 27]. In order to obtain good quality extruded product, the multivariate inputs must be set at the correct levels to allow the dependent physical and chemical changes within the barrel of the machine to continue at a steady state. Once the relationships between the independent and dependent variables are established for a particular product, they must be maintained close to optimum levels to ensure that the extrudate variables are also kept at required level [24]. Response surface methodology (RSM) has been used widely for modelling extrusion cooking processes [1, 4, 19]. It is a collection of mathematical and statistical techniques useful for analysing and optimizing the response of multivariate systems [10]. Perez et al [35] used RSM to study the effects of extrusion variables on extrudate quality, adjusting grit moisture content (14-18%) and extrusion temperature between 155℃ and 185℃. Pansawate et al., [28] studied the effect of extrusion variables on secondary extrusion variables of fish, rice-based snacks considering primary extrusion variables such as barrel temperature of 125 to 145℃, screw speed of 150-300rpm and feed moisture content of 19-23%. Giri and Bandyopadhyay [29] reported on the effect of extrusion factors on extrudate qualities of fish-rice flour blend in a single screw extruder. In the extrusion of blends of flour made from starch and protein rich materials. While [31, 32] earlier reported the optimization of extrusion variables and the application of RSM in the manufacture of Fura a traditional cereal-based porridge of northern Nigeria, blending millet with cowpea, millet and soybean and millet mixed with Bambara groundnut [31, 32].It is in line with these assertions and the need to improve the competiveness of low grade broken rice fractions that the current study was designed to assess the effect of twin-screw extruder extrusion parameters (barrel temperature -100 to140℃, feed moisture content – 15 to 25% and feed blend composition – 8 to 24%) on the mineral compositions of rice-cowpea based extruded instant porridge were examined using RSM and central composite design (CCD) to optimize the process for maximum mineral retention as vehicle for fortification and value addition to rice based extrudates.
2. Materials and Methods
2.1. Raw Materials Collection and Preparation
- The raw materials included rice (Oryzasativa L.) and Cowpea (Vignaunguiculata). About 100kg of rice (FARO 52) was obtained from the Breeding Program of National Cereals Research Institute (NCRI) Badeggi, Nigeria, and 40kg of Cowpea (Vignaunguiculata) was purchased from Central Market, Bida, Niger State, Nigeria and were manually cleaned and kept in a dry condition (30±2oC) until required. For the preparation of rice flour, samples were cleaned in a pneumatic cleaner (locally fabricated) and milled using rubber roll mill (Satake, Japan) and graded, the broken rice fraction was then used for this study. The broken fractions were milled to flour in a small scale disc mill (locally fabricated) and sieved using 150µm screen size sieve. Cowpea seeds were soaked in tap water at ambient temperature (30±2℃) for 30 min to loosen seed coat in stainless steel buckets and decorticated using pestle and mortar before washing several times in clean tap water and drying under the sun for 4hrs (30±2℃) to approximately 14% moisture content. The decorticated dried seeds were mill in a small scale disc mill (locally fabricated) and sieved using 150µm screen size sieve. Both rice and cowpea flours were packaged in a polyethylene bags and stored in a cardboard at ambient conditions (32 ± 2℃) until required for analysis.
2.2. Composite Flour Formulation
- Rice and cowpea flours were mixed at defined ratios (2.55%, 8%, 16%, 24% and 29.45%, wet-wet bases). The moisture content of flour of different ratios was measured by hot air oven method. After getting the initial moisture content of the blends (M1), the blended samples were conditioned to appropriate moisture content by spraying with a calculated amount of water and mixing continuously at medium speed in a blender. The samples were put in closed buckets and stored overnight. The amount of water to be added was calculated using the equation proposed by Ascheri [18]
 | (1) |
2.3. Preliminary Extrusion Exercise
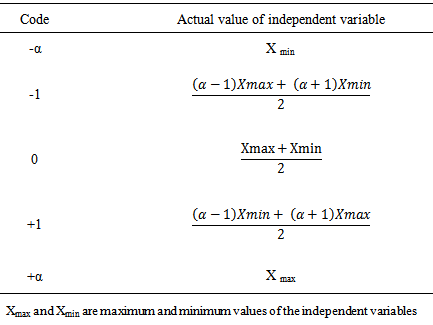
- In order to define the experimental range, preliminary experiments were first. As the design ranges were established, they were coded to lie at ±1α for the factorial points, 0 for the centre points and ±1α for axial points. The codes were calculated as a function of the range of interest of each factor as shown in Table 1. In this study, a small scale laboratory twin-screw extruder with three zones (feeding, cooking and die zones) equipped with a screw feeder and a 3mm die was used to extrude the different formulations. Based on preliminary runs, the feeding, cooking and die zones were set at 100, 120 and 140℃ respectively. Other extruder parameters were screw speed 260rpm, and feeder screw speed (150rpm). When the twin screw extruder output are at steady state extrusion conditions, samples were collected and dried overnight in oven at 80℃. These samples were removed from oven and stored in a desiccator for further analysis.
|
2.4. Extrusion Experimental Design
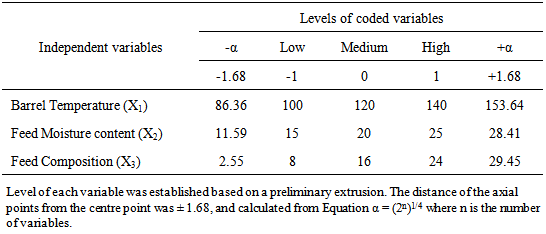
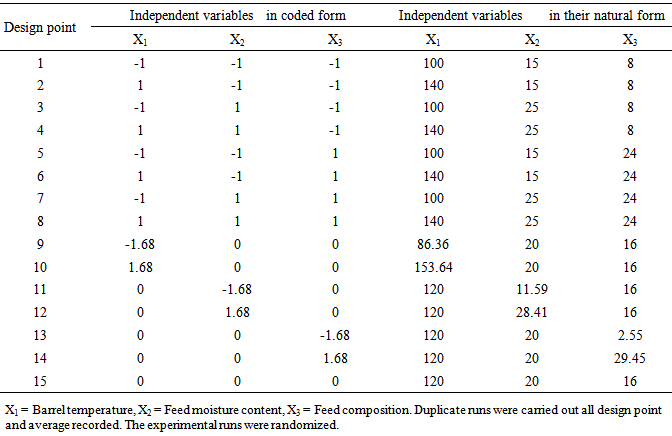
- Considering the extruder limitations, a central composite design was used for this study, based on five-levels of the three variables (Table 2). The independent extrusion variables considered were barrel temperature (100 – 140℃), feed moisture content (15 to 25%) and blend composition (8 to 24%). All other parameters were kept constant. The operating ranges and five standardized levels were established after several preliminary runs as described above. Based on CCD, the experimental runs comprises of 15 trials (8 factorial points, 6 axial points and 1 central point).All treatments were performed in a randomized order. RSM and second-order CCD for three-variables (Barrel temperature X1, Feed moisture content X2, and Feed composition X3), five level combinations coded -1.68, -1, 0, +1, and +1.68 (Table 2) as modelled by Snedecor and Cochran [15] was adopted to determine the effects of the independent variables on response variables. Using the coded levels, the natural levels were calculated and outlined as in Table 3, comprising of 15 experimental runs and different formulation composition.
|
|
2.5. Chemical Analysis
- The moisture content was determined by taking 2g of each sample and placed in petri dishes and heated in an oven at 105oC for 2h, after which it was removed and cooled in a glass jar containing silica gel desiccants for about 15min. Weight of petri dish containing the cooled samples was measured using a digital weight balance (ED 2201-CW, Sartorius, Berlin, Germany). The samples were further dried for 30min and reweighed until a constant weight was observed. Moisture content was calculated as:
 | (2) |
2.6. Statistical and Mathematical Analysis
- To determine if there exist a relationship between the independent variables and the dependent variables, the data collected were subjected to regression analysis using response surface regression procedure of MINITAB 14.13. Regression analysis is used to model a response factor (Yi) as a mathematical function of a few continuous factors. Each response (Yi) was represented by a mathematical equation that correlates the response surfaces. The response was then expressed as second-order polynomial equation according to equation 3.
 | (3) |
 | (4) |
2.7. Test for Significance of the Regression Model
- This test was performed as an analysis of variance (ANOVA) by calculating the F-ratio, which is the ratio between the regression mean square and the mean square error. The F-ratio, also called the variance ratio, is the ratio of variance due to the effect of a factor (in this case the model) and variance due to the error term. This ratio is used to measure the significance of the model under investigation with respect to the variance of all the terms included in the error term at the desired significance level, α. A significant model is desired [11].
2.8. Test for Significance on Individual Model Coefficients
- Additionally, checks were carried out in order to determine whether the model actually describes the experimental data [16]. The checks performed here include determining the various coefficient of determination, R2. These R2 coefficients have values between 0 and 1. In addition to the above, the adequacy of the model was also investigated by the examination of residuals [10]. The residuals are the difference between the respective, observed responses and the predicted responses examined using the normal probability plots of the residuals and the plots of the residuals versus the predicted response. If the model is adequate, the points on the normal probability plots of the residuals should form a straight line. On the other hand the plots of the residuals versus the predicted response should not depict a pattern, that is, the residual graph should contain no obvious patterns.
2.9. Test of Lack-of-fit
- Since triplicate measurements were made during analysis of the dependent variables, a lack-of-fit test examines the significance of replicate error in comparison to the model dependent error. This test split the residual or error sum of squares into two parts, one due to pure error as a result of duplicate measurement and the second due to lack-of-fit which is the ratio between the lack-of-fit mean square and pure error mean square. The F-test can then me used to measure wither the lack-of-fit is statistically significant or not at the described level of probability.
3. Results and Discussions
3.1. Central Composite Design and Model Building
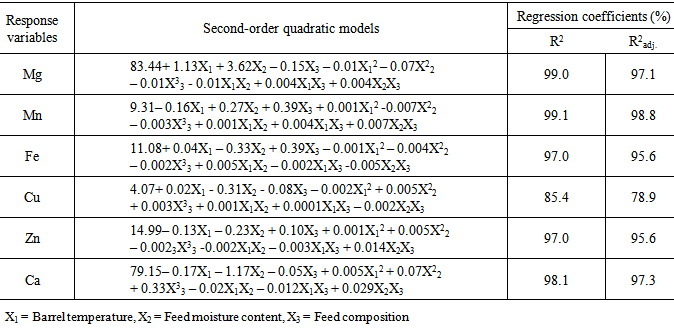
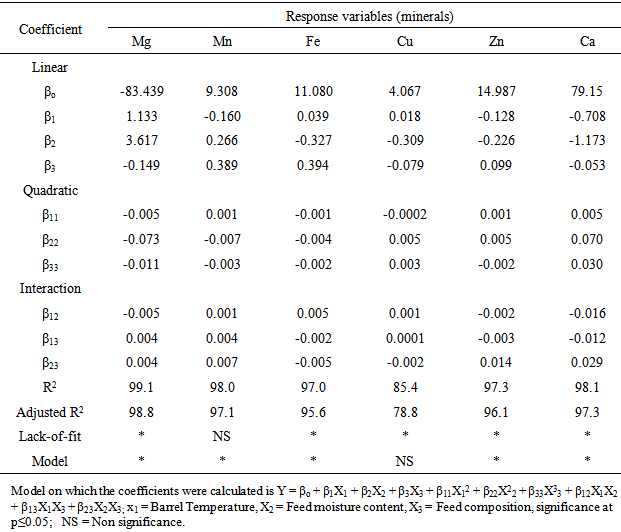
- In regression analysis, model building is the process of developing a probabilistic model that best describes the relationship between the dependent and independent variables. When multivariate biological process therefore satisfies the assumptions that they are measurable, continuous, and controllable by designed experiments and with no statistically significant errors, the RSM using CCD could be applied to develop the model and also optimize the process by first performing series of experimental runs to adequately and reliably measure the response variables before developing mathematical model of the second-order response surface with best-of-fit, and finally determine the optimal set of experimental parameters producing the optimal response value [30]. In this study, effects of barrel temperature (X1), feed moisture content (X2) and feed blend composition (X3) and their interactions each at three levels on the mineral contents of rice-cowpea extrudates were investigated (Table 2). The three independent variables and their different coded and actual values used in the design matrix are presented in Table 2. Fifteen experiments based on CCD were therefore carried out with different combinations of the variables (Table 3). The number of experiment required (N) is given by the expression 2k (23 = 8, star points) + 2 x k (2 x 3 = 6, axial points) + 6 centre points(6 replications) [7]. Observed response data (in triplicates) from the experimental runs (Table 5) were used to develop models (Table 4) using least square technique as described by [30]. The six (6) response variables (Mg, Mn, Fe, Cu, Zn and Ca) were correlated with the independent variables using the second-order polynomial as represented by equation (4). HereX1, X2 and X3 represent the barrel temperature (BRT), feed moisture composition (FMC) and feed blend composition (FBC) respectively. The coefficients with one factor (X1,X2, and X3) represent the sole effects of that particular factor, while the coefficients with two factors (X1X2, X1X3, and X2X3) and those with second-order terms (X11, X22 and X33) represent the interaction between the three factors and the squared effects respectively. A positive value of the regression terms indicates a synergistic effect, while negative sign indicates an antagonistic effect [30]. The regression equation (Yi) demonstrated that mineral retention during extrusion of rice-cowpea composite flour was an empirical function of test variables in coded units, as shown in Equations in Table 4. The mean observed and predicted values of the response variables are presented in Table 5. The significant changes in Fe, Cu, Zn and Ca in relation to changes in the independent variables (X1X2X3) are represented in Table 4. The coefficients in the regression equation can be used to examine the significance of each term relative to each other when used with coded values.Statistical analysis showed that barrel temperature, feed moisture and feed composition all had a significant effect on the mineral values (p< 0.001). The interactions between the three factors were also found significant at 0.001 level of probability. The Fe content of extrudate as indicated in these equations (Table 4) and Table 5 are in agreement with earlier research results reported by Alonso et al. [32] who reported that significant change in Fe content of pea and kidney bean seed extrudates and attributed this variation to wearing of metallic pieces, mainly screws of the extruder. Maintaining barrel temperature between 86 and 140℃ and feed composition between 15 and 25% moisture content and 8 to 24% cowpea increases Mn, Fe, Cu, Zn and Ca contents of rice-cowpea extrudatesin this study (Table 5). Singh et al. [22] reported similar trend. This might be attributed to the addition of these minerals through water used for extrusion and also extruder barrel. Processing variables like feed moisture content and blend ratio has also been earlier reported as playing important role on the quality of extrudates.
|
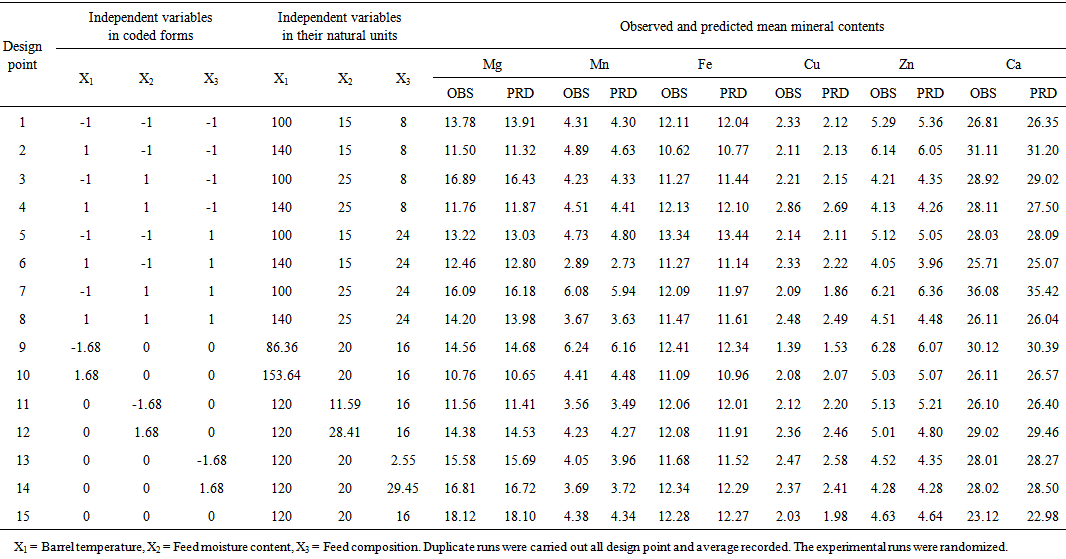 | Table 5. Mean mineral composition of composite blend of rice-cowpea flour extrudates |
3.2. Statistical Significance of Regression Models
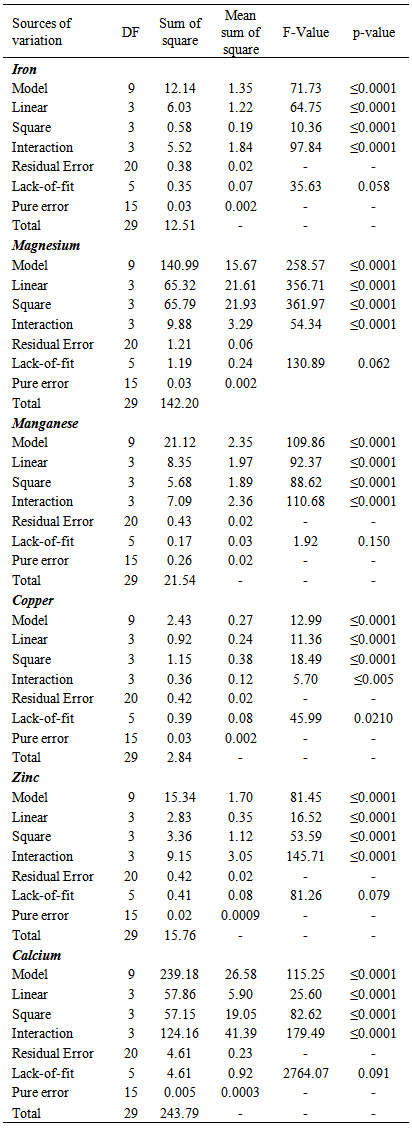
- The analysis of variance (ANOVA) for the response variables (Mg, Mn, Fe, Cu, Zn and Ca) are presented in Table 6. To evaluate the significance of any regression model in predicting effects of a set of independent variable on response variables, the F-value test has to be carried out. The f-distribution test is a probability distribution tests used to compare variance by examining their ratios. The f-ratio value in the ANOVA table in this study therefore is the ratio of the model mean square to the appropriate error mean square (Table 6). Krishma et al. [9] reported that the larger the ratio, the larger the f-value and more likely is it that variance distributed by the observed models are statistically larger than random error. The f-value reported for each response variables are 71.73, 258.57, 109.86, 12.99, 81.45 and 115.25 respectively for Mg, Mn, Fe, Cu, Zn and Ca. The large f-values reported for the model coefficients indicated that the variation in mineral content of the extrudates can be explained by the regression models. It was also clear that the linear and interaction terms are highly significant (p< 0.0001). Based on the ANOVA Table 6, therefore, we can conclude that the selected models adequately represent the data for mineral contents obtained from the extrusion cooking of rice-cowpea composite flour blends. The p-value was used to check for the significance of each of model coefficients. Smaller p-value denotes greater significance of the corresponding coefficient [13].
|
3.3. Validation of Regression Models
- It is also necessary in RSM that the developed regression models (Table 4) provide an adequate approximation for application in real systems, and there are principally two methods used for the validation, these are graphical and numerical methods [30]. The graphical method takes into account the nature of residuals (difference between the observed values and its fitted) of the model while the numerical method uses the coefficient of determination (R2) and adjusted R2(R2adj). R2 is the measure of how much of the observed variability in the experimental data could be accounted for by the model, while R2adj on the other hand modifies R2 by taking into account the number of predictors in the model and calculated as in Eq. 5 and 6.
 | (5) |
 | (6) |
|
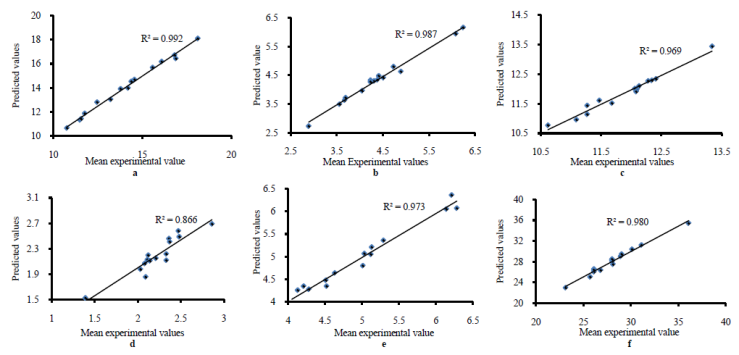 | Figure 1. a-f: Parity plots showing the distribution of experimental versus predicted data for response variables (a) Mg (b) Mg (c) Fe (d) Cu (e) Zn and (f) Ca |
3.4. Analysis of Residual to Check Regression Assumptions
- The normal probability plots of residuals are presented in Figures 2a-f, while Figures 3a-f is plot of residual versus the fitted values. In the normal probability plots, the data points forms a straight line indicating that neither response transformation is required nor there was any apparent problem with normality assumption of the regression model equation. This is in line with earlier report by Damirel and Kayan [12]. The plot of residual versus fitted values is presented in Fig. 3a-f. This plot is additionally used to check the underlying assumptions in the regression analysis. If the plot does not show a random scatter of data along the y-axis as presented in this study, then patterns within the plots will indicate problems with the assumptions. In this study, the residual versus fitted value plots shows randomly scattered points spread around 0 without an obvious shape being made by this points indicating that the assumption of the error having zero mean and equal variance have not been violated [5]. This was an indication of better fit for both the models with the experimental data as reported by Chowdhury et al. [6].
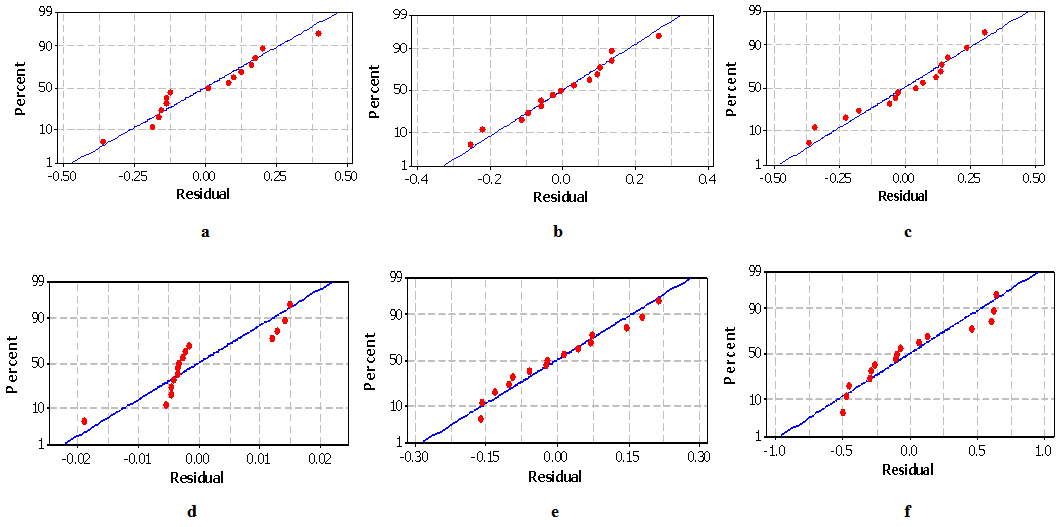 | Figure 2. a-f: Normal probability plots of residual for (a) Mg (b) Mg (c) Fe (d) Cu (e) Zn and (f) Ca |
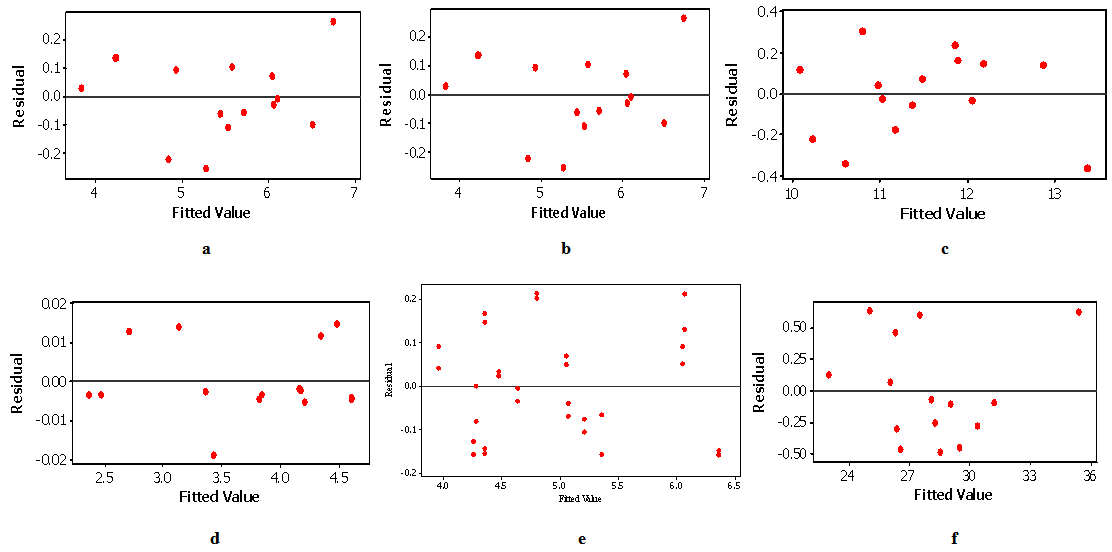 | Figure 3. a-f: Plot of residuals versus fitted values for (a) Mg (b) Mg (c) Fe (d) Cu (e) Zn and (f) Ca |
3.5. Graphical Optimization of Mineral Content of Rice-cowpea Extrudates
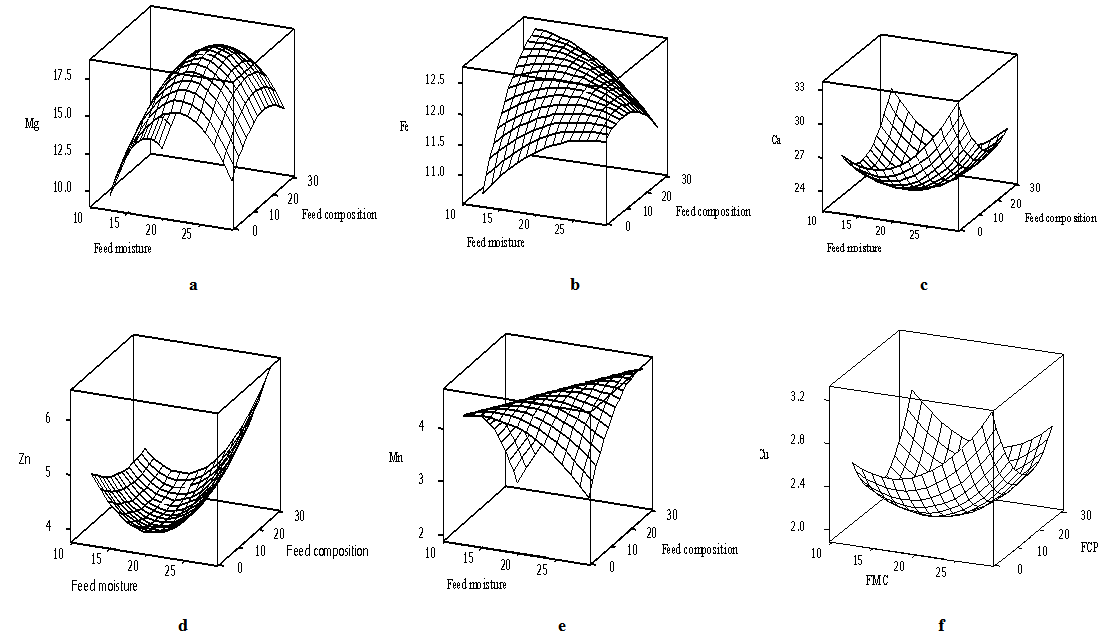
- The interactive relationship between the independent and dependent variables are illustrated by plotting 3-D graphs representation of the response surfaces generated by the models. The 3-D response surface plots (Figures 4a-f) were plotted based on the coefficients presented in Table 7. The plots were generated by keeping one variable at its zero level and carefully varying the other two variables within the experimental range. As shown in Fig. 4a as the feed moisture content and blend compositions increase, the Mg content in the extrudate increases until it reaches an optimal region. However, increase in both variables beyond the optimum level resulted in decrease in the amount of Mg. At moisture content slightly above 22% and blend composition 20%, Mg content start to decrease.
3.6. Numerical Optimization of Mineral Content of Rice-cowpea Extrudates
- A numerical optimization was also performed for the multiple optimization of the response variable (Yi) resulting in the desirable mineral concentration that could achieved in the extrudates. The multiple optimization results indicated that the minimum overall conditions for the minimum reduction in mineral contents of rice-cowpea extrudates could be achieved when the barrel temperature is set at 100℃, feed moisture content of 15% and blend composition of 8%. The peak areas for the response variables were 12.06mg/100g, 5.59mg/100g, 10.98mg/100g, 2.36mg/100g, 4.24mg/100g, and 25.99mg/100g for Mg, Mn, Fe, Cu, Zn and Ca respectively.
4. Conclusions
- It clear from this study, that the central composite design and response surface methodology enabled the determination of optimal operating conditions for obtaining stable mineral content in rice-cowpea composite flour during extrusion. The validity of the model was proven by fitting the values of the variables to the model equation and by carrying out experiments using these values. The optimization of the analysed responses demonstrated that the best peak conditions for extrusion under the different variables were 12.06mg/100g, 5.59mg/100g, 10.98mg/100g, 2.36mg/100g, 4.24mg/100g, and 25.99mg/100g for Mg, Mn, Fe, Cu, Zn and Ca respectively. Minerals present in the extrudates may be therefore maximized when process conditions are strictly manipulated.
 Abstract
 Reference
 Full-Text PDF
 Full-text HTML