-
Paper Information
- Previous Paper
- Paper Submission
-
Journal Information
- About This Journal
- Editorial Board
- Current Issue
- Archive
- Author Guidelines
- Contact Us
International Journal of Food Science and Nutrition Engineering
p-ISSN: 2166-5168 e-ISSN: 2166-5192
2014; 4(5): 128-137
doi:10.5923/j.food.20140405.03
Development of Orange-Fleshed Sweet Potato (Ipomoea batatas) Juice: Analysis of Physico-Chemical, Nutritional and Sensory Property
 Abstract
 Reference
 Full-Text PDF
 Full-text HTML
Tariku Zena Mamo, Abadi Gebre Mezgebe, Abebe Haile
Hawassa University, College of Agriculture, School of Nutrition, Food Science and Technology, Hawassa, Ethiopia
Correspondence to: Abadi Gebre Mezgebe, Hawassa University, College of Agriculture, School of Nutrition, Food Science and Technology, Hawassa, Ethiopia.
| Email: |  |
Copyright © 2014 Scientific & Academic Publishing. All Rights Reserved.
Studies indicated that orange-fleshed sweet potato (OFSP) root is a versatile food item with good nutritional importance. However this root is not utilized well in most developing countries. Developing and characterizing a new product of OFSP could improve the utilization and Vitamin A intake. In the present study different OFSP-based juice products were developed through blending with ginger and mango juice: product-1 (100% OFSP), product-2 (99% OFSP & 1% ginger), product-3 (90% OFSP & 10% mango juice), product-4 (80% OFSP & 20% mango juice), product-5 (89% OFSP, 10% mango juice and 1% ginger), product-6 (79% OFSP, 20% mango juice & 1% ginger) and product-7 (commercial mango juice). Analysis of physico-chemical (pH, titratable acidity, total soluble solids and viscosity), nutritional (β-carotene, vitamin-C, iron, zinc, phytate, bio-availability of iron and zinc) and sensory (appearance, aroma, color, taste, mouth feel and over acceptability) properties of the products was conducted. It was shown that soluble solids, viscosity and β-carotene increased with increasing percentage of OFSP. Products flavored with ginger had lower pH, higher acidity and ash, enhanced taste and aroma. Moreover, products flavored with mango juice had lower soluble solid and viscosity, better vitamin-c, taste, aroma, mouth feel, color and appearance. The phytate and bioavailability of iron and zinc was at acceptable range in ginger containing products. Generally, products contained both ginger and mango juice had better physico-chemical, nutritional and sensory acceptability. In development of orange-fleshed sweet potato juice combinations of ingredients should be considered to improve overall quality and stability of the products.
Keywords: Orange-fleshed Sweet Potato, Juice, Blending ratio, Physico-chemical, Nutritional content, Sensory property
Cite this paper: Tariku Zena Mamo, Abadi Gebre Mezgebe, Abebe Haile, Development of Orange-Fleshed Sweet Potato (Ipomoea batatas) Juice: Analysis of Physico-Chemical, Nutritional and Sensory Property, International Journal of Food Science and Nutrition Engineering, Vol. 4 No. 5, 2014, pp. 128-137. doi: 10.5923/j.food.20140405.03.
Article Outline
1. Introduction
- Orange-fleshed sweet potato is seasonal crop, perishable that cannot be stored for long period of time unless preserved in some way. Orange-fleshed sweet potatoes are rich in dietary fiber, minerals, vitamins, and antioxidants, such as phenolic acids, anthocyanins, tocopherol and β-carotene. They are good source of vitamin-A, vitamin-C, B-vitamins (B2, B3, and B6), potassium and copper [20, 29, 47, 48]. Numerous nutritious food products could be developed from the nutritionally rich orange-fleshed sweet potato and other supplementary food sources [2, 16]. It has been stated that chips, cookies, breads, alcoholic and non-alcoholic beverage can be developed from OFSP with or without flavoring with fruit juices and spices [17, 33, 38, 43, 51]. Ahmad et al. [4], Bengtsson et al. [13], Chun [15], and Coronel et al. [16] stated that the occurrence of changes of nutritional value of sweet potato roots during preparation and processing. Similar reports described that processing during product development may induce alteration of physico-chemical, nutritional and organoleptic properties [5, 15, 16, 30, 39, 41]. Effects of processing and cooking documented by Avula [11], Grabowski [23] and WHO [50] reported reduced total carbohydrate (from 43 to 29.4%), protein (from 1.6 to 0.95%), ash (from 1.3 to 0.9%), fiber (17.5 to 0.06%), dry matter (from 9.2 to 8.69%), no change in fat and increased moisture (from 27.4 to 60%). Cooking process may reduce vitamins (β-carotene, vitamin-C…) and minerals (Ca, P, Zn, Fe, Mn…) of sweet potato due to degradation and leaching [11]. The extent of loss will depend on the cooking method, temperature and time. However, the positive advantage of cooking improves digestibility and availability of nutrients and promotes palatability and shelf-life of the food [11, 23]. Bioavailability refers to the proportion of a nutrient that is absorbed from diet and used for body functions [19, 22, 31]. It can be influenced by food matrix and chemical form of the nutrient. In addition to the in-vitro and in-vivo methods [22, 19], bioavailability of minerals can also be determined using molar ratio of anti-nutritional factors (phytate, tannin, oxalate…) to the respective minerals (iron, zinc, calcium, magnesium and sodium…) [1, 3, 21, 24]. Production of OFSP beverage is not mixing up of recommended flavoring and preservatives, a certain bio-chemical and physical changes are taking place during processing [11, 28]. The major change is enzyme catalyzed degradation of starch into simple sugars (saccharification) [11]. Malt has been used as a source of both proteolytic and diastatic enzymes [26]. The enzymes that become active during mashing OFSP into juice are α-amylase and β-amylase. According to Mills [33] and Serrat et al. [41] the enzymes work together to break down long complex chains of soluble starch molecules into simple sugars or dextrins with optimum temperature. During development of OFSP beverage, the mashed juice must not be exposed to alcoholic fermentation. This can be obtained by pasteurizing and packing to prevent growth of alcoholic fermentation bacteria, yeast and other spoilage micro-organism.Considering the nutritional importance of OFSP, current limitation its utilization due to seasonal production perishablity, sub-optimum storage technology [10, 12, 27]; The need for intervening vitamin A deficiency in most developing countries [44, 45, 48, 49]; which is affecting around significant number of children 6-59 months of age and mothers [34]; This research aimed at development of OFSP juice flavored with mango and ginger and analysis of physico-chemical, nutritional and sensory properties of the products. pH, total soluble solids, titratable acidity and viscosity were considered as indicators of physico-chemical, while β-carotene, vitamin-C, iron, zinc, phytate, bio-availability of iron and zinc in molar ratio as nutritional indicators and acceptability test like appearance, aroma, color, taste, mouth feel and over acceptability.
2. Materials and Methods
2.1. Sample Preparation
- OFSP (Ipomoea batatas) locally called Kulfo variety was collected from Areka Agricultural Research Center, Southern Ethiopia. Mango (Mangifera Indica), ginger (Zingiber officinale) and maize (Zea mays) were purchased from local market. The OFSP roots were sorted-out, weighed, washed, peeled with mechanical potato peeler and cut into smaller pieces by stainless steel knife. Then it was rinsed with tap water, chopped and homogenized using cutter-mixer. Additional water (2 liter /kg of OFSP) and 5% maize malt flour was added. To prepare the malt flour (as source of β- and α-amylase enzymes), the maize was cleaned, washed and steeped for 24 hour and sprouted for 3 days on a jute sac, sun dried for 3 days and grinded and screened with 0.15mm screen opening [41]. The mixtures (homogenized OFSP, water and malt) were heated to a temperature of 60°C for 1 hour. The temperature was then being raised to 70°C for another 1 hours until complete degradation of starch took place. Degradation of starch was confirmed by iodine test (complete disappearance of blue black color of starch upon addition of potassium iodide reagent). The mixture was filtered with muslin clothe. The juice extract was pasteurized by rising the temperature of stove to 90°C for 10 minute and bottled hot. The bottled juices were cooled down at ambient temperature and stored in refrigerator at 3°C until analysis [51]. Different OFSP juice products were developed based on a formulations: Product 1 (100% OFSP), Product-2 (99% OFSP & 1% ginger), Product-3 (90% OFSP & 10% mango juice), Product-4 (80% OFSP & 20% mango juice), Product-5 (89% OFSP, 10% mango juice and 1% ginger), and Product-6 (79% OFSP, 20% mango juice & 1% ginger). Mango juice was extracted by cooking mango fruit for 20 minutes at 60°C temperature and pulped by stainless steel blade. The mango juice was weighed and added into cooking media before 30 minutes to complete cooking. Ginger was prepared by peeling and grinding using laboratory pestle and mortar and it was added in the same way as mango juice.
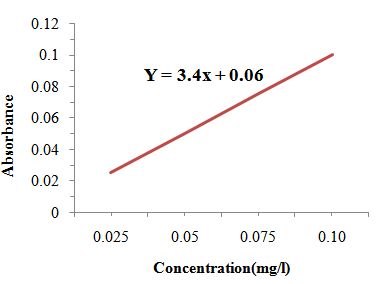 | Figure 2.1. Calibration Curve for Determination of Zinc |
2.2. Physico-Chemical Properties Analysis
2.2.1. pH
- pH of the developed products was measured after calibrating a pH meter with pH 4.0 and pH 7.0 standard buffer solution (ready to use). Sample beverage of 100 ml was acquired in 250 ml beaker and 1/3 of pH electrode was immersed in to the beaker containing sample. Finally, pH of each juice product sample was measured in triplicate and recorded [8].
2.2.2. Titratable Acidity (TA)
- Titratable acidity of the juices was determined using method of AOAC [8]. The beverage was thoroughly mixed and filtered using muslin cloth. About 5 ml of filtrate was dissolved in distilled water until the volume was reached 50 ml. Then 5 ml aliquot of sample solution was taken and titrated with 0.1N NaOH using phenolphthalein solutions as indicator till the orange color of the beverage sample was changed into pink. Triplicate measurement was taken and calculated as percent of citric acid using the equation 1.
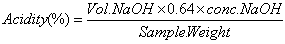 | (1) |
2.2.3. Total Soluble Solids (TSS)
- The concentration of dissolved sugars was determined using Refractometer as addressed in AOAC [7] method. After calibrating with distilled water, 2 drops of sample was introduced on the prism and allowed the temperature to be stabilized at 20°C and triplicate measurement was taken from the Refractometer. Result was expressed as oBrix (the amount of total dissolved solids in 100 g of juice product).
2.2.4. Measuring Viscosity
- As described in AOAC [8], the viscosity of the beverage samples was determined using Ubbelohde-type viscometer. After maintaining the viscometer vertically, Sample was transferred into sample holder tube. The viscometer was placed in a thermostatic water bath maintained at temperature of 24°C and allowed to stand for 20 minutes. After closing sample holder tube, the sample was transferred to measuring tube by suction. When the sample starts to flow down from the lower end of capillary tube, the time (seconds) (t) required for the sample to pass through the capillary tube was measured and viscosity (v) was calculated using equation 2. k is the kinematic viscometer constant, determined from distilled water.
 | (2) |
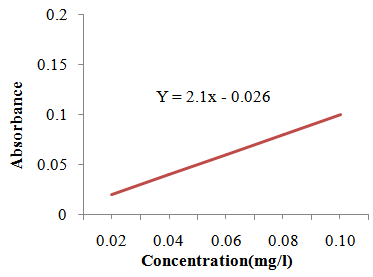 | Figure 2.2. Calibration Curve for Determination of Iron |
2.3. Nutritional Content Determination
2.3.1. β-carotene
- The content of β-carotene of the samples was determined according to the AOAC [8]. About 40 ml sample was taken into 1000 ml beaker and 20 ml of acetone was added. The addition of acetone was continued until the beverage was saturated and weight is then recorded. The sample was covered and stored in refrigerator overnight. All aqueous layers were extracted by using pipette and discarded while the remaining content was weighed and recorded. All of water contained in the sample was filtered using a filter funnel and filter paper and the solid substance remained was placed in another beaker and 20 ml of acetone was added. About 15 g mixed sample was weighed and placed in a filtration funnel. Then 2 ml of acetone and 15 ml of CH2Cl2 was added to facilitate solubility and filterability and the mixture was filtered with vacuum filtration method. The CH2Cl2 was removed and 3 drops of CaCl2 was added to enhance the complexation of organic compounds. The samples were taken into weighed and moderately heated vials. Petroleum ether (1 ml) was added and further purified by column chromatography where small piece of cotton was placed on a layer of sand, a layer of a mixture of silicone gel and hexane in a glass pipette. Air was pumped into the content to seal off hexane, sand and petroleum ether. β-carotene substance and hexane were was captured in a test tube as set aside. In the UV-VIS spectrophotometric detection, the absorbance at 450nm was read in quartz cells. Reading was taken quickly, since petroleum ether is a volatile solvent. The ß-carotene concentration (C in mg.l-1) was calculated using Lambert Beer law from measured data of the absorbance as indicated in the equation 3.
 | (3) |
2.3.2. Vitamin-C
- The dye-titration method described by AOAC [8] procedure was used to determine the concentration of vitamin-C. Metaphosphoric acid extracts of the beverage was prepared and pH was adjusted to 1.2. The reducing capacity of the extracts was measured by titrating with 2, 6-dichlorophenolindophenol (DCIP). In this oxidation-reduction reaction test, ascorbic acid in the extract is oxidized to Dihydro Ascorbic acid (DHAA) and the indophenol dye was reduced to a colorless compound. End point of the titration was detected when excess of the unreduced dye gave a rose pink color in acid solution. The concentration of vitamin-C was determined from balanced chemical equation as described by AOAC [8].
2.3.3. Ash
- The AOAC [7] method was considered for determining the percentage of ash. About 15 gram of homogenized juice sample was placed on a crucible and dried in oven at 105°C for 3 hours. The dried sample was then charred using hot plate at 350°C till it ceased to smoke. The charred sample was then ashed in a muffle furnace at 550°C overnight. The weight of ash was measured using analytical balance. The ash content of the samples was calculated using the equation 4.
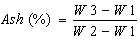 | (4) |
2.3.4. Analysis of Zinc
- Foremost, ash was prepared and treated with a concentrated hydrochloric acid, transferred to a volumetric flask and made up to 50 ml. An aliquot of the ash solution was used for analysis of zinc by the Atomic Absorption Spectrophotometer (AAS). For AAS the wavelength was set to 213.9 nm. Zinc concentration of samples was determined using standard calibration curve plotted using standard concentrations of zinc solution (0.025 mg/l, 0.05 mg/l, 0.075 mg/l, and 0.1mg/l) prepared within the analytical range and the corresponding absorbance. Concentrations of zinc in test samples were calculated from the calibration curve plotted as stated in AOAC [9].
2.3.5. Analysis of Iron
- Determination of iron concentration was conducted according to AOAC [9]. Preparation and treatment of ash to determine iron concentration using AAS method was the same as the zinc determination. However, for iron determination the wavelength was set to 248.3 nm. Ferric nitrate solution for atomic absorption spectrophotometer was used as standard. The standard calibration curve was prepared using known concentrations of ferric nitrate solution (0.02 mg/l, 0.04 mg/l, 0.06 mg/l, 0.08 mg/l and 0.1 mg) which are within the analytical range and plotted with the corresponding absorbance. A concentration of iron content of the samples was calculated from calibration curve.
2.3.6. Phytate
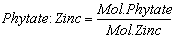
- Phytate content of the samples was determined according to AOAC [9]. About 0.1 g of juice sample was extracted with 10 ml of 2.4% HCl in mechanical shaker for 1 hour at an ambient temperature and centrifuged at 3000 rpm for 30 min. About 1 ml of Wade reagent (containing 0.03% solution of FeCl3.6H2O and 0.3% of sulfosalicilic acid in water) was added to 3 ml of the sample solution (supernatant from the centrifuge) and the mixture was mixed on a vortex mixer for 5 seconds. Four different concentration of standard sodium salt of phytate (0.025 mg/l, 0.05 mg/l 0.075 mg/l and 0.1mg/l) were prepared to determine the calibration curve and 0.15 g of standard solution was added into 15 ml of centrifuge tubes with 3 ml of water which were used as a zero level (blank). 1ml of the wade reagent was added to each test tube and the solution was mixed on a vortex mixer for 5 seconds. The mixture was centrifuged for 10 minutes and the absorbances of the solutions (both sample and standard) were measured at 500 nm using deionized water as blank in UV-Vis spectrophotometer. The concentration of phytate in the juice sample was determined from the calibration curve.
2.3.7. Bioavailability
- Bioavailability of minerals (zinc and iron) was determined by molar ratio. The mole of phytatic acid and minerals was determined by dividing the weight of phytatic and minerals with their respective atomic weight (Phytate: 660 g/mol; Fe: 56 g/mol; Zn: 65 g/ mol). The molar ratio with respect to phytate was obtained by dividing the mole of phytate with the mole of respective minerals [35]. Equation 5 and 6 was used to calculate the bioavailability iron and zinc with molar ratio.
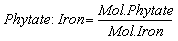 | (5) |
 | (6) |
 | Figure 2.3. Calibration Curve for Determination of Phytate |
2.4. Sensory Evaluation
- Sensory acceptability of the products was evaluated by panelists based on their voluntariness to participate in the evaluation [46]. Sensory attributes of the juice products like appearance, taste, aroma, mouth feel, color, and over all acceptability were evaluated by the panelists. Five point hedonic scales (1= Dislike very much, 2= Dislike, 3= neither like nor dislike, 4 = Like and 5= Like Very much) was used. Each panelist was sat in isolated place to limit any disturbances. Coded juice samples were presented in tea glass and allowed to be assessed twice in duplicate test results.
2.5. Data Analysis
- Data were statistically analyzed by the help of SAS 9.0 using one way analysis of variance (ANOVA). List significant differences were calculated at p< 0.05. After analysis of data, mean comparison was made for all the significant treatments and mean ± standard deviation is presented in the tables of results.
4. Results and Discussion
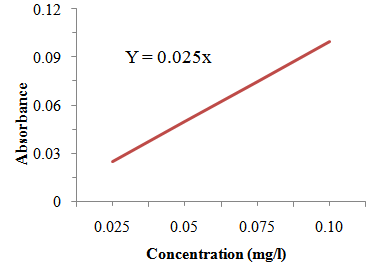
4.1. Physico-Chemical Properties
- As shown in Table 4.1 Different formulations employed for the development of OFSP juice resulted in variation of physico-chemical properties (pH, TA, TSS, viscosity) significantly at p< 0.05 for some juice products. The pH values for the developed OFSP products varied from 3.92±0.056 to 5.19±0.055. All developed juices products had pH value less than 5.5 (acidic in nature) [9]. Product 4 contained highest pH value whereas product 7 contained lowest pH. There was no significant difference between pH values of Product 3 & 6, 4 & 6, and 3 & 5. Next to product 7, product 2 (1% ginger & 99% OFSP) had pH lower than the others. The lowest pH value could be attributed to the addition of ginger that has more organic acid contents [17]. The highest pH in product 4 could be due to the mango juice added, lower organic acid content of mango that could brought change in pH than ginger. The lowest score of pH of product 7 might be due to the preservatives used. The work of Wireko [51] is in line with the findings of the present study. During developing OFSP juice mechanisms to reduce pH should be considered for better microbial stability; low pH is important to inhibit microbial growth in juices [42].
|
4.2. Nutritional Analysis
4.2.1. Vitamin and Mineral Contents
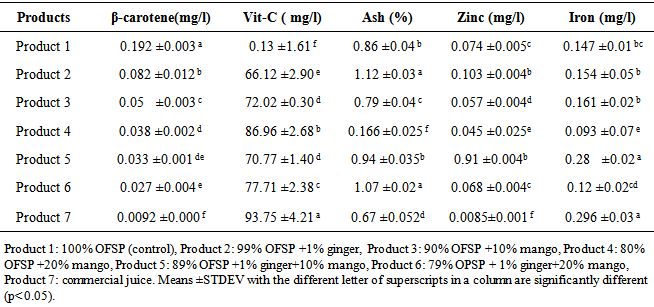
- The content of nutrients such as β-carotene, vitamin-C, ash, iron and zinc is presented in Table 4.2. Results varied significantly at p<0.05 for some juice products depending on formulation. β-carotene contents of the products varied from 0.0092±0.0006 mg/l to 0.192±0.003 mg/l. The highest value of β-carotene was contained in product 1 whereas product 7 contained lowest value. There was no significant difference between β-carotene content of product 4 & 5, and 5 & 6. The highest β-carotene recorded in product 1 and product 2 is due to higher amount of β-carotene in OFSP than when ginger and mango fruit are included. There is no evidence for the presence of β-carotene in ginger but product 2 had higher β-carotene content than others except product 1. Next to product 2, product 3 scored higher β-carotene that can still be attributed to the content of OFSP. Lowest value of β-carotene was measured in product 6 due to low OFSP (79%) and low β-carotene in mango juice. The result of this study is inconsistent with the WHO [50], Avulla [11] and Grabowski [23] which reported more than 10 folds β-carotene for cooked OFSP. Two possible reasons could be mentioned; first the juice product was cooked for 2 hours at the temperature of 60-70°C and during this time β-carotene might be degraded and lost in the final product [23]. The second major reason is the insolubility of β-carotene in water, thus β-carotene does not dissolve in water but slightly soluble in alcohol, fat, oil and soluble in organic solvents like ether [25]. Wireko [51] obtained 0.0458 mg/100g β-carotene for juice prepared from OFSP and which is in the range of this current study results.
|
4.2.2. Phytate and Bioavailability
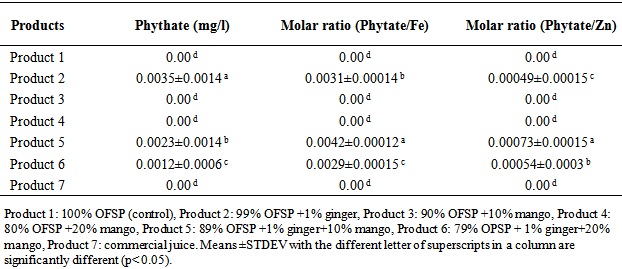
- The analytical results of phytate and bioavailability of minerals (iron and zinc) is shown in Table 4.3. Results of phytate and bioavailability varied at p<0.05 depending on blending ratio and formulation. The phytate content of the products was between zero & 0.0035±0.0014 mg/l. The highest value of phytate was contained in product 2 but it was not detected in product 1, 3 and 4. Even though the juices were cooked for 2 hours at a temperature of 60-70°C and pasteurized at 90°C for 10 minutes, phytate was detected in ginger flavored products, This can be characterized by the ginger that contains high amount of phytate than OFSP and mango juice [49, 36]. The highest value of phytate in product 2 could be due to the high percent of OFSP whereas the lowest value in product 6 could be due to lower percent of OFSP. Phytate is good metal chelator and prevents absorption minerals by the intestine, which has negative nutritional impact on metals necessary for good health especially iron and calcium [21, 24, 40].
|
4.3. Sensory Evaluation
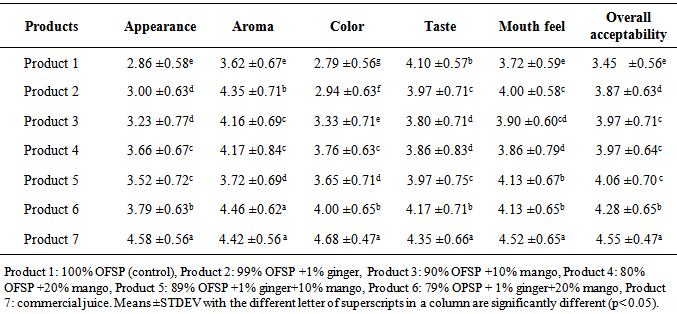
- As indicated in the table 4.4, results of sensory evaluation of the juice products varied at p<0.05. The results of appearance varied from 2.86±0.58 to 4.58±0.56. Product 7 scored highest in appearance while product 1 scored lowest. There was no significant difference between product 2 & 3, and 4 & 5. The lowest value in appearance of product 1 could be due to high TSS, thick and viscous character observed (Table 4.1). Thick and clumsy nature of the product decreased acceptability of the appearance [17]. Next to product 7, the highest value of appearance (3.79 ±0.63) was recorded for product 6, this may be due to the mango juice and ginger blended enhanced the appearance of the product. The study revealed sensory acceptance of appearance of the juice increased with increasing of mango juice and decreasing of OFSP.
|
5. Conclusions
- Based on the findings of this experimental work, physico-chemical, nutritional and sensory properties of the juice products developed altered based on the formulation used. OFSP-based juice products containing ginger seemed to have improved acidity while products with higher OFSP had elevated soluble solids and viscosity. Better β-carotene content was attained in products which contain higher OFSP. Mango juice flavored OFSP juices had enhanced vitamin-C and the higher the percent of mango juice added the better vitamin-C can be contained. Improved concentration of total mineral, zinc and iron obtained in ginger flavored OFSP products. Phytate was detected in the ginger containing products. However, the amount of phytate present in these products is none significant to hinder the bioavailability of zinc and iron. Even though, the overall acceptability test indicated all juice products scored acceptable evaluation, products flavored with combined OFSP, Mango juice and ginger were observed to have enhanced overall sensory acceptability. Generally during development of OFSP juices combinations of ingredients should be considered to improve overall quality and stability of the products.
ACKNOWLEDGEMENTS
- We, the authors, would like to appreciate and thank the institutions contributed for this research. The research was financially supported by International Center for Potato (CIP-USAID). The laboratory analysis of was conducted at Hawassa University and Ethiopian Public Health Institute (EPHI).