International Journal of Food Science and Nutrition Engineering

p-ISSN: 2166-5168    e-ISSN: 2166-5192

2014;  4(4): 91-97

doi:10.5923/j.food.20140404.01

Effect of Pre-treatment and Storage Condition on the Physicochemical Properties of Taro (Colocasia esculenta [L.] Schott) Flour

E. A. Baidoo, P. T. Akonor, C. Tortoe

Council for Scientific and Industrial Research, Food Research Institute, Accra, Ghana

Correspondence to: C. Tortoe, Council for Scientific and Industrial Research, Food Research Institute, Accra, Ghana.

Email:

Copyright © 2014 Scientific & Academic Publishing. All Rights Reserved.

Abstract

Taro is an important crop in Ghana. Matured freshly harvested taro was pre-treated for 2 min in hot water blanching at 100℃, 2% w/v sodium chloride, 2% w/v sodium hypochlorite, 50% v/v ethanol and distilled water as control. Pre-treatment samples were subsequently divided into two sub-groups and spread in a single layer in cardboard boxes, stored at cold room (4 - 5℃) and tropical ambient temperature conditions (28 ± 3℃). Samples were randomly selected from the two storage conditions for flour processing at period 0, 7, 14 and 21 days of storage. Reducing sugars and water activity were affected by the pretreatments. Blanched samples showed highest reducing sugar content whereas samples treated with 2% sodium chloride solution had the lowest. The highest water activity was recorded in 2% sodium chloride pre-treatments. The least water activity was observed for control samples. Both ambient and cold storage conditions did not have a significant influence on the parameters examined. Taro flour stored for 21 days neither changed their colour or reducing sugar content. However, water activity increased over 21 days of storage period. Significant changes did not occurred in the colour of flour samples particularly among L* and Hue angle values. However, colour of the pre-treatments and storage durations differed significantly from their control.

Keywords: Taro, Flour, Storage, Pre-treatment, Physicochemical properties

Cite this paper: E. A. Baidoo, P. T. Akonor, C. Tortoe, Effect of Pre-treatment and Storage Condition on the Physicochemical Properties of Taro (Colocasia esculenta [L.] Schott) Flour, International Journal of Food Science and Nutrition Engineering, Vol. 4 No. 4, 2014, pp. 91-97. doi: 10.5923/j.food.20140404.01.

1. Introduction

Taro (Colocasia esculenta [L.] Schott) is a widely cultivated root crop in Ghana with an annual production quantity of more than 1 million tons in year 2011 [1]. It is locally referred to as “brobey” and cultivated on subsistence basis for its cormels and leaves, which are boiled and eaten. In other parts of the world taro is made into ice cream and drinks [2], fresh or fermented paste, fried or mixed with other products [3, 4]. Although it is rich in digestible carbohydrates and micronutrients [5] and is quite affordable, taro remains largely underutilized. Taro deteriorates rapidly as a result of its high moisture and has been estimated to have a shelf-life of up to one month if undamaged and stored in a shady area [4]. Post-harvest losses of up to 30% have been reported [6] and is said to be caused by mechanical damage during harvesting, respiration, sprouting and microbial rotting [7]. This and other factors are major constrains in the utilization of the crop.
In order to reduce postharvest losses, expand its range of usage and consequently benefit immensely from its hidden economic potential, taro is processed into flour for use as a starting material for preparing certain customary delicacies and for industrial purposes. Studies into the production of taro flour, properties and its uses have been well documented [8, 9, 10, 11, 12, 13]. Characteristically, it is best suited in processes where reduced breakage and improved binding are required because of its small particle size distribution [14]. The qualities of taro flours in applications are based on their functional properties which are greatly affected by post-harvest operations such as handling or storage that precede processing. Undeniably, storage has been established to affect physiological, physicochemical and nutritional properties of root and tuber crops [15, 16, 17, 18].
Traditionally, taro is stored at room temperature in a humid area or buried underground in pits. The latter storage method, however, keeps the cormels physiologically active and prone to germination, while the later significantly reduces the starch and increases the sugar content [4]. For commercial transportation, cormels are refrigerated and kept in a cold chain. This reduces the susceptibility of cormels to rot and extend their shelf-life. Another storage method, which involves dipping cormels in selected chemicals before storage in plastic bags, neutralizes the effect of fungi and other spoilage-causing organisms. The impact of these treatments and suitable storage methods on the characteristics of flour produced from such cormels fundamentally remain a matter of deduction. Therefore the objective of the study was to establish suitable pre-treatment and storage conditions for taro and ascertain the physicochemical properties of their flours.

2. Materials and Methods

2.1. Sample Pre-treatment and Storage

Matured freshly harvested taro (Colocasia esculenta L. Schott) at 12 months maturity was obtained by special arrangements from a farm at Anyinam in the Eastern Region of Ghana. They were washed clean with tap water and transported the same day to the laboratory for analysis. The cleaned fresh taro samples were pre-treated for 2 min in hot water blanching at 100℃, 2% w/v Sodium chloride, 2% w/v Sodium hypochlorite, 50% v/v Ethanol and distilled water as control.
Pre-treatment was based on modification of previous methods [19, 20, 21, 22]. The pre-treatment samples were further divided into two sub-groups and spread in a single layer in cardboard boxes, stored at cold room (4 – 5℃) and tropical ambient temperature conditions (28 ± 3℃). Samples were randomly selected from the two storage conditions for flour processing at period 0, 7, 14 and 21 days of storage.

2.2. Flour Processing

The pre-treated and stored taro samples were selected for flour processing using method described by Badrie and Mellowes [23]. One and a half kilograms (1.5 kg) of taro was weighed, washed and peeled. The peeled cormels were weighed and cut into 2-5 mm thick pieces using a food slicer (Fold-up Electric Food Slicer mod.CFE 1954, Philips Atlantis). The slices were weighed and dried in a mechanical dryer (Apex, Royce Ross Ltd.) at 54℃ for 10 hr. The dried slices were weighed and milled using a disc attrition mill (Mill Machine, CSIR-FRI, Accra, Ghana). The flours were sieved with a 250 µm mesh and packaged in High Density Polyethylene (HDPE) bags, sealed and stored at 28 ± 3°C before use.

2.3. Determination of Reducing Sugars

Reducing sugar content of flour processed from treated stored taro cormels were determined by a spectrophotometric method [24].
2.3.1. Extraction of Soluble Sugars
One gram (1.0 g) of dried flour samples was weighed into thimbles and plugged with non-absorbent cotton wool. Two hundred milliliters (200 ml) of 85% v/v ethanol was transferred into flat bottomed flasks with three glass balls. The weighed thimbles were then placed into a soxhlet extractor and refluxed for two hours. After refluxing, the apparatus were allowed to cool and the thimbles removed using tongs. The liquid left in the extraction equipment represented the solution of ethanol soluble material. Ethanol was distilled off, allowed to cool and discarded and equal volume of distilled water was then added to the solution in the flask and the apparatus was reassembled to continue to distil off the ethanol, discarding after cooling. The distillation was continued until water was seen on the sides of the condenser. The solution obtained was aqueous and was made up to volume by washing carefully into a 250 ml volumetric flasks. The aqueous extract of soluble sugars solution was then stored for subsequent analysis of reducing sugars and total alcohol soluble sugars.
2.3.2. Preparation of Reagents
Solution A: Ferricyanide (potassium hexacyanoferrate III) (12.5 g) and 10.0 g anhydrous sodium carbonate were weighed into a 100 ml beaker and dissolved in distilled water. The solution was subsequently poured into 250 ml labeled grade A flask and made up to volume with distilled water.
Solution B: Anhydrous sodium carbonate (87.5 g) was weighed into 500 ml beaker. Distilled water was added to dissolve and then poured into a 1,000 ml labeled grade A volumetric flask and made up to volume with distilled water.
Ferricyanide Reagent: Solution A (25 ml) and 100 ml of solution B were pipetted into 100 ml volumetric flasks and made up to volume with distilled water.
2.3.3. Calibration Curve
A standard solution containing 5 mg glucose/ml was prepared with distilled water and serial dilutions were then prepared from the standard solution. Two milliliters (2ml) of each standard solution was added to 8 ml of ferricyanide reagent in 50 ml glass stoppered boiling tubes, in duplicates. This produces solutions containing 200μg, 500μg, 800μg and 1000μg of glucose in the 10 ml reaction mixture. Blank controls were prepared in duplicates containing 2 ml distilled water and 8 ml reagent. The contents of the tubes were mixed thoroughly and boiled for 15 minutes in a boiling water bath using a metal tube rack. The solutions were then cooled rapidly by placing in a cold water bath and mixed well. Absorbance of mixtures was measured at 380 nm with distilled water as the reference using a quartz cuvette. A graph of weight of glucose in the reaction mixture against absorbance was plotted.
2.3.4. Analysis of Aqueous Extracts
Aqueous extract (2 mls) was mixed with 8 ml of the ferricyanide reagent in a labeled 50 ml stoppered boiling tubes. Blank samples were prepared for each using 2 ml of sample and 8 ml of water. The contents were mixed well and boiled for 15 min in a water bath using a metal rack, cooled rapidly in a water bath of cold water and mixed well. The absorbance of samples was measured with a spectrophotometer (Cecil CE1021, Cambridge, England) at 380 nm with distilled water as the reference. Both the blank and sample were used and the reading of the blank deducted from that of the sample. The absorbance value from the calibration plot gave the value for the amount of sugar in the sample.

2.4. Determination of Water Activity of Taro Flours

Water activity of taro flours was measured using standard methods with a Rotronic Hygrolab 2 (Erotronic Ag. Ltd. USA).

2.5. Determination of Colour Taro Flours

The colour of taro flour was measured with a Minolta CR-310 (Minolta camera Co. Ltd, Osaka, Japan) Tristimulus colorimeter, recording L*, a* and b* values. The machine was calibrated with a reference white porcelain (Lo = 97.63; ao = 0.31 and bo = 4.63), before the determinations. The colour space parameters L*, a* and b* of the samples were calculated as: L* (Ls - Lo) represented lightness (with 0 – darkness to 100 – lightness); a* (as - ao) corresponds to the extent of green colour (in the range from negative – green to positive – redness); b* (bs - bo) represents blue in the range from negative – blue to positive – yellow. The Hue angle was calculated by the relation; Hue (h);
(1)
while the colour difference, ∆E, was calculated in relation to the control sample as follows;
(2)
Saricoban and Yilmaz, [25].
Where Lo, ao and bo are L*, a*, b* values for control sample.

2.6. Statistical Analysis

Analyses were carried out in triplicate and data expressed as means ± standard deviation. Analysis of variance was performed and Duncan multiple test range was used to separate means using the Statgraphics Centurion 16.1.11 (StatPoint Technologies Inc, USA, 2010) Comparisons between sample treatments and correlation analysis were done with a probability p ≤ 0.05.

3. Results and Discussion

3.1. Reducing Sugars

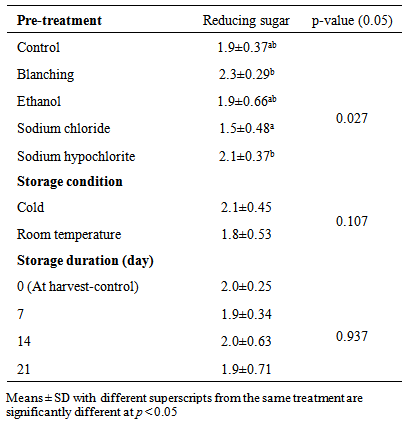
Reducing sugar content of the flour from different treatments was between 1.5 g/100g – 2.3 g/100g, while that for storage duration was between 1.9 – 2.0 g/100g (Table 1). These values are comparable to the reducing sugar content (1.3 – 2.3 g/100g) of taro flour from five different varieties observed by Njintang et al., [10] and reducing sugar (1.9 – 2.9 g/100g) of wheat flour reported by Pejin et al., [26]. Generally, the reducing sugar content of taro flour was not significantly affected by storage condition (p = 0.105) but rather by the pre-treatments (p = 0.027) to which the cormels were subjected, with the hot water blanched and Sodium hypochlorite treated samples showing higher values than control, Ethanol and Sodium Chloride treated samples. Reducing sugar also did not change significantly (p = 0.937), although a slight decrease was observed for 0 day to 21 days storage period. Treatment in Sodium chloride had the most profound effect on reducing sugar, followed by Ethanol. The blanched samples had the highest level of reducing sugar probably due to the degradation of some carbohydrates in reducing forms during hot water treatment. A similar occurrence of increase in glucose and other sugars was reported for sweetpotato [27].
Table 1. Reducing sugar contents in taro flours processed from pre-treated cormels stored for three weeks under cold and ambient conditions
     
Reducing sugars promote browning and may cause discoloration of flour or final product and therefore its content in raw roots has been recommended to be less than 2% to prevent significant colour changes during processing [28]. As a result of this phenomenon, arguments have been advanced to avoid reducing sugars during extrusion [29]. It is however desirable in bakery products processing since reducing sugars stimulates fermentation and rising of dough. Increasing levels of reducing sugars supports the formation of Maillard reaction in products which intensify flavor and crust colour of bakery products [30].

3.2. Water Activity

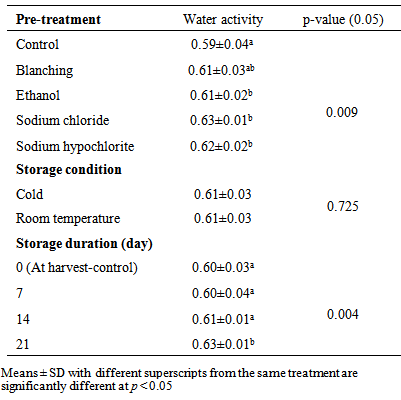
Water activity (aw) is one of the most essential parameters that influences the storage stability of food and has been established to be closely related to their physical, microbial and chemical properties [31, 32]. The aw was between 0.59 – 0.63 for the various pre-treatments samples and 0.60 – 0.63 for the storage period of 0 to 21 days. There were significant differences in aw among the various treatments (p = 0.009). A considerably (p = 0.004) steady rise in aw, particularly between 14 days to 21 days of storage was observed (Table 2). This probably attributed to the absorption of moisture from the headspace of the package [33] or from atmospheric moisture in the storage environment. Water activity of taro flour stored under ambient condition was not significantly different (p = 0.725) from that stored under cold conditions.
Table 2. Water activity of taro flours processed from pre-treated cormels stored for three weeks under cold and ambient conditions
     
Low aw of the flour is recommended for storage [34, 35]. An increase in aw over storage period could predispose flour to microbial attack and modification of chemical properties leading to irreversible organoleptic changes [36]. Though sugars may significantly contribute to lowering aw [37] it may also cause the flour to exhibit a certain degree of humectancy. For longer storage periods, flour should be stored in materials with good moisture barrier properties in less humid conditions because moisture uptake may result in flour particles transforming from free-flowing to lumpy agglomerated solids [38].

3.3. Colour of Taro Flour

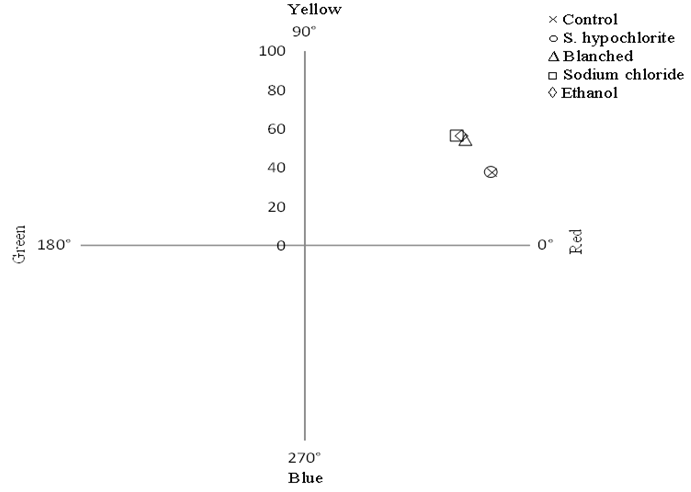
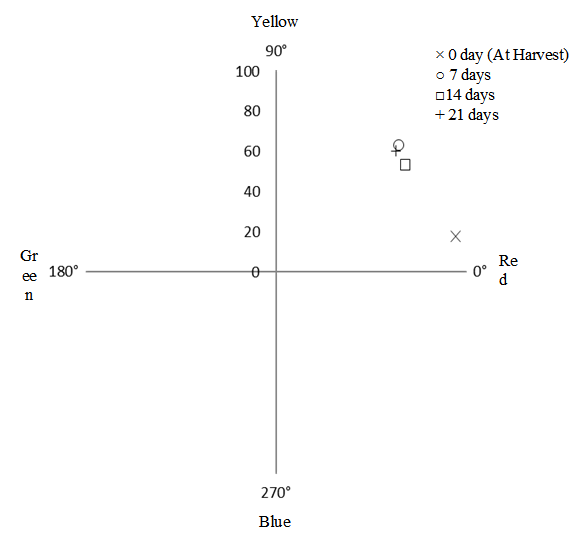
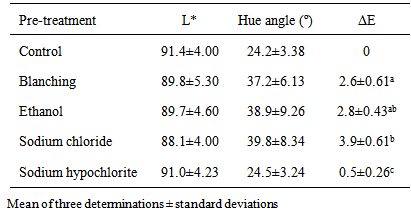
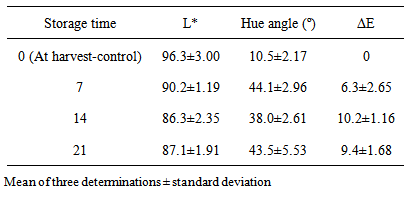
In finished products, colour is an aesthetic appeal. Colour of flour affects acceptability of products made from it, hence it is considered an essential quality attribute. It also indicates changes in quality of products due to processing and storage [39]. The lightness index (L*) of taro flour ranged between 88.1 (2% Sodium chloride) to 91.4 (Control) for the pre-treatments and 87.1 (21 days) to 96.3 (0 day) for storage duration (Tables 3 and 4). These differences in flour colour observed were however not significant (p > 0.05). Hue is the colour the human eye sees and is most critical for perception and acceptability [40]. The Hue was between 24.2º to 39.8º for pretreatments and 10.5º to 44.1º for storage conditions and did not significantly differ (p > 0.05) among pre-treatment or storage duration. These values suggest redness (Figures 1 and 2), even though it is light, as indicated by high L* values (Tables 3 and 4). Variations in Hue data may have been due to colour imparted to the flour by pigments from peel pieces which may not have been removed in the course of sample preparation. The presence of these pigments affects the redness and or yellowness of the flour [28]. Flour colour may also have been influenced by milling conditions and other contaminants [41].
Table 3. Mean effect of pre-treatment on mean colour parameters of taro flours processed from pre-treated taro stored for three weeks
     
Table 4. Mean effect of storage time on colour of taro flours processed from taro
     
Figure 1. Pretreated samples in Hue and lightness colour space
Figure 2. Samples stored for different periods in Hue and lightness colour space
Mean colour difference (ΔE), which is widely used to characterize the variations in colour of food during processing [42] significantly differed (p = 0.001) among pre-treatments, suggesting a difference in colour of the control and the pretreatments. Samples treated with Sodium hypochlorite had the smallest variation in colour from the control, while those treated with Sodium chloride had the largest (Table 3). The taro flour, over the storage period, had a different colour from the colour at 0 day (control) (p = 0.012) but no significant changes (p > 0.05) were observed from 7 to 21 days of storage.

4. Conclusions

Reducing sugars and water activity were affected by the pretreatments and blanched samples had the greatest reducing sugar content whereas samples treated with 2% sodium chloride solution had the least. The highest water activity was recorded in 2% sodium chloride solution compared to the other pretreatments. The control sample produced the least water activity. Storage condition (ambient or cold) did not have a significant influence on any of the parameters examined and storing the flour for 21 days neither changed their colour or reducing sugar content. However, water activity increased over 21 days of storage period. Significant changes were not observed in colour of flour samples particularly among L* and hue angle values, but colour of the pretreatments and storage durations differed significantly from their control.

ACKNOWLEDGMENTS

The authors acknowledge the financial support received from the CSIR-Food Research Institute.

References

[1]  FAOSTAT.http://faostat.fao.org/site/567/DesktopDefault.aspx?PageID=567#ancor1 Accessed 30/2/14, 2013.
[2]  H. Qiwei and L. Qingdian, ‘‘Research & development of Shangdong taro for high-value products and exports’’ In: D. Zhu, P. V. Eyzaguirre, M. Zhou, L. Sears and G. Liu (eds) Ethnobotany and genetic diversity of Asian taro: focus on China. Proceedings of the symposium on ethnobotanical and genetic study of taro in China: Approaches for the conservation and use of taro genetic resources. Laiyang Agricultural College, Laiyang, Shangdong, China. International Plant Genetic Resources Institute, Rome, 2000.
[3]  A. D. R. Arnaud-Vinas and K. Lorenz, ‘‘Pasta products containing taro (Colocasia esculenta L. Schott) and Chaya (Cnidoscolus chayamansa L. McVaugh)’’, Journal of Food Processing and Preservation, Vol. 23, 1999, pp. 1-20.
[4]  V. Lebot, ‘‘Tropical root and tuber crops: cassava, sweet potato, yams, aroids’’, CAB International, Oxfordshire, UK, 2009, pp. 279-360.
[5]  G. Vinning, ‘‘Select markets for taro, sweetpotato and yam’’ In: Rural Industries Report for Research and Development Corporation. RIRDC Publication No. 03/052, Kingston Act, 2003.
[6]  T. Agbor-Egbe, ‘‘Study on the factors affecting storage of edible aroids’’, Annals of Applied Biology, Vol. 119, 1991, pp. 121-130.
[7]  L. U. Opara, ‘‘Storage of edible aroids’’, In: F. W. Bakker-Arkema, (ed), CIGR Handbook of Agricultural Engineering, Vol. IV, Agro Processing Engineering, American Society of Agricultural Engineering, 1999.
[8]  M. S. Ammar, A. E. Hegazy and Bedeir, S. H, ‘‘Using of taro flour as partial substitute of wheat flour in bread making’’, World Journal of Dairy and Food Sciences, 4, 2009, pp. 94-99.
[9]  Y. N. Njintang and C. M. F. Mbofung, ‘‘Development of taro (Colocasia esculenta (L.) Schott) flour as an ingredient for food processing: Effect of gelatinization and drying temperature on the dehydration kinetics and colour of flour’’, Journal of Food Engineering, 58, 2003, pp. 259-265.
[10]  Y. N. Njintang, C. M. F. Mbofung, G. K. Moates, M. L. Parker, F. Craig, A. C. Smith and W. K. Waldron, ‘‘Functional properties of five varieties of taro flour, and relationship to creep recovery and sensory characteristics of achu (taro based paste)’’, Journal of Food Engineering, Vol. 82, 2007, pp. 114-120.
[11]  M. Kaur, P. Kaushal and K. S. Sanhu, ‘‘Studies on physicochemical and pasting properties of taro (Colocasia esculenta L. Schott) flour in comparison with a cereal, tuber and legume flour’’, Journal of Food Science and Technology, Vol. 50, 2013, pp. 94-100.
[12]  J. Rodriguez-Miranda, I. Ruiz-Lopez, E. Herman-Lara, C. E. Martinez-Sanchez, E. Delgado-Licon and M. A. Vivar-Vera, ‘‘Development of extruded snacks using taro (Colocasia esculenta) and nixtamalized maize (Zea mays) flour blends’’, LWT – Food Science and Technology, Vol. 44, 2011, pp. 673-680.
[13]  M. S. Sajeev, M. R. Manikantan, A. R. P. Kingsly, S. N. Moorthy and J. Sreekumar, ‘‘Texture analysis of taro (Colocasia esculenta L. Schott) cormels during storage and cooking’’, Journal of Food Science, Vol. 69, 2004, pp. E315-E321.
[14]  A. Aprianita, U. Purwandari, B. Watson and T. Vasiljevic, ‘‘Physicochemical properties of flours and starches from selected commercial tubers available in Australia’’, International Food Research Journal, Vol. 16, 2009, pp. 507-520.
[15]  C. A. Jaleel, R. Gopi, P. Manivannan, A. Kishorekumar, M. Gomathinayagam and R. P. Vam, ‘‘Changes in biochemical constituents and induction of early sprouting by triadimefon treatment in white yam (Dioscorea rotundata Poir.) tubers during storage’’, Journal of Zhejiang University, Science B, Vol. 8, 2007, pp. 283-288.
[16]  Z. D. Osunde and B. A. Orhevba, ‘‘Effect of storage conditions and storage period on nutritional and other qualities of stored yam (Dioscorea spp.) tubers’’, African Journal of Food Agriculture Nutrition and Development, Vol. 9, 2009, pp. 678- 690.
[17]  A. T. Osunsami, J. O. Akingbala and Oguntimein, G. B, ‘‘Effect of storage on starch content and modification of cassava starch’’, Starch/Starke, Vol. 41, 2006, pp. 54-57.
[18]  V. Ravi and J. Aked, ‘‘Review on tropical root and tuber crops, II. Physiological disorders in freshly stored roots and tubers’’, Critical Reviews in Food Science and Nutrition, Vol. 36, 1996, pp. 711-731.
[19]  M. R. Bikomo and J. K. Brecht, ‘‘Curing, washwater chlorination and packaging to improve the post-harvest quality of Xanthosoma cormels’’, Scientia Horticulturae, Vol. 47, 1991, pp. 1-13.
[20]  J. A. Bartz, and A. Kelman, ‘‘Reducing the potential for bacterial soft rot in potato tubers by chemical treatments and drying’’, American Potato Journal, Vol. 63, 1986, pp. 481-494.
[21]  J. E. Rickard. ‘‘Post-harvest management of taro (Colocasia esculenta var esculenta)’’, Alafua Agriculture Bulletin, Vol.8, 1983, No.2
[22]  I. Malaki, D. Hunter, N. Tuivavalagi, M. W. Ullah and F. Amosa, ‘‘The effects of sodium hypochlorite dipping, temperature and duration of storage, on the quality of fresh taro corms destined for overseas markets’’, Journal of South Pacific Agriculture, Vol. 10, 2003, No.1-2.
[23]  N. Badrie and W. A. Mellowes, ‘‘Cassava starch or amylase effects on characteristics of cassava (Manihot esculenta Crantz) extrudate’’, Journal of Food Science, 57(1), 1992, pp. 103-107.
[24]  Z. Bainbridge, K. Tomlins, K. Wellings, and A. Westby, ‘‘Methods for assessing quality characteristics of non-grains starch (Part 3.Laboratory methods)’’, Natural Resources Institute, Chatham, UK, 1996.
[25]  C. Saricoban and M. T. Yilmaz, ‘‘Modelling the effects of processing factors on the changes in colour parameters of cooked meatballs using response surface methodology’’, World Applied Sciences Journal, Vol. 9, 2010, pp. 14-22.
[26]  D. J. Pejin, O. S. Grujic, J. D. Pejin and S. D. Kocic-Tanackov, ‘‘Effect of yeast storage temperature and flour composition on fermentative activities of baker’s yeast’’, Proceeding of National Science, Matica Sroka Novi Sad, Vol. 116, 2009, pp. 305-313.
[27]  W. Hue, T. Shun-ichiro and Yoshiaki, H, ‘‘Effect of heat treatment on quality of sweet potato in wrapper type cold store during long-term storage’’, Journal of the Faculty of Agriculture, Kyushu University, Vol. 49, 2004, pp. 129-138.
[28]  M. Van-Hal, ‘‘Quality of sweet potato flour during processing and storage’’, Food Reviews International, Vol. 16, 2000, pp. 1-37.
[29]  M. Villamiel, ‘‘Non-enzymatic browning for cookies, crackers and biscuits’’, In: Y. H. Hui (ed), Bakery Products, Science and Technology, Blackwell Publishing, Iowa, 2006, pp. 433-442.
[30]  S. S. Sahi and K. Little, ‘‘Quality Control’’, In: Y. H. Hui (ed), Bakery Products Science and Technology, Blackwell Publishing, Iowa, 2006, pp. 319-336.
[31]  J. Chirife and J. A. Fontana, ‘‘Introduction: Historical Highlights of Water Activity Research’’, In: G. Barbosa- Canovas, J. A. Fontana, S. J. Schmidt and T. P. Labuza, (eds), Water Activity in Foods, Fundamentals and Applications. Blackwell Publishing and the Institute of Food Technologists, 2007, pp. 3-14.
[32]  E. Maltini, D. Torreggiani, E. Venir and G. Bertolo, ‘‘Water activity and the preservation of plant foods’’, Food Chemistry, Vol. 82, 2003, pp. 79-86.
[33]  J. M. Aguilera, J. M. del Valle and M. Karel, ‘‘Caking phenomena in amorphous food powders’’, Trends in Food Science and Technology, Vol. 6, 1995, pp. 149-155.
[34]  N. Abdullah, A. Nawawi and I. Othman, ‘‘Fungal spoilage of starch-based foods in relation to its water activity (aw)’’, Journal of Stored Products Research, Vol. 36, 2000, pp. 47-54.
[35]  L. De Bry, ‘‘Wheat flour of the third Millennium’’. In: Y. H. Hui (ed), Bakery Products, Science and Technology, Blackwell Publishing, Iowa, 2006, pp. 87- 96.
[36]  M. Le Meste, D. Lorient and D. Simatos, ‘‘L’eau dans les aliments’’, Paris: Lavoisier Tec et Doc Editions.
[37]  D. F. Day, ‘‘Microbiological Control in Sugar Manufacturing and refining’’, In: C. C. Chou (ed), Handbook of Sugar Refining: A manual for the design and operation of sugar refining facilities, John Wiley and Sons, New York, 2000, pp. 505-522.
[38]  J. M. Aguilera and D. W. Stanley, ‘‘Microstructural principles of food processing and engineering’’, 2nd edition, Aspen Publishers Inc., Maryland, 1999, pp. 403.
[39]  J. B. Hutchings, ‘‘Food colour and appearance’’, Aspen Publishers, Gaithersburg, Madison, 1999.
[40]  R. E. Wrolstad and D. E. Smith, ‘‘Colour Analysis’’, In: S. Nielsen, (ed), Food Analysis, 4th edition, Springer Science and Business Media, LCC, New York, 2010, pp. 573-586.
[41]  B. J. Dobraszczyk, ‘‘Wheat and flour’’, In: D. A. V. Dendy and B. J. Dobraszczyk, (eds), Cereals and Cereal Products, Chemistry and Technology, Aspen Publishers, Maryland, Vol. 35(1), 2001, pp. 71-76.
[42]  M. Maskan, ‘‘Kinetics of colour change of kiwi fruits during hot air and microwave drying’’, Journal of Food Engineering, Vol. 48, 2001, 169-175.