-
Paper Information
- Previous Paper
- Paper Submission
-
Journal Information
- About This Journal
- Editorial Board
- Current Issue
- Archive
- Author Guidelines
- Contact Us
International Journal of Food Science and Nutrition Engineering
p-ISSN: 2166-5168 e-ISSN: 2166-5192
2014; 4(3): 66-72
doi:10.5923/j.food.20140403.02
Estimation of Some Trace Metals in Commercial Fruit Juices in Egypt
 Abstract
 Reference
 Full-Text PDF
 Full-text HTML
Ayman S. M. Hassan, Tarek. A. Abd El-Rahman, Alaa S. Marzouk
The Central Agricultural Pesticide Lab, 7, Nadi El-Said St., 12618, Dokki, Giza, Egypt
Correspondence to: Ayman S. M. Hassan, The Central Agricultural Pesticide Lab, 7, Nadi El-Said St., 12618, Dokki, Giza, Egypt.
| Email: |  |
Copyright © 2014 Scientific & Academic Publishing. All Rights Reserved.
Some trace metals in fruit juices collected from the Egyptian markets were determined. The amounts of these metals were estimated by atomic absorption spectrophotometry. Metal (viz.: Cd, Cu, Fe, Pb and Zn) contents in the collected samples (apple, guava, mango, orange and peach juices and nectars) were found at different levels. Most of the collected samples had high limits of Fe than the allowed ones. Natural levels of Cu were found in mango and peach juice and nectar samples, while most other collected fruit juices and nectars had higher limits of Cu. All juice and nectar samples had low limits of Zn. The majority of samples were free from any detectable levels of Cd and Pb except few samples. These results indicated that metal contaminations by toxic metals (Cd and Pb) in a large number of juices and nectars were found below the guidelines for fruit juices given by the (commission regulation (EC) No 1881/2006). Although some essential metals are higher than the allowed limits but they may not represent a dangerous case.
Keywords: Fruit Juice, Cadmium, Copper, Iron, Lead, Zinc
Cite this paper: Ayman S. M. Hassan, Tarek. A. Abd El-Rahman, Allaa Marzouk, Estimation of Some Trace Metals in Commercial Fruit Juices in Egypt, International Journal of Food Science and Nutrition Engineering, Vol. 4 No. 3, 2014, pp. 66-72. doi: 10.5923/j.food.20140403.02.
Article Outline
1. Introduction
- Two thousands years before Christ the ancient medicine stated: "here, eat this root, drink this juice" and hence a wise man responded "don’t eat synthetics, drink this juice" [1]. Fruit juices are becoming an important part of the modern diet nowadays [2]. These nutritious beverages and juices can play a significant part in a healthy diet because they offer good taste and a variety of nutrients found naturally in fruits. Juices are available in their natural concentrations or in processed forms. These juices are fat-free, nutrient-dense beverages that are rich in vitamins, minerals and naturally occurring phytonutrients that contribute to good health [3]. A hundred percent healthy juice is that having no processed dextrose sugar such as that with cane sugar, high fructose corn syrup, and other synthesized or commercially processed sugar. The natural sugars have been shown to be effective in the success of 100% juice therapy. The negative studies have all been done on fruit drinks with dextrose sugars. Juice therapy involves the consumption of the juice of raw fruit or vegetables. A person may drink juice preventively to stay healthy, to treat a medical condition like cancer, or to produce a certain outcome, such as strengthening the immune system. In the present of industrialization and development, one concern should be the health of the future generation. Children are the most vulnerable age group of juice contamination in the food chain. Majority of research confirms that 100% juice does not make children overweight.Major and minor elements are considered as essential nutrients in food. The routine monitoring of the levels of these elements in fruit juices is a common quality control process [4]. On the other hand, the quality of fruit products is diminished with increasing concentration of toxic compounds, environmental pollutants such as toxic metals, especially Pb and Cd. The main source of human exposure to Pb and Cd is food, which is believed to provide about 80- 90% of daily doses of these metals [5], [6]. Lead and cadmium toxicity is well documented and is recognized as a major environmental health risk throughout the world. Lead affects humans and animals of all ages, but the affects of lead are most serious in young children. The International Agency for Research on Cancer has identified Cd as a known human carcinogen. Lead and cadmium poisoning results from the interaction of the metal with biological electron-donor groups, such as the sulfhydryl groups, which interferes with a multitude of enzymatic processes. Clinical manifestations of Pb toxicity include symptoms referable to the central nervous system, the peripheral nervous system, the hematopoietic system, the renal system, and the gastrointestinal systems. Cadmium is a cumulative nephrotoxicant that is absorbed into the body from dietary sources and cigarette smoking.Malnutrition is of major concern for many tropical developing countries. Iron (Fe) deficiency anemia, for example, affects one third of the world population. On the other hand, excessive iron intake has been associated with an overall increased risk of colorectal cancer. Both zinc and copper, two essential trace minerals, perform important biochemical functions and are necessary for maintaining health throughout life. Zinc constitutes about 33 ppm of adult body weight and is essential as a constituent of many enzymes involved in a number of physiological functions, such as protein synthesis and energy metabolism. Zinc deficiency, resulting from poor diet, alcoholism and malabsorption, causes dwarfism, hypogonadism and dermatitis, while toxicity of Zn, due to excessive intake, may lead to electrolyte imbalance, nausea, anemia and lethargy. The adult human body contains about 1.5 - 2.0 ppm of Cu which is essential as a constituent of some metal enzymes and is required in hemoglobin synthesis and in the catalysis of metabolic oxidation. Symptoms of Cu deficiency in humans include bone demineralization, depressed growth, and gastro-intestinal disturbances, among others, while toxicity due to excessive intake has been reported to cause liver cirrhosis, dermatitis and neurological disorders [7].The aim of the present study was to evaluate the healthiness of the commercial fruit juices and nectars from the point of view of metal contents.
2. Materials and Methods
2.1. Sampling
- Collection of fruit juice samples was performed from commercially available markets. Fruit juices samples of five different types (apple, guava, mango, orange and peach) were bought from different supermarkets. The most frequently consumed brands were selected, from local companies during 2012. A total of 45 fruit juice and 45 nectar samples were studied.
2.2. Chemicals, Stock Solutions
- All the chemicals used were Analytical Grade Reagents at least. The element standard solutions used for creating the calibration curves were prepared from 1000 mg/L Merck stock solution of the relevant element.
2.3. Instrumentation
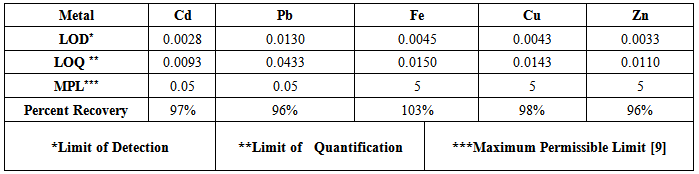
- Thermo Elemental model: Solar M Atomic Absorption Spectrophotometer was used for all the measurements. The current, wavelength and slit band width of each element were adjusted automatically by the instrument software.Determination of trace metals in fruit juices samples were performed according to the method of Official methods of analysis [8]. About 1 gram, to avoid the variations in density, of juice sample -in triplicates- was accurately weighed and transferred into Kjeldahel flask and digested with 10 mL of HNO3 acid and 1 mL of H2O2 then made up the volume to 25 mL by deionized water. Percentage recovery tests were carried out for the five metals by spiking 0.05, 0.05, 1.0, 1.0 and 0.1 μg /mL of Cd, Pb, Fe, Cu and Zn; respectively; to the similarly prepared samples as those unknown samples. The range of these percentage recoveries were between 96% -103% (Table 1).
|
3. Results and Discussion
- Some types of metal, such as Cu, Fe and Zn, are the naturally essential elements [10]. Other metals, such as Pb and Cd, have no biochemical or physiological importance, so they are considered as very toxic [11]. Lead and cadmium are naturally occurring elements that are hazardous when present at elevated concentrations.The levels of Cd, Cu, Fe, Pb and Zn the juice of apple, Guava, mango, orange and peach are determined using atomic absorption spectrometry.Figures 1-5 show the average concentrations of Cd, Cu, Fe, Pb and Zn in apple, guava, mango, orange and peach juices and nectar samples, respectively.
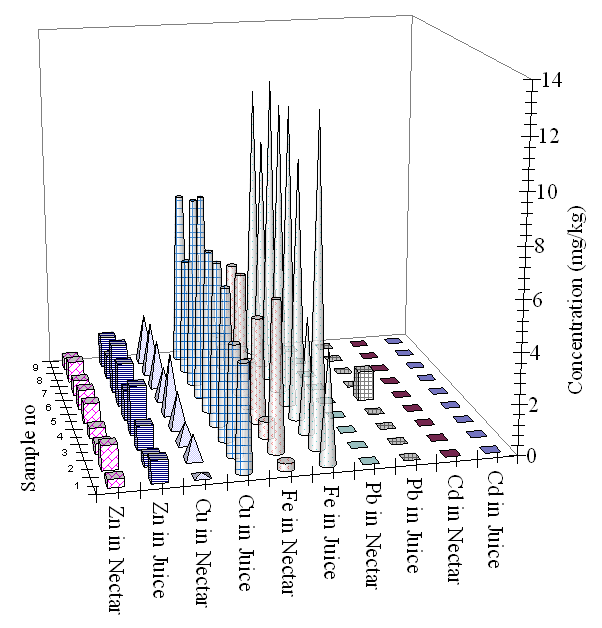 | Figure 1. The Concentrations of Cd, Cu, Fe , Pb and Zn in Apple Juices and Nectars (mg/kg) |
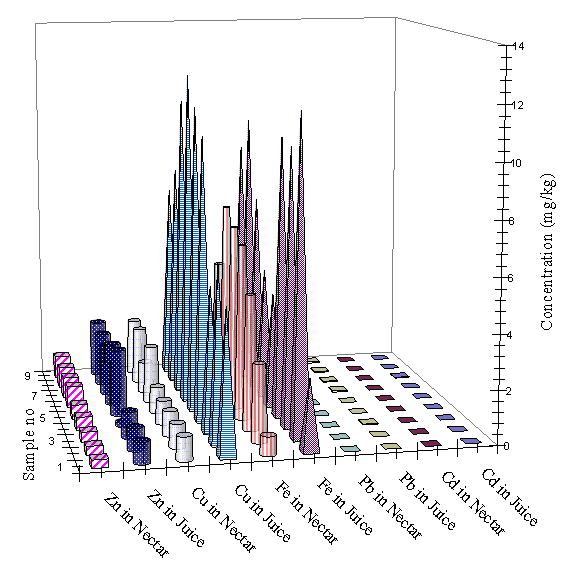 | Figure 2. The Concentrations of Cd, Cu, Fe , Pb and Zn in Guava Juices and Nectars (mg/kg) |
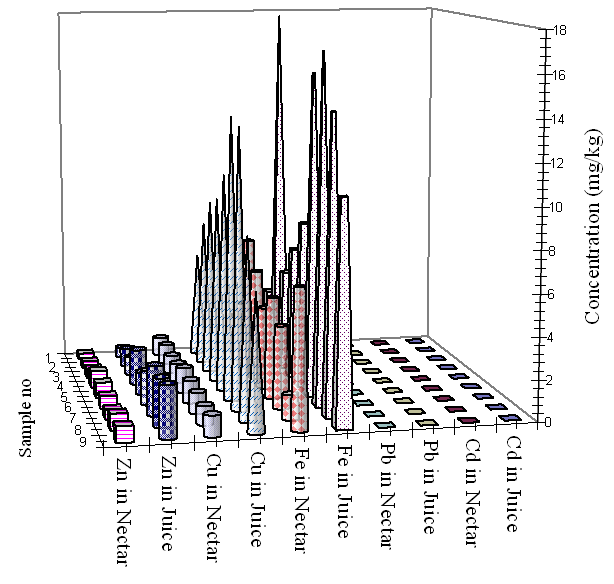 | Figure 3. The Concentrations of Cd, Cu, Fe , Pb and Zn in Mango Juices and Nectars (mg/kg) |
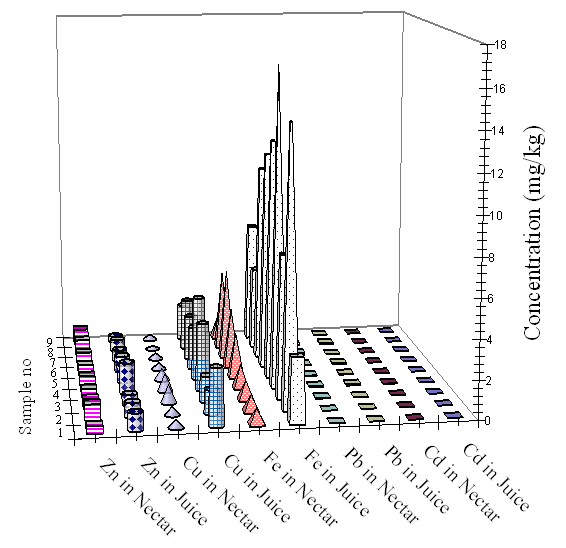 | Figure 4. The Concentrations of Cd, Cu, Fe , Pb and Zn in Orange Juices and Nectars (mg/kg) |
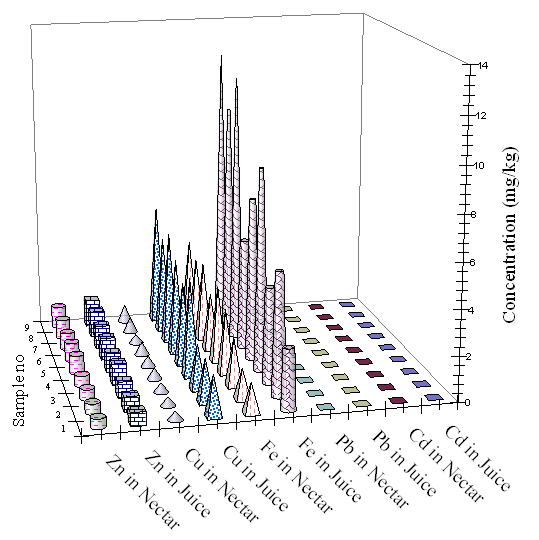 | Figure 5. The Concentrations of Cd, Cu, Fe , Pb and Zn in Peach Juices and Nectars (mg/kg) |
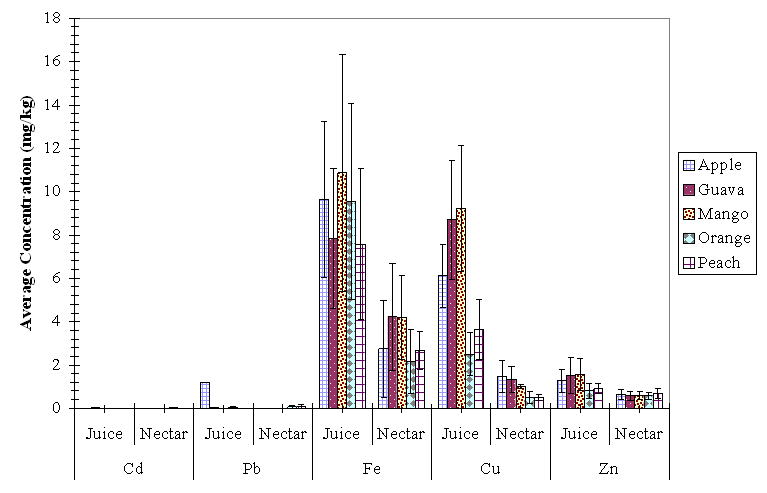 | Figure 6. The Average Concentrations of Cd, Cu, Fe , Pb and Zn in Fruit |
4. Conclusions
- Although some of the samples showed concentrations within or below the maximum allowed limits, most samples had higher iron levels than the allowed limits, copper values were moderate but all sample zinc were lower than the MPL. Toxic metal Cd has lower results than the limits. Most Pb in the juice sample was lower than the allowed limits except four orange samples of, one apple juice sample and one peach nectar sample. These findings may be in accordance with some ones and may contradict other authors. This may be due to different factors such as cultivation (soil, irrigation, atmosphere and weathering), juice processing and packing. From the statistical point of view, the difference between the values among the five metals for each of the juices and nectars of the five fruits was significant, but the differences in the mean values of each metal among the five fruit juice groups was not significant.