-
Paper Information
- Next Paper
- Paper Submission
-
Journal Information
- About This Journal
- Editorial Board
- Current Issue
- Archive
- Author Guidelines
- Contact Us
International Journal of Food Science and Nutrition Engineering
p-ISSN: 2166-5168 e-ISSN: 2166-5192
2014; 4(3): 55-65
doi:10.5923/j.food.20140403.01
The Relationship between Feed Composition and Milk Qualification in Some Iranian Grazieries
 Abstract
 Reference
 Full-Text PDF
 Full-text HTML
Mitra Noori1, Samira Ranjbar2, Razie Nazari3, Mehrana Jafari4
1Department of Biology, Faculty of Science, Arak University, Arak, 38156-8-8349, Arak-Iran
2MSc student of Department of Biology, Qum Islamic Azad University
3Department of Biology, Qum Islamic Azad University
4Department of Biology, Faculty of Science, University of Arak, P. O. Box: 879, 38156-8-8349, Arak-Iran
Correspondence to: Mitra Noori, Department of Biology, Faculty of Science, Arak University, Arak, 38156-8-8349, Arak-Iran.
| Email: |  |
Copyright © 2014 Scientific & Academic Publishing. All Rights Reserved.
Milk mainly composed of water, proteins (casein), sugar (lactose), fat and minerals (calcium and phosphorus). Also milk contains a few pigment, enzymes, vitamins, phospholipids and gas. There are close relationship between grazieries feed composition, milk products quality and community health level. In this study used feed composition were examined in ten traditional and industrial grazieries in Markazi Province, Iran in the years 2009 and 2010. Also ash, casein and fat weight (gr/lit) of obtained milk samples from these grazieries were seasonally measured. Data analyzed using EXCEL and SPSS. Results showed the most feed composition materials were Zea Myse, Medicago, Hordeum, Soya, Food complement and NaCl. Maximum and minimum milk ash weights were 37 in spring and 2 gr/lit in Autumn respectively. The highest and lowest casein levels were 123.5 and 55 gr/lit in Autumn and Spring respectively. 130.1 in Autumn and 23 in Spring were maximum and minimum gr/lit milk fat weight respectively in studied milk samples. Statistical analysis showed close and strong negative and positive correlations between studied milk parameters and consumed feed composition in grazieries. Negative correlation between milk casein and fat in winter and positive correlations between spring milk ash weight and concentrate. Also spring milk fat weight had positive correlation with and Zea Myse (ZM) and Hordeum (H) (P<0.01). The results show a reserved relationship between winter milk casein and fat. Milk composition depends on cow diets by the reason unequal seasonal feed in Iranian grazieries. Therefore, quality control of consumer milks always is needed and is effective on community health.
Keywords: Feed characters, Milk quality, Grazieries, Markazi Province, Iran, Community health
Cite this paper: Mitra Noori, Samira Ranjbar, Razie Nazari, Mehrana Jafari, The Relationship between Feed Composition and Milk Qualification in Some Iranian Grazieries, International Journal of Food Science and Nutrition Engineering, Vol. 4 No. 3, 2014, pp. 55-65. doi: 10.5923/j.food.20140403.01.
Article Outline
1. Introduction
- Milk is one of the essential products in the human diet, rich in nutritive components. Production and consumption of cow milk is the largest throughout the world [1, 2, 3]). Milk can be considered a source of macro- and micronutrients, and also contains a number of active compounds that play a significant role in both nutrition and health protection [4]. Milk and its products provide calcium and phosphorous and have role in human health. Recent studies have revealed using milk and its products importance in disease reduction and osteoporosis prevention. So, producing safe milk is important [5]. It is considered as a nearly complete food since it is a major source of dietary energy, protein, fat and major minerals. Also, milk and milk products are main constituents of the daily diet, especially for vulnerable groups such as infants, school age children and old age [6]. Milk is contributing on average 134 kcal of energy/capita per day, 8 g of protein/capita per day and 7.3 g of fat/capita per day [7]. Water is the main component in all milks, ranging from an average of 68 percent in reindeer milk to 91 percent in donkey milk. The main carbohydrate is lactose, which is involved in the intestinal absorption of calcium, magnesium and phosphorus, and the utilization of vitamin D [8]. Lactose also provides a ready source of energy for the neonate providing 30 percent of the energy in bovine milk, nearly 40 percent in human milk and 53–66 percent in equine milks [9]. Casein is the main protein constituent of milk. Cow milk contains more protein than human milk, but human milk contains more lactose, resulting in comparable energy contents. Cow and human milks differ in the amounts of various proteins. Human milk does not contain β-lacto globulin, one of the main proteins associated with cow milk allergy. Caseins comprise nearly 80% of the protein in cow milk but less than 40% in human milk. Caseins can form leathery curds in the stomach and be difficult to digest. In addition, the type of caseins that predominate in the two milks also differs, human milk containing more β-casein, which is more susceptible to peptic hydrolysis than αS-casein, particularly αs1-casein, which predominates in cow milk [10]. The casein content of cow milk varies between breeds and cheese makers often use milk from breeds with a higher κ-casein content in their milk [11]. The milk composition of dairy animals has been widely studied throughout the world and thousands of references are available especially with regard to milk consumed by humans. Milk composition is affected by various factors including stage of lactation, breed differences, number of calving (parity), seasonal variations, age and health of animal, feed and management effects, which makes it difficult to compare compositional data (in absolute terms) between studies [12]. In Iran consumer milk is produced after collecting from traditional and industrial grazieries and then supplied in both packed and non packed that are measured some milk characters using standard methods is influenced consumer milk quality. By the reason effects of feed composition on milk quality and characters and also the subject importance in human community health level, finding the relationship between feed composition and milk qualification is needed.For many years, dairy cows have been fed and managed to maximize milk fat production. Although these efforts were driven primarily by milk pricing formulas and were aimed at increasing the monthly milk cheque, they had many side-effects that were also beneficial [13]. O’Connor (1994) showed differences in cow milk composition are due to partly genetic and partly to environmental factors such as feeding [14]. Feeding programs and the management of these feeding programs can directly impact milk fat percentage or milk content can reveal cow diet condition. For example milk components, especially milk fat percentage, can give an indication of diet inadequacies. Decreased milk fat percent (less than 3.4% for Holstein or 4.1% for Jersey cows) can indicate an imbalanced ration being consumed, lack of effective fiber, or sorting of TMR. High milk fat percentages relative to milk protein in fresh cows can indicate excessive losses of body condition and risk for fatty liver-ketosis in the herd. Also low milk protein percent may indicate an inadequate metabolizable protein being fed to the herd. Lack of adequate metabolizable protein may include, but not be limited to, amino acid nutrition or suboptimum rumen fermentation. [15]. Adebabay et al (2009) reported the lowest fat composition of milk samples from treatment groups fed on noug seed cake and concentrate (comprising of 74% maize grain, 25% noug seed cake and 1% salt). This agrees with the generally accepted literature that cows fed low roughage rations yield milk of lower fat content compared to cows fed higher proportion of roughage diets [16]. Milk from wheat bran supplemented cows had the lowest protein content than milk from cows fed on other treatment feeds. The total solid content of milk from cows fed on hay plus grass pea bran was significantly lower than milk from cows on other treatment feeds (P<0.05). May be the solid-not-fat (SNF) content can fall if the cow is fed a low energy diet, but it is not greatly influenced by protein deficiency, unless the deficiency is acute [14]. Palmquist et al (1993) studied on feed and animal factors influencing milk fat composition. They found that milk fat composition was affected by the amount and composition of dietary component [17]. Broderick (1995) showed that feeding clover had a slight suppressing effect on milk production. Clover with concentrate supplementation or sorghum stover significantly improved milk yield and milk components. Concentrate supplementation in the feeding system of dairy cows depends on crops forage, which alone may not satisfy the nutritional requirements of dairy cows because of low quality, hence supplementation may exerce a positive effects on milk production and composition [18]. Production of milk protein is economically important to dairy producers and milk manufacturers. Numerous investigations have been conducted to define dietary factors that influence milk protein content [19, 20, 21]. In this study used feed composition were examined in ten traditional and industrial grazieries in Markazi Province, Iran in the years 2009 and 2010. Also ash, casein and fat weight (gr/lit) of obtained milk samples from these grazieries were seasonally obtained.
2. Materials and Methods
2.1. Study Sites and Collection of Their Feed Composition
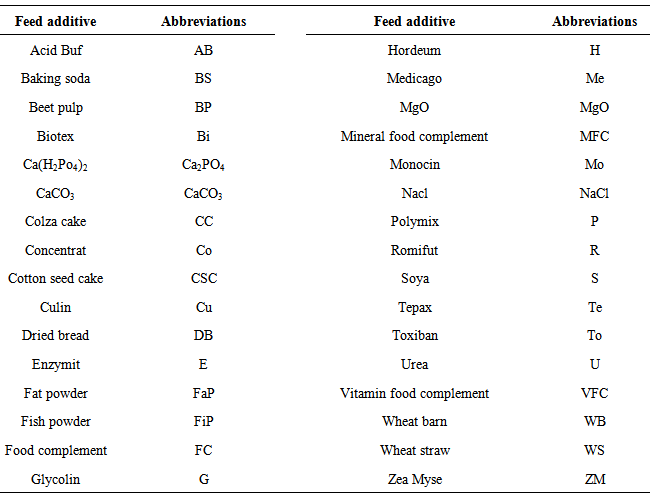
- Ten traditional and industrial grazieries in Markazi Province, Iran were randomly selected. Then thirty two main and additive materials of their feed composition were seasonally sampled from these garzieries in labeled nylon bags (Table 1). All of feeds collection information was recorded (Table 2). Then isolation, cultivation and identification of feed fungi were done. Also their produced milk aflatoxin M1 was measured using ELISA method. Relationship between feed composition, molds and milk aflatoxin were calculated that results were published in our previous work [5].
2.2. Milk Collection and Their Characters Studies
- Coincidental feed sampling, milk collection of 10 studied traditional and industrial grazieries was done. Milk samples were collected in sterile falcons in both morning and evening times and were sent near ice to the laboratory. Three quantitative characters (ash, fat, casein weight gr/lit) were seasonally examined in collected milk samples based on [22].
2.3. Statistical Analysis
- Milk data were analyzed using the EXCEL (Table 3 and Figure 1) and SPSS used for both milk and feed data statistical analyzing. For finding correlation between feed composition and seasonally examined milk characters results, all of data were analyzed with correlation analysis (Pearson, Spirman and Kendal) methods (P< 0.01). Pearson and Spirman methods (2 tailed) were the best (Table 4-7).
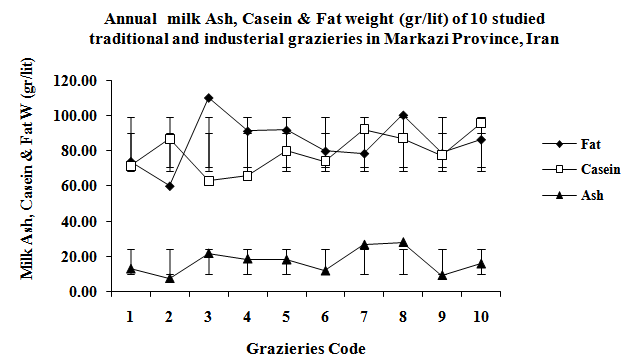 | Figure 1. Annual milk ash, casein and fat weight (gr/lit) of 10 studied traditional and industrial grazieries in Markazi Province, Iran |
|
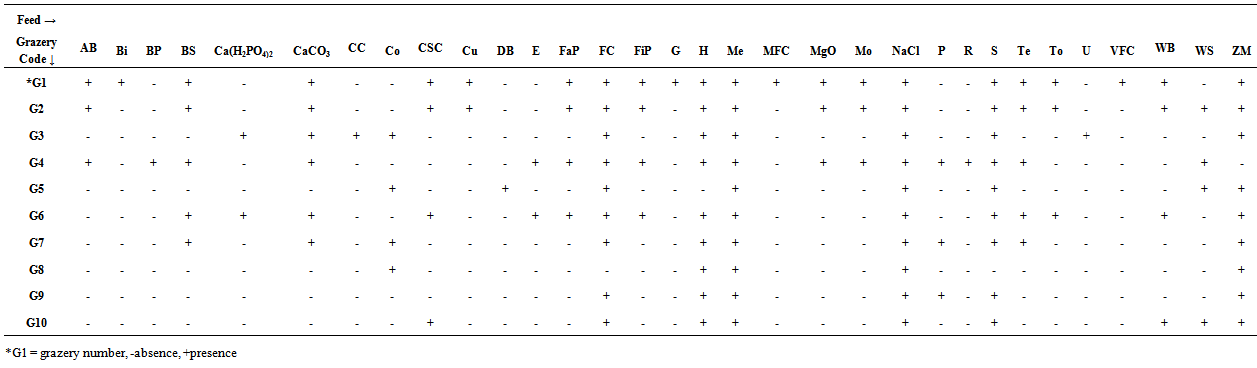 | Table 2. Feed composition data of 10 studied traditional and modern grazeries in Markazi Province, Iran |
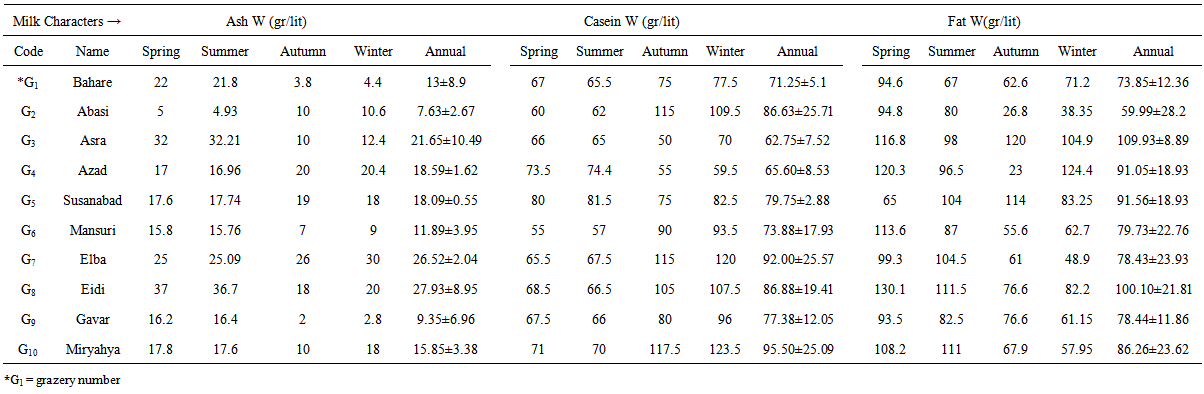 | Table 3. Annually and seasonally milk characters data of 10 studied traditional and modern grazeries in Markazi Province, Iran |
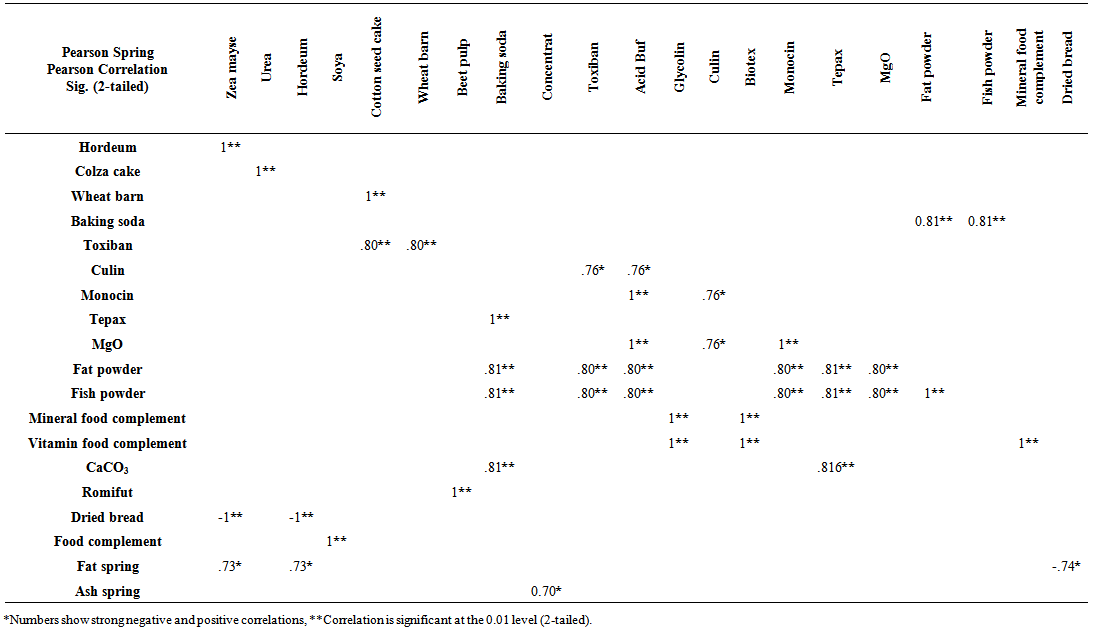 | Table 4. Correlation between feed composition and studied milk characters data using SPSS (Pearson method-Spring) (P< 0.01). Abbreviations explanations are in Table 1 |
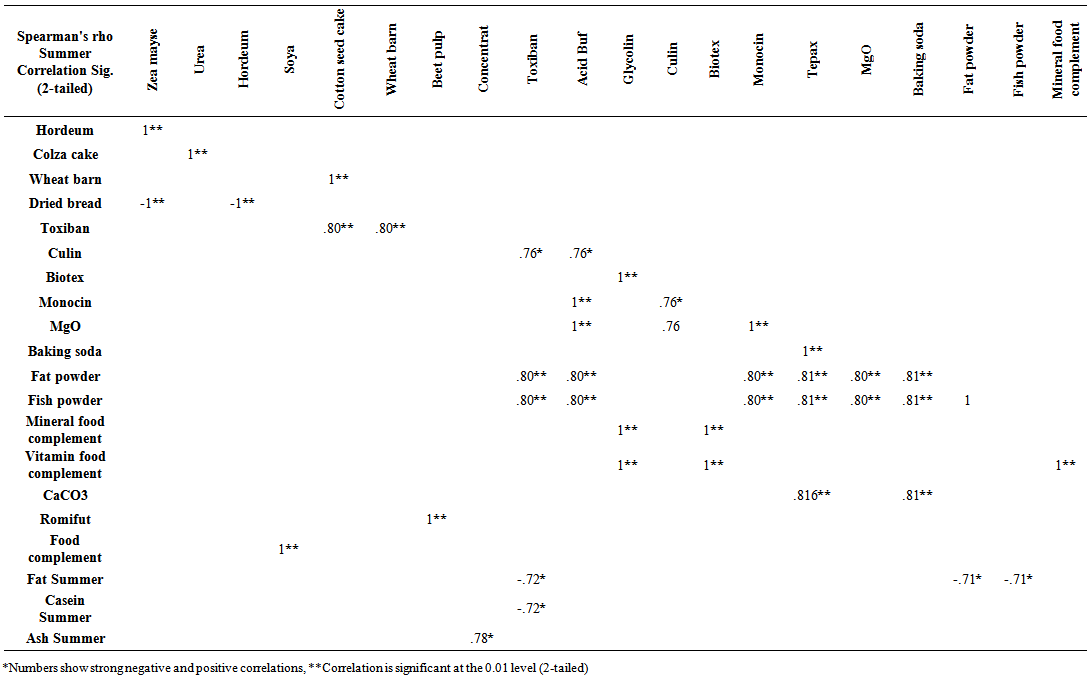 | Table 5. Correlation between feed composition and studied milk characters data using SPSS (Spearman method-Summer) (P< 0.01). Abbreviations explanations are in Table 1 |
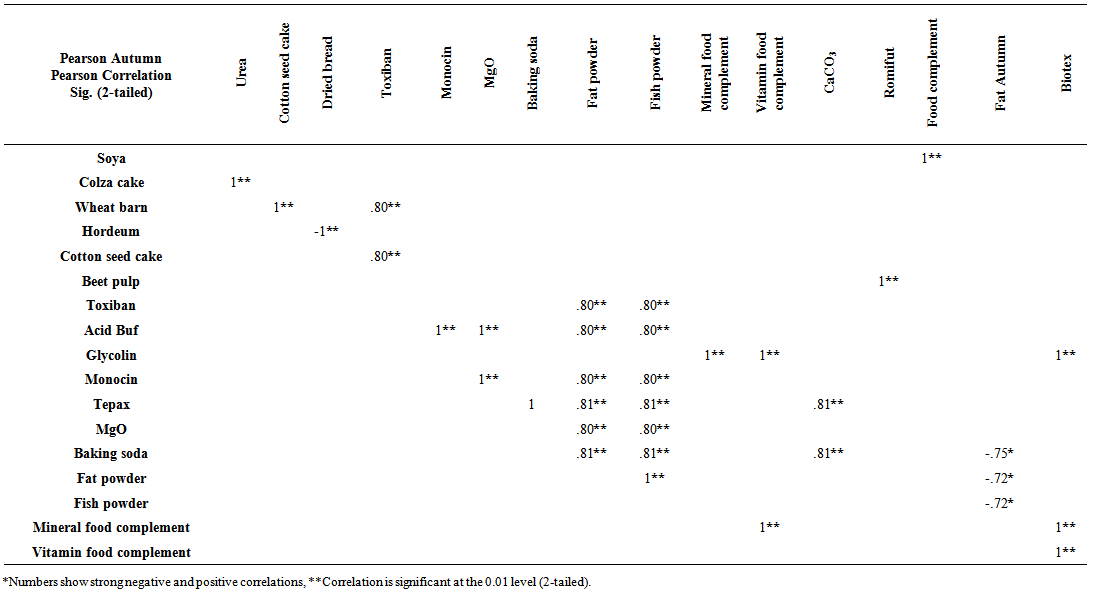 | Table 6. Correlation between feed composition and studied milk characters data using SPSS (Pearson method-Autumn) (P< 0.01). Abbreviations explanations are in Table 1 |
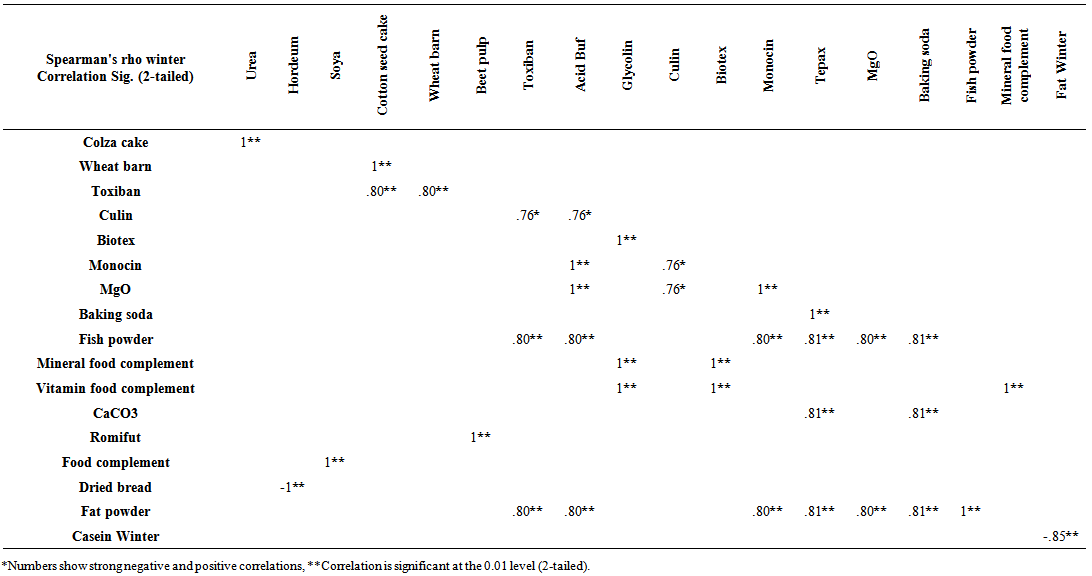 | Table 7. Correlation between feed composition and studied milk characters data using SPSS (Spearman method-Winter) (P< 0.01). Abbreviations explanations are in Table 1 |
3. Results
- Feed composition data of 10 studied traditional and modern grazeries in Markazi Province, Iran has been shown in Table 2. As Table 2 shows the most feed composition materials in all of studied sites were Zea Myse, Medicago, Hordeum, Soya, Food complement and NaCl. Vitamin and mineral food complements, Biotex and Glycolin are just used in G1. Beet pulp and Romifut only in G4, Colza cake and Urea in G3 and Dried bread (DB) in G5 are added in comparison with others (Table 2). Annually and seasonally milk characters data of 10 studied traditional and modern grazeries in Markazi Province, Iran are shown in Table 3 and Figure 1. As Table 3 shows G8 has the maximum milk ash weight (37 and 36.7 gr/lit) respectively in Spring and summer and G9 with 2 gr/lit in autumn was minimum. The highest casein level was observed in G10 autumn milk (123.5 gr/lit) and G4 and G6 with 55 gr/lit milk casein weights in spring and autumn were minimum respectively. G8 with 130.1 gr/lit milk fat weight in spring was highest and G4 in autumn had minimum fat (23 gr/lit) (Table 3). Maximum annual fat weight mean in G3, maximum annual casein weight mean in G10 and maximum annual ash weight mean in G8 were observed (Table 3 and Figure 1). Tables 4-7 show correlation between feed composition and studied seasonally milk characters data using SPSS (Pearson and Spirman methods) (P< 0.01).
4. Discussion
- Our results show seasonally feed are not equal in Iranian Grazieries and milk composition depends on cow diets. Feeding programs and the management of these feeding programs can directly impact milk composition. Dairy cows are ruminants and their digestion processes are set up to turn forages into nutrients. Cow’s mammary gland can use to produce milk and milk fat. Maintaining the pH in the rumen is important for the bacteria to produce the nutrients in the correct amounts needed by the mammary gland. Also a lower rumen pH can result in the production of rumen products that have a detrimental effect on milk fat synthesis at the level of the mammary gland cells. Dairy cows need to be fed diets that contain adequate amounts of forage and that forage must contain enough long particles to stimulate the cow to chew her cud to maintain rumen pH. Cud chewing stimulates the secretion of saliva which buffers the contents of the rumen [15]. As Tables 4-7 show there are close and strong negative and positive correlations (significant P<0.01) between studied milk parameters and consumed feed composition in grazieries, that are important for community health level. So evaluating each of these areas is necessary to correct the milk composition especially fat for milk quality improvement.Table 4 showed positive correlations between spring milk ash weight and concentrate (P<0.01). Also spring milk fat weight had positive and significant correlation with Zea Myse (ZM) and Hordeum (H) and had a negative correlation with dried bread (DB). Spring milk casein did not show any correlation with feed composition in this season. In Table 5 spring ash weight was positively correlated with Concentrate (Co). Our results showed concentrate presence can affect milk ash weight as Karim and Lotfi (1987) and Behgar et al (1991) found in their researches. Soya concentrate is commercially produced as animal proteins replacing and was used in grazieries [23, 24]. Also concentrates are prepared using Hordeum, beet pulp, cotton seed cake with complementary adding some vitamins and minerals that are consumed in grazieries and proved effective on milk ash or milk mineral compounds [25, 26]. Concentrate is an element feed composition in G3, G5, G7 and G8 (Table 2). These grazieries had high milk ash weight levels comparing with others (Table 3). Negative correlation was observed between summer milk casein and fat weight with Toxiban (To). Also summer milk fat weight had a negative and significant correlation with fat and fish powder (FaP & FiP) (Table 5). Milk fat level is quite variable and reasonably responsive to diet. A large portion of the variation observed in milk fat can be attributed to changes in fatty acids produced in rumen fermentation. The most common dietary cause of a low fat test is a diet containing a low level of forage (Zea Myes, Hordeum) and a high level of concentrate [13]. Feeding higher amounts of unsaturated fat to cows increases this fatty acid in milk from a low content of 0.4 to 0.5% of fatty acids up to 1.5 to 1.8% [27]. Milk fat percent: Milk components, especially milk fat percentage, can give an indication of diet inadequacies. Decreased milk fat percent (less than 3.4% for Holstein or 4.1% for Jersey cows) can indicate an imbalanced ration being consumed, lack of effective fiber, or sorting of total mixed ratio (TMR). High milk fat percentages relative to milk protein in fresh cows can indicate excessive losses of body condition and risk for fatty liver-ketosis in the herd [15]. A negative and significant correlation was observed, between autumn milk fat weight and both Baking soda (BS) and fat and fish powder (FaP & FiP). Ash and casein weight did not show any correlation with feed composition in autumn (Table 6). Table 7 showed a negative and significant correlation between milk casein and fat in winter. Adding fat to diets for lactating cows generally increases milk yield (if energy is limiting in the diet) and increases milk protein yield but decreases milk protein concentration, typically by 0.1 to 0.2 percentage units. The metabolic processes attributing to this decline in milk protein concentration has reviewed considerable attention, but the mechanism may still be uncertain [28, 29]. High milk casein and low winter milk fat in G10 (Table 3) confirmed negative correlation between winter milk casein and winter fat (Table 7). It seems that there is a reserved relationship between winter milk protein (casein) and fat as Ersali et al (2009) showed in their work [30]. It has proved that non packed milk has a high fat level because laboratory studies and standardization are not done and this is a hard threat for non packed consumers. So evaluating each of these areas is necessary to correct the milk composition especially fat for milk quality improvement.
5. Conclusions and Proposals
- Milk producer cells in mammary glands need to have enough precursor levels. Therefore nutrition is a critical agent for milk production and composition. Basic elements and compounds such as carbohydrates, amino acids, fatty acids and mineral elements are absorbed from blood. So, changing in cow diet can produce changing in milk composition percentage. But changing diet cannot influence lactose with the exception of cow malnutrition or gluttony. It is known that milk and milk products are main constituents of the daily diet, especially for vulnerable groups such as infants, school age children and old age. By the reason of the effects of feed composition on milk quality and characters and also the subject importance in human community health level feeding programs and their management can directly impact milk composition. So evaluating each of these areas is necessary to correct the milk composition especially fat for milk quality improvement. In this respect, proposals for further optimization are: milk lactose determination can reflect milk safety and quality, the presence of Hordeum, Zea Myse with their starch with amino acids complementary, low fat powder content and bread powder absence in cow diet, may result in increased milk protein, concentrate presence in cow diet can increase milk ash weight and for increasing milk fat 40/60 forage to concentrate is the best ratio.The authors would like to thank of all studied grazieries managements and their workers for permission and helping feed and milk collection.