-
Paper Information
- Next Paper
- Previous Paper
- Paper Submission
-
Journal Information
- About This Journal
- Editorial Board
- Current Issue
- Archive
- Author Guidelines
- Contact Us
International Journal of Food Science and Nutrition Engineering
p-ISSN: 2166-5168 e-ISSN: 2166-5192
2014; 4(1): 9-14
doi:10.5923/j.food.20140401.02
Blood and Liver Antioxidant Capacity of Mice Fed High Fat Diet Supplemented with Digested Oat Bran Proteins
 Abstract
 Reference
 Full-Text PDF
 Full-text HTML
Sara Jodayree1, Zachary R. Patterson2, Harry MacKay2, Alfonso B. Abizaid.2, Apollinaire Tsopmo1
1Food Science and Nutrition, Department of Chemistry, Carleton University, 1125 Colonel By Drive, K1S 5B6 Ottawa, ON, Canada
2Department of Neuroscience, Carleton University, 1125 Colonel By Drive, K1S 5B6 Ottawa, ON, Canada
Correspondence to: Apollinaire Tsopmo, Food Science and Nutrition, Department of Chemistry, Carleton University, 1125 Colonel By Drive, K1S 5B6 Ottawa, ON, Canada.
| Email: |  |
Copyright © 2012 Scientific & Academic Publishing. All Rights Reserved.
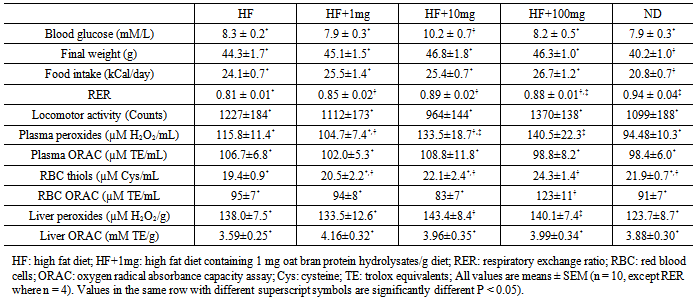
The aim of this study was to assess the effect of three concentrations of oat bran protein hydrolysate (OPH) (1, 10, 10 mg/g diet) on oxidative stress marker in high fat fed animals. CD-1 male mice were placed into five groups and fed normal diet (ND), high fat (HF), and HF containing 1, 10, and 100 mg OPH/g of HF-diet for 3 weeks. Blood was collected at necropsy and analyze for glucose and markers of oxidative stress. At the highest level of OPH the oxygen radical absorbance capacity value of erythrocytes (123.1 ± 11.1 mMTrolox equivalents (TE)/mL blood) was higher (p < 0.05) than the value of HF group (96.5 ± 6.6 mM TE/mL) indicating higher scavenging activity that may be explained by higher thiol concentration detected. Liver superoxide dismutase (SOD) antioxidant enzyme activity was 13.2% lower in mice on HF-diet compared to those who received normal diet. Supplementation of HF-diet with OPH increased SOD activity to ND group level. OPH also had positive effect on respiratory exchange ratios but did not affect liver scavenging activity, calorie intake or bodyweight.In conclusion, addition OPH to HF diet increased radical scavenging activity in erythrocytes and SOD activity in mice liver samples.
Keywords: Oat Bran, Antioxidant, Oxidative Stress, High Fat, Antioxidant Enzymes, Respiratory Exchange Ratio
Cite this paper: Sara Jodayree, Zachary R. Patterson, Harry MacKay, Alfonso B. Abizaid., Apollinaire Tsopmo, Blood and Liver Antioxidant Capacity of Mice Fed High Fat Diet Supplemented with Digested Oat Bran Proteins, International Journal of Food Science and Nutrition Engineering, Vol. 4 No. 1, 2014, pp. 9-14. doi: 10.5923/j.food.20140401.02.
Article Outline
1. Introduction
- The increase in bodyweight as a result of high fat or high calorie diet is a health concern worldwide because of its association with chronic diseases like coronary heart disease, dyslipidemia, glucose intolerance, diabetes, elevated blood pressure, inflammation and metabolic syndrome[1]. It has been demonstrated that higher concentrations of reactive oxygen species (ROS) produced in obesity play an important role in the pathogenesis of this condition and its complications[2,3]. Moderate amounts of ROS are produced to specifically regulate intracellular signaling pathways by reversible oxidation of proteins such as transcription factors or protein kinases[4]. However, when they are chronically produced at high levels, mitochondrial or NADPH-derived ROS can also have deleterious effects through irreversible oxidation of their principal targets such as lipids, proteins, and DNA[5]. To prevent oxidative stress, the body contains antioxidant enzymes (e.g. superoxide dismutase, catalase) and non-enzymatic antioxidants (e.g. glutathione, vitamins E and C) to neutralize ROS[6]. Nevertheless, the activity of some of these enzymes is reduced in plasma of obese human and animals[2].Several studies have reported that addition of phytochemicals to high fat diet can attenuate damage caused by oxidative stress[7]. Research has also revealed that certain plant derived proteins and their hydrolytic products such as peptides possess biological activities that may be useful in the prevention or treatment of certain chronic diseases in which oxidative stress plays a role[8]. For instance, pea protein hydrolysate was recently demonstrated to lower blood pressure in both hypertensive rats and humans[9]. Oat phenolics and dietary fibers have been shown to reduce the risk of cardiovascular diseases by lowering plasma cholesterol and preventing the oxidation of low density lipoprotein in animals and humans[10]. The investigation of other hydrolyzed food proteins is therefore needed to identify potential bioactive peptides that can be used in the formulation of foods or drinks to reduce the incidence oxidative stress in disease conditions. Recently, it was reported that digested oat proteins possess antioxidant properties in vitro[11]. However, their effects in vivo have not been investigated. The objective of this study was therefore to determine the effect of high fat diet supplemented with oat bran protein hydrolysate on blood and liver antioxidant capacities, body weight, glucose level or respiratory exchange ratio in mice.
2. Materials and Methods
2.1. Materials and Chemicals
- Oat bran (item number 115-002) was donated by Can-Oat Milling Inc. (Portage La Prairie, MB, Canada). Trypsin 13,000-20,000 benzoyl-L-arginine ethyl ester units/mg, 2,2’-azobis (2-methylpropionamidine) dihydrochloride (AAPH), mono- and dibasic potassium phosphates, 6-hydroxy-2,5,7,8-tetramethylchroman-2-carboxylic acid (Trolox), and rutin trihydrate were obtained from Sigma- Aldrich (Oakville, ON, Canada). Methanol, hexane, fluorescein, hydrogen peroxide (H2O2) were purchased from Fisher Scientific Co. (Nepean, ON, Canada).
2.2. Protein Extraction, Hydrolysis and Amino Acid Composition
- The Oat bran was defatted for 1h with hexane (1:3 ratio) in an incubator shaker (150 rpm) model G25 from New Brunswick (Edison, NJ, USA). To the defatted sample 1 mol/L NaCl (1:8) ratio (w:v) was added and the pH was set to 9.5. The mixture was stirred for 30min at room temperature and centrifuged 5000g, 25min, 4°C. To obtain protein isolate, the supernatant was adjusted to pH 4.0 and centrifuged at 10,000g, 4°C, for 50 min. The precipitate (i.e. protein isolate) was collected and freeze dried. Enzymatic hydrolysis was performed in pH 8.0 water (1:10 (w/v)) with trypsin (1:50 (w/w)), 37°C, 20 h, and 100 rpm. The enzyme was inactivated by heating the reaction mixture to 90°C for 10 min. The digested proteins were centrifuged at 5000g for 15 min to removed undigested proteins. The hydrolysate was freeze dried to produce 3.52g of oat protein hydrolysate (OPH)/100 g oat bran. The amino acid (AA) composition of the freeze dried OPH was performed by Advanced Protein Technology Centre (Ontario, Canada). Picomoles of individual amino acids detected were converted to percentage relative to the total amino acids content.
2.3. Animals and Diet
- The current study protocol was approved by the Carleton University’s Animal Care Committee (Protocol number P10-4) and the guidelines of the Canadian Council on Animal Care were followed.Fifty two CD-1 male mice (22.5 ± 2.5g) aged 8 weeks obtained from Charles River Laboratories (Saint Constant, Quebec) were individually housed in standard plastic shoe box cages in a room maintained at 22°C with 20% relative humidity and 12/12h light/dark cycle with lights on at 07:00 h for the duration of the study. Animals were fed with pelletized chow diet for 4 weeks. They were then randomly assigned to one of five groups (n = 10) according to the diet they received: 1) High fat diet (HF); 2) HF + 1mg of oat protein hydrolysate (OPH)/g of HF; 3) HF + 10mg OPH/g of HF; 4) HF + 100mg OPH/g of HF and 5) regular mouse chow or normal diet (ND). Each group received their respective diet for three weeks ad libitum and had free access to water throughout the study. The control diet (2014 Teklad Global, 2.9 Kcal/g) and the HF diet (No. TD.06414, 5.1 Kcal/g) were obtained from Teklad Harlan (Indianapolis, IN). Body weight and diet consumption were recorded daily and used to calculate caloric intake. At the end of the experimental period, thirty mice (n = 6) were rapidly decapitated. Twenty (n = 4) were housed in metabolic chambers (TSE Systems, Chesterfield , MO, USA) for 48 h during which mice had free access to food and water. Locomotor activity was then determined using a multi-dimensional infrared light beam system while respiratory exchange rate (RER) was calculated based on oxygen consumption and carbon dioxide production. Trunk blood samples were collected into heparin-coated tubes following decapitation and used for glucose determination (Accucheck® glucose meter). Subsequently, all blood samples were centrifuged at 1000gand 4°C for 15 min to obtain plasma and red blood cells. Liver samples were removed, rapidly frozen in liquid nitrogen and stored at -80 °C until analysis.
2.4. Determination of Markers of Oxidative Stress
- Peroxyl radical scavenging activity was determined using oxygen radical absorbance capacity (ORAC) assay. The measurement was performed on a microplate fluorescence reader model FLx800 (Bio-Tek Instruments, Inc., Winooski, VT) as reported[12]. Red blood samples were diluted 50 times with buffer. For liver samples, 100 mg of tissue were homogenized with 900 mL phosphate buffer (10 mM pH 7.4), vortex mixed and centrifuged at 2400g for 10 min before analysis. The results were expressed as μmolTrolox Equivalents (TE) and are means ± SEM. Total thiols were measured using Ellman’s method[13], a colorimetric assay based on the reaction of sulfhydryl groups with DTNB (5,5-dithiobtis-2 nitro benzoic acid) to form a yellow compound detected at 412 nm. Tissue samples were homogenized (1:10 w/v) and centrifuge at 5000g while plasma was diluted 10 times with buffer prior to measurement as reported in literature[14, 15]. Peroxides were analyzed by ferrous oxide xylenol (FOX) orange assay according to a previously published method[16] on blood and liver samples prepared as above. Concentrations were expressed as nanomoles of H2O2 per gram wet weight.
2.5. Determination of Superoxide Dismutase and Catalase Activities
- Liver tissues extracts for enzyme activity were prepared as for ORAC assay. Protein content of the liver supernatants and red blood cells were determined using a modified Lowry’s method[17]. Both liver extracts and red blood cell samples were aliquot into 100 µL microtubes and stored in -80 °C until measurement of antioxidant enzyme activities. Superoxide dismutase (SOD) activity was measured based on the rate of reduction of nitroblue tetrazolium (2.24 mM) to formazan by xanthine oxidase (13.2 U/mL) at 560 nm[18]. Eight different concentrations of each sample (2-500 mg protein/mL) were used. SOD activities were calculated and expressed as units per milligram of protein. Catalase (CAT) activity was performed according to the method developed by Aebi[19]. The activity was based on the decay of a 30 mM H2O2 at 240 nm and expressed as k/mg protein where k is the first order reaction constant.
2.6. Statistical Analyses
- Data are as mean ± standard error (SE). Statistical differences were evaluated by a one-way analysis of variance using SPSS 11.0 for windows 7 (SPSS Inc., Chicago). Fisher’s least significant difference was used to determine significant difference between groups (P< 0.05).
3. Results
3.1. Composition of Digested Oat Proteins
- The amino acid (AA) composition of the trypsin oat protein hydrolysate (OPH) was determined after acid hydrolysis and pre-column derivatization using phenylisothiocyanate on reversed phase HPLC. The results showed that OPH contained aspartic acid (8.3%), glutamine, (21.1%), serine (7.3%), glycine (9.0%), histidine (2.1%), arginine (7.6%), threonine (4.2%), alanine (6.2%), proline (5.3%), tyrosine (3.3%), valine (4.9%), methionine (0.9%), cysteine (0.4%), isoleucine (4.0%), leucine (6.9%), phenylalanine (5.0%), and lysine (3.4%).
3.2. Effect of OPH on Blood Oxidative Stress Markers
- The oxidative status of the blood was evaluated by measuring its antioxidant scavenging power (i.e. ORAC), total sulfhydryl (-SH) groups and peroxide levels. There was no difference in ORAC values of red blood cells (RBCs) between ND (91.0 ± 6.7mM TE/mL) and HF diet (96.5 ± 6.6 mM TE/mL) groups (Table 1). Mice fed HF + 10 mg OPH/g had slightly lower ORAC value relative to ND and HF groups but this was not significantly different. RBCs of mice in group 4 (HF + 100 mg OPH/g) demonstrated significantly higher (p < 0.05) ORAC activity (123.3 ± 11.1 mM TE/mL) compared to other groups. No correlation was found between the amount of OPH in HF diet and the peroxyl radical scavenging activity. The Ellman’s assay was used to measure the total sulfhydryl groups (Table 1) on RBCs showed that ND, HF and HF + 10 mg OPH/g had similar total thiol concentrations. However, it was observed that group 4 (100 mg OPH/g group) had higher total thiol (p < 0.05) value relative to Group 1 (HF). Thiol concentrations in the presence of the three levels of OPH correlated well with the amount of OPH added to diet (R2 = 0.99). The levels of peroxides in plasma (Table 1) determined by the FOX assay showed HF diet significantly increased the amount of peroxides relative to ND (94.4 ± 10.3 µM H2O2). Supplementation of HF diet with OPH showed a slight reduction in peroxides values for group 2 mice (104.7 ± 7.4 µM H2O2) and a moderate increase for mice in group 3 (133.5 ± 18.7 µM H2O2) and group 4 (140.5 ± 22.3 µM H2O2) in comparison to mice in HF group (115.8 ± 11.4 µM H2O2). These changes, however, were not different. The level of OPH in the diet did not affect plasma ORAC values.The effect of OPH on the activity of SOD and CAT, two antioxidant enzymes that eliminate superoxide anion radical and hydrogen peroxide was determined in red blood cells. Mice on HF-diet had lower SOD activity (p < 0.05) than those on normal diet (Figure 1a). Supplementation with 100 mg OPH/g brought SOD activity to a level comparable with that of mice in ND group. In contrast, addition of OPH at 10 mg/g resulted in lower SOD activity relative to both 1- and 100-mg/g supplementation. CAT activity (Figure 1b) of mice in 10 mg/g and 100 mg/g supplemented groups were similar to the activity of ND mice but significantly lower (P < 0.05) than activities of both HF and 1 mg/g supplemented groups. The activity of catalase was found to decrease (R2 = 99) with increasing amount of OPH in HF diet however, there was no correlation with SOD activity.
|
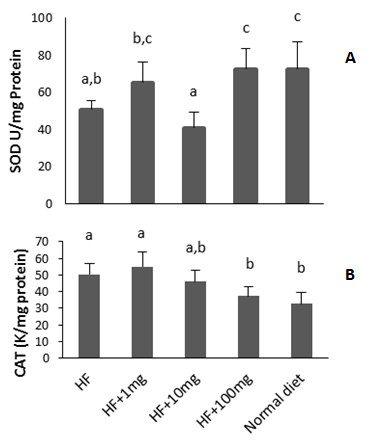 | Figure 1. Red blood cells antioxidant enzyme activities of mice that received control and high fat (HF) supplemented with 0mg, 1mg, 10mg and 100mg of oat protein hydrolysate for 21 days. (A): superoxide dismutase, (B): catalase. Values are means ± SEM (n = 10) and different letters indicate significantly different (P<0.05) |
3.3. Effect of OPH on Liver Oxidative Stress Markers
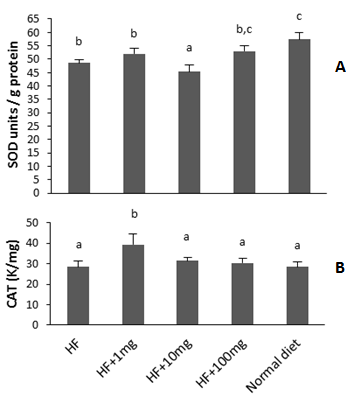 | Figure 2. Hepatic antioxidant enzyme activities of mice that received control and high fat (HF) supplemented with 0mg, 1mg, 10mg and 100mg of oat protein hydrolysate for 21 days. (A): superoxide dismutase, (B): catalase; K is the first order reaction constant. Values are means ± SEM (n = 10) and different letters indicate significantly different (P<0.05) |
3.4. Measurement of Body Weight, Blood Glucose and Respiratory Exchange Ratio
- Average body weight of mice fed the HF diet and HF containing OPH were significantly higher than those of mice fed the control diet (ND). However, no bodyweight difference was observed between mice in the HF group and the HF + OPH groups (Table 1). The mean energy intake (kcal/day) during the experiment was higher (P < 0.05) in HF and HF + OPH diet fed mice relative to ND mice group. Blood glucose (Table 1) measured at the last day of the experiment in non-fasted mice showed that glucose level of mice in group 3 (10 mg OPH/g HF-diet) was higher (P < 0.05) relative to levels in all other groups. The respiratory exchange ratio (RER) which is a ratio of carbohydrate oxidation to lipid oxidation assuming protein oxidation is negligible[20] revealed that the HF diet group had a RER of 0.81 ± 0.01 which was significantly lower relative to RER values in other groups indicating that HF fed animals were largely using fatty acids as an energy source (Table 1). The RER value of group 2 (1 mg OPH/g HF diet) was lower (p < 0.05) than ND however, 10 mg and 100 mg OPH/g HF diet groups RER values were similar to RER value of ND group.
4. Discussion
- This study found that the addition of OPH to high fat had some positive effects on peroxyl radical scavenging and antioxidant enzyme activities in mice. High fat or high calorie diets contribute to increase bodyweight and obesity, oxidative stress, chronic inflammation, inadequate antioxidant defenses, or hyperleptinemia[21]. Adequate dietary antioxidant protection is then critical for the maintenance of tissue redox balance. In fact, low intake of protective antioxidants and phytochemicals in the diet is linked to oxidant-antioxidant imbalance in obesity[22] .
4.1. Oxidative stress Status of Blood and Liver
- In plasma at the exception of group 2 (HF+1 mg), there was an increase of total peroxides in other HF-fed groups relative to ND group. In contrast, all groups had comparable plasma peroxyl radical scavenging capacity (ORAC assay). Plasma and red blood cells had different scavenging potential probably because they contain different proteins and small molecules are also present in plasma. Thiol containing peptides are known to possess radical scavenging properties and in this study, their levels increased in red blood cell samples. A previous study has reported an increase in plasma protein and glucose oxidation products but not in plasma lipid or plasma antioxidant enzymes of rats fed HF diet supplemented with polyphenols[7]. The production of H2O2 has been shown to increase in adipose tissue of obese mice, but not in liver, skeletal muscle, and aorta[2]. In the later research, lipid hydroperoxides (LOOH) was measured while in the present study total peroxides (LOOH + H2O2 + ROOH) were measured. In red blood cells, we found that peroxyl radical scavenging activity (ORAC) was high in mice fed HF+100 mg OPH/g HF-diet. The higher ORAC value of this group could be attributed to the high concentration thiol moieties present in their red blood cells as indicated by data from the Ellman’s assay. It is therefore possible that oat bran protein hydrolysate enhanced the synthesis of thiol-containing proteins. The combined percentage of cysteine and methionine, two sulfur-containing amino acids in the OPH was found to be 1.3%. Catalase activities of ND, HF+10, and HF+100 mg OPH/g were similar but lower than those of HF and HF+1mg OPH/g groups. We found that CAT activity decreased with increasing OPH concentrations. A decreased in CAT activity was also reported in rats on hypo-energetic or hyper-energetic diet supplemented with tomato powers that contained the antioxidant lycopene molecule[23].Increase intake of a high fat (HF)-diet could result in greater production of ROS or greater fat accumulation in the liver and compromise its ability to regulate body energy homeostasis[24]. Increase ROS in the liver cause inflammation that may contribute to non-alcoholic liver disease[25]. In this study, all groups had similar hepatic peroxides level. There are conflicting literature data regarding liver peroxidation. Some studies have reported an increase in concentrations of markers of lipid peroxidation in rat models fed a high fat diet[25] while others have reported no change[2]. It was demonstrated that supplementation of high energy diets with tomato power decreased the concentration of malondialdehyde, an end product of lipid peroxidation in rats but had no effect on the activity of catalase in rat livers[23]. In the present study, hepatic SOD activity was 13.2% lower in mice on HF diet compared to those on normal diet. Addition of oat protein hydrolysate at 100 mg/g HF-diet brought SOD activity to a similar level with ND group value. There was an increase of peroxide values in mice fed 10 and 100 mg OPH/g HF-diet relative to those who received 1 mg OPH/g. This could be partly explained by the higher activity of CAT for mice on 1 mg OPH/g relative to those on 100 mg OPH/g. Gallic acid was reported to decrease body weight and hepatic oxidative stress by increasing the activity of the enzyme glutathione peroxidase that detoxifies peroxides in HF diet fed rats[26]. In contrast, no difference in hepatic SOD or CAT activities was found when high-fat high-sucrose rats’ diet was supplemented with polyphenols[7]. Wheat bran xylooligosaccharides addition to HF diet increased the activity of SOD in liver to equivalent level detected in normal group rats. Another study found that soy protein isolates and hydrolysates reduce hepatic oxidative stress in dietary obese rats by increasing the activity of enzymes involved in lipid metabolism[27].
4.2. Respiratory Exchange Ratio, Bodyweight and Glucose Level
- In this study, RER was measured to see if oat protein hydrolysate (OPH) was a contributor to body metabolic rate. Animals that received the HF-diet supplemented with OPH had higher RER values than those that received the HF-diet alone suggesting that the OPH supplement prevents the metabolic change that is produced by consuming a diet rich in fat. These changes were not due to changes in locomotor activity in the animals, and it remains unclear if they would be beneficial given that under normal conditions an increase in RER could actually predict weight gain[28]. In the present study, animals were chronically exposed to a high fat diet that would necessarily change metabolism to utilize the main substrate of the diet, and the important issue here is that the OPH supplement partially prevented this metabolic change. As expected, mice exposed to the high fat diet with or without the supplements consumed more calories than chow (ND) fed mice and this led to an increase in body weight. Similarly, mice on group 3 (HF + 10 mg OPH/g) had higher blood glucose level relative to those on group 2 and group 4 (1- and 100-mg OPH/g HF diet). Given the RER results, this may be due to OPH induced changes in metabolism that increased the utilization of carbohydrates, perhaps in part by facilitating the release of glucose. Nevertheless, given that mice were not fasted overnight, differences in blood glucose levels may be related to nutrients recently consumed.
5. Conclusions
- This study demonstrated that in a mice model receiving high fat diet, the addition of OPH to HF diet increased the scavenging activity of erythrocytes probably through increased synthesis of thiol-containing peptides. It also increased erythrocytes SOD activity and slightly affected liver SOD and CAT activities. In certain cases, there was opposing effect of 1 and 100 mg OPH/g compared to 10 mg OPH/g and further study is needed to find the optimum concentration of OPH and full mechanisms of action.
ACKNOWLEDGEMENTS
- This work was supported by a grant from National Science and Engineering Research Council of Canada.